
Summary
To the best of our knowledge, no prior research has assessed both the additional radiation dose and contrast usage associated with adjunctive technologies, as well as their interaction with other predictors of radiation and contrast usage. In real-world clinical settings, the use of adjunctive technologies led to a significant increase of approximately 70% in patients’ radiation dose and contrast usage, as well as more than a two-fold increase in irradiation and procedural times.
Introduction
The information about the functional significance of a lesion provided alongside coronary angiography (CA) by adjunctive technologies (AT), such as fractional flow reserve (FFR) and instantaneous wave-free ratio (iFR) is crucial, as revascularizing hemodynamically insignificant stenoses not only fails to improve clinical outcomes but may also be potentially harmful [1]. Intracoronary imaging techniques, including intravascular ultrasonography (IVUS) and optical coherence tomography (OCT), provide valuable insights into lesion characteristics, further aiding clinicians in determining the necessity of intervention and optimizing stent placement and deployment [2]. Notably, the integration of intravascular imaging is vital in the assessment of coronary artery calcifications, thereby tailoring the most effective calcium-modifying strategies for each calcified lesion and guiding comprehensive stent optimization [3]. Unfortunately, the use of these AT requires additional amounts of radiation and contrast, which increase the risks of radiogenic malignancy, cardiovascular disease, and contrast-induced nephropathy (CIN) in patients [4–6]. Until more advanced minimally invasive computational methods, such as the quantitative flow ratio (QFR) [7, 8], are integrated into contemporary clinical guidelines, FFR, iFR, IVUS, and OCT remain the preferred assisted-CA technologies for assessing lesion severity and guiding percutaneous coronary interventions. Therefore, it is important to assess their impact on radiation and contrast. In this context, previous studies quantified the additional radiation and contrast required for performing AT [9, 10], but they did not assess the interaction between AT and other radiation and contrast predictors. Another study demonstrated that the use of FFR, IVUS and OCT in hemodynamics did not alter the patient’s radiation dose and had a minimal effect on contrast usage [11], though it did not quantify the extra volume of dye administered.
Aim
The present study aimed to provide further insight into the additional patient radiation dose, irradiation time, procedural duration, and contrast usage required for performing AT in real-world clinical settings. Additionally, predictors of increased dose-area product (DAP) and contrast usage were identified.
Material and methods
Study population and data collection
Our catheterization laboratory procedure database was used to compare data from a retrospective cohort of 258 consecutive patients undergoing CA between February 2019 and September 2024 with no AT use (NoAT group) with a retrospective cohort of 258 consecutive patients who underwent CA assisted by iFR, FFR, IVUS, OCT or a combination of these (AT group) between March 2015 and September 2024. The present study includes procedures performed by a highly experienced interventional cardiologist (performing over 500 CAs annually), referred to hereafter as the operator, to remove inter-operator variation. Assistance was provided by several interventional cardiology fellows, with one assigned to each procedure. Patient characteristics such as weight, height, gender and age, as well as procedural details including vascular territory of the lesion, CA result, indication for CA, volume of used contrast, DAP, fluoroscopic and procedural duration, access route, and type of AT (if utilized), were collected for each procedure. Additionally, the presence or absence of comorbidities, including hypertension (HT), dyslipidemia (DLP), diabetes mellitus (DM), and chronic kidney disease (CKD), was retrieved from the patients’ medical records. Procedural duration was defined as the time elapsed from arterial puncture to arterial closure, achieved through the application of a hemostatic bandage after sheath removal. Only successful procedures from both patient groups were included. During the study period, the operator performed 20 additional AT-assisted CAs (7.2% of the total procedures), which were unsuccessful due to inability to advance the wires or AT system failure.
Equipment and endpoints
A Siemens single-plane (Siemens, Artis Zee, Erlangen, Germany) cardiac angiography unit facilitating real-time measurements of DAP and fluoro-time, was used for all procedures. Fluoroscopy and cineangiography were performed at 15 frames per second (fps) in both groups. FFR and iFR were measured using a wire equipped with a miniaturized pressure sensor (Philips OmniWire, Volcano, San Diego, USA). IVUS was performed with a digital catheter (Eagle Eye Platinum ST, Volcano, San Diego, USA), while OCT was performed with an imaging catheter (Dragonfly OpStar, Abbott Medical, Westford, USA). AT procedures were categorized as ad-hoc when performed immediately following CA, and as elective when carried out at a subsequent, later stage. They were further classified as either single or multiple, with the former involving the use of one AT device (e.g., wire or catheter) at a single vessel, while the latter included those carried out with more than one device, either of the same or different technology, at one or more vessels, as well as those performed with one AT device at multiple vessels. Patients’ radiation exposure was quantified using DAP and effective dose (ED). The ED (in mSv) was estimated by multiplying DAP (in Gy·cm2) with a conversion factor, i.e., 0.2 for adult males and 0.28 for adult females, as recommended by the European Heart Rhythm Association practical guide [12]. DAP was chosen as the primary endpoint since it provided a direct measurement, while ED was an estimation. Contrast (Scanlux) usage was also considered a primary endpoint. Secondary endpoints included irradiation and procedural times.
Statistical analysis
The statistical analysis was performed using the SPSS Statistics software package, version 25.0 (IBM Corp., Armonk, NY, USA). Categorical variables are presented in terms of counts and percentages, and their associated intergroup differences were evaluated with the χ2 test. Continuous variables are presented as mean ± standard deviation (SD). After assessing their normality with the Shapiro-Wilk test, the means of normally distributed variables between two groups were compared using Student’s t-test, while differences in variables not following normality were assessed using the Mann-Whitney U test. A multiple linear regression analysis was conducted using DAP and contrast usage as the primary outcome variables and investigating various predictors. The natural logarithm of both variables was modeled due to their positively skewed distributions. Predictor variables considered key descriptors of radiation, patient characteristics, disease, or procedure were included in the model if they demonstrated a significant impact (p ≤ 0.05) on the primary outcome variables in preliminary univariable linear regression analysis and exhibited no or a weak correlation (Pearson’s correlation coefficient < 0.2) with one another. Dummy coding was employed for handling multi-level categorical predictor variables in both regression analyses. A free intercept was employed in the multivariate analysis. The assumptions of our multilinear model were checked in SPSS through various diagnostic tools, including histograms and normal probability-probability (P-P) plots, scatter plots of the residuals, variance inflation factor (VIF) values, Durbin-Watson test, etc. The obtained exponentiated beta-coefficients provide the relative influence of each variable on DAP and contrast usage. The proportion of missing values for all variables was below 5%, except for procedural time, which had a proportion of incompleteness equal to 9.5% for the entire patient group and 14.7% for the AT patient group. Missing values were estimated using multiple imputation when procedural time was involved in the analysis, while they were simply excluded when it was not. To account for potential confounders that could influence the effectiveness of utility of AT (UAT) in DAP and contrast usage, we conducted a univariate analysis of variance with covariates included. A two-sided p ≤ 0.05 was considered significant.
Results
Baseline and procedural characteristics for both groups are summarized in Table I. More than 75% of patients in each group were male and underwent procedures via right radial artery (RRA) access. The entire cohort had a mean age of 67.9± 10.0 years and a mean body mass index (BMI) of 27.79 ±4.21 kg/m2. However, the AT group comprised younger patients with a higher BMI (p ≤ 0.05). Weight and height were not recorded in 7 cases, leading to 1.3% missing data for BMI. The majority of patients in both groups presented with HT and DLP, whereas a smaller proportion presented with DM and CKD. Prevalence of HT, DM, and DLP did not differ significantly between the groups, whereas marginally significant differences were observed with respect to CKD (p = 0.06). More patients in the NoAT group underwent coronary artery bypass graft (CABG) procedures prior to CA than those in the AT group (p < 0.001). Out of the 14 procedures performed on patients with a history of CABG, 8 were carried out via the left radial access route, while 6 were conducted using the femoral access route.
Table I
Baseline and procedural characteristics for both patient groups
| Baseline and procedural characteristics | NoAT group (N = 258) | AT group (N = 258) | P-value |
|---|---|---|---|
| Age [years] | 68.9 ±10.1 | 66.9 ±9.9 | 0.01* |
| Male, sex | 213 (82.6%) | 213 (82.6%) | – |
| BMI [kg/m2] | 27.48 ±4.37 | 28.11 ±4.02 | 0.05* |
| DM | 96 (37.6%)† | 86 (34.8%)† | 0.51‡ |
| HT | 202 (79.2%)† | 179 (72.5%)† | 0.08‡ |
| DLP | 177 (69.4%)† | 165 (66.8%)† | 0.53‡ |
| CKD | 13 (5.1%)† | 5 (2.0%)† | 0.06‡ |
| Access route | 0.61‡ | ||
| RRA | 198 (76.7%) | 198 (76.7%)§ | |
| RFA | 16 (6.2%) | 21 (8.1%)§ | |
| Other | 44 (17.1%) | 39 (15.1%) | |
| Prior CABG | 11 (4.3%) | 3 (1.2%) | < 0.001‡ |
Table II Displays the AT used, along with its associated characteristics. 78.7% of patients underwent AT immediately after CA (ad-hoc), while the remainder underwent the procedure electively. Most procedures (36.8%) involved a combination of iFR and FFR. When only one AT was used, iFR was the most common, accounting for 25.2%. Additionally, 20.2% of procedures involved multiple AT, excluding iFR + FFR, which were performed with the same wire. The majority of procedures (48.4%) were conducted in the left anterior descending artery (LAD), followed by 15.5% in the right coronary artery (RCA), 11.2% in the left circumflex artery (LCX), 8.5% in the left main coronary artery (LM), and 1.6% in various combinations of these vessels.
Table II
Characteristics of adjunctive technologies
| Parameter | AT characteristics | N (%) |
|---|---|---|
| Process type | Ad-hoc/elective | 203 (78.7%)/55 (21.3%) |
| Technology | iFR/FFR/IVUS/OCT | 65 (25.2%)/32 (12.4%)/38 (14.7%)/7 (2.7%) |
| iFR + FFR/iFR + IVUS/FFR + IVUS/OCT + IVUS | 95 (36.8%)/4 (1.6%)/7 (2.7%)/1 (0.4%) | |
| iFR + FFR + IVUS/iFR + FFR + OCT | 8 (3.1%)/1 (0.4%) | |
| Assessed vessel | LAD/LCX/RCA/LM/IM | 125 (48.4%)/29 (11.2%)/40 (15.5%)/22 (8.5%)/1 (0.4%) |
| LAD + LCX/LAD + RCA/LAD + LM/LCX + LM/LCX + RCA | 15 (5.8%)/8 (3.1%)/11 (4.3%)/2 (0.8%)/1 (0.4%) | |
| LAD + LCX + RCA/LCX + RCA + LM | 2 (0.8%)/2 (0.8%) | |
| Single/multiple* | 206 (79.8%)/52 (20.2%) |
Table III presents and compares the unadjusted (for confounding variables) and adjusted mean values of DAP, ED, irradiation, and procedural time, along with the contrast usage between the two groups. Overall, all parameters were found to be significantly higher in the AT group (p < 0.001). Using NoAT values as a reference, DAP, patient ED, and contrast usage were 71.8%, 72.6%, and 70.5% higher, respectively, in the AT group. Moreover, irradiation time and procedural duration were 115.2% and 135.2% longer in the AT group compared to the NoAT group. After adjusting for potential confounders – specifically, baseline (including BMI) and procedural characteristics – that differed significantly (p ≤ 0.05) between the two groups, the adjusted means of DAP and ED decreased by 1.8% and 1.4%, respectively. In contrast, the percentage differences between the adjusted means of irradiation time and contrast usage increased by 4.8% and 2.0%, respectively, while the percentage difference of procedural time remained unaltered.
Table III
Mean values of dose-area product, patient’s effective dose, irradiation and procedural time, as well as contrast of two groups. Unadjusted for confounding variables and adjusted for confounding variables
| Metric | NoAT group* | AT group* | P-value† | PD‡ |
|---|---|---|---|---|
| Unadjusted | ||||
| DAP [Gy·cm2] | 60.18 ±25.10 | 103.38 ±42.40 | < 0.001 | 71.8 |
| ED [mSv] | 12.69 ±5.04 | 21.90 ±9.02 | < 0.001 | 72.6 |
| Irradiation time [min] | 4.6 ±2.2 | 9.9 ±4.5 | < 0.001 | 115.2 |
| Procedural time [min] | 16.2 ±7.6 | 38.1 ±14.7 | < 0.001 | 135.2 |
| Contrast [ml] | 78.9 ±26.5 | 134.5 ±49.6 | < 0.001 | 70.5 |
| Adjusted | ||||
| DAP [Gy·cm2] | 60.52 ±32.00 | 102.91 ±32.01 | < 0.001 | 70.0 |
| ED [mSv] | 12.70 ±6.67 | 21.75 ±6.68 | < 0.001 | 71.2 |
| Irradiation time [min] | 4.5 ±3.5 | 9.9 ±3.6 | < 0.001 | 120.0 |
| Procedural time [min] | 16.2 ±11.5 | 38.1 ±11.5 | < 0.001 | 135.2 |
| Contrast [ml] | 78.3 ±39.3 | 135.1 ±39.3 | < 0.001 | 72.5 |
The following results were obtained from an analysis focused exclusively on the primary outcome variables, i.e., DAP and contrast usage, conducted on both the whole patient group dataset and the AT group dataset (Table IV). Specifically, P-values are presented, derived from the univariate regression analysis that examines the relationship between the natural logarithms of the primary outcome variables and various key predictor variables, whether continuous or dichotomous. Also shown are multivariate regression analysis results expressed as fold change (exponentiated beta coefficients) in DAP and contrast usage, respectively, derived from the impact of each predictor variable that demonstrated a significant impact (p ≤ 0.05) in preliminary univariate analysis. The associated changes are accompanied by 95% confidence intervals (95% CI) and p-values. In the whole group, univariate analysis showed that neither DAP nor contrast usage was significantly related to comorbidities. Additionally, DAP was not associated with procedures performed on patients who had previously undergone CABG surgery, and contrast usage was not linked to age. Hence, these variables were excluded from the subsequent multivariate analysis, which demonstrated that DAP and contrast usage were primarily influenced by UAT. Both primary outcome variables were also significantly associated with gender. Specifically, UAT was associated with approximately a 1.7-fold increase in both DAP and contrast usage (95% CI: 1.6–1.8; p < 0.001). Male gender was associated with a 1.32-fold increase in DAP (95% CI: 1.21–1.44; p < 0.001) and a 1.13-fold increase in contrast usage (95% CI: 1.05–1.21; p < 0.01). Moreover, each unit increase in BMI conferred a 1.05-fold increase in DAP (95% CI: 1.04–1.05; p < 0.001), and procedures performed on patients with prior CABG surgery were linked to a 1.42-fold increase in contrast usage (95% CI: 1.19–1.68; p < 0.001). In univariate analysis, age and BMI were significantly associated with DAP and contrast usage, respectively, but in multivariate analysis these relationships were not significant.
Table IV
Results of univariate and multivariate regression analysis for dose-area product and contrast usage. Obtained from the whole patient group dataset and the AT group dataset
| Group | Variable | Analysis | ||||
|---|---|---|---|---|---|---|
| Primary outcome | Predictor | Univariate | Multivariate* | |||
| P-value | Fold change | 95% CI | P-value | |||
| Whole group dataset | LnDAP | Age | < 0.001 | 1.001 | 1.00–1.01 | 0.08 |
| BMI† | < 0.001 | 1.05 | 1.04–1.05 | < 0.001 | ||
| Gender‡ | < 0.001 | 1.32 | 1.21–1.44 | < 0.001 | ||
| UAT§ | < 0.001 | 1.69 | 1.59–1.80 | < 0.001 | ||
| DM§ | 0.06 | |||||
| HT§ | 0.58 | |||||
| CKD§ | 0.35 | |||||
| DLP§ | 0.40 | |||||
| Prior CABG§ | 0.29 | |||||
| LnContrast | BMI | 0.03 | 1.004 | 1.00–1.01 | 0.29 | |
| Gender | < 0.01 | 1.13 | 1.05–1.21 | < 0.01 | ||
| Prior CABG | 0.05 | 1.42 | 1.19–1.68 | < 0.001 | ||
| UAT | < 0.001 | 1.69 | 1.59–1.79 | < 0.001 | ||
| Age | 0.19 | |||||
| DM | 0.76 | |||||
| HT | 0.24 | |||||
| CKD | 0.76 | |||||
| DLP | 0.88 | |||||
| AT group dataset | LnDAP | AT process type| | 0.02 | 0.88 | 0.80–0.98 | 0.02 |
| Procedural time¶ | < 0.001 | 1.009 | 1.006–1.012 | < 0.001 | ||
| DM | 0.04 | 1.04 | 0.96–1.14 | 0.36 | ||
| BMI | < 0.001 | 1.04 | 1.03–1.06 | < 0.001 | ||
| Number of AT procedures** | < 0.001 | 1.16 | 1.04–1.29 | < 0.01 | ||
| Gender | < 0.01 | 1.20 | 1.08–1.34 | < 0.001 | ||
| Age | 0.26 | |||||
| HT | 0.39 | |||||
| DLP | 0.34 | |||||
| Access route†† | 0.29 | |||||
| LnContrast | AT process type | < 0.001 | 0.78 | 0.71–0.86 | < 0.001 | |
| Access route | < 0.01 | 0.90 | 0.83–0.99 | 0.02 | ||
| Procedural time | < 0.001 | 1.009 | 1.006–1.012 | < 0.001 | ||
| Number of AT procedures | < 0.001 | 1.09 | 1.00–1.20 | 0.05 | ||
| Gender | < 0.01 | 1.12 | 1.02–1.23 | 0.02 | ||
| Age | 0.89 | |||||
| BMI | 0.31 | |||||
| DM | 0.97 | |||||
| HT | 0.32 | |||||
| DLP | 0.53 | |||||
AT – adjunctive technology, BMI – body mass index, CABG – coronary artery bypass graft, CI – confidence interval, CKD – chronic kidney disease, DAP – dose-area product, DLP – dyslipidemia, DM – diabetes mellitus, HT – hypertension,
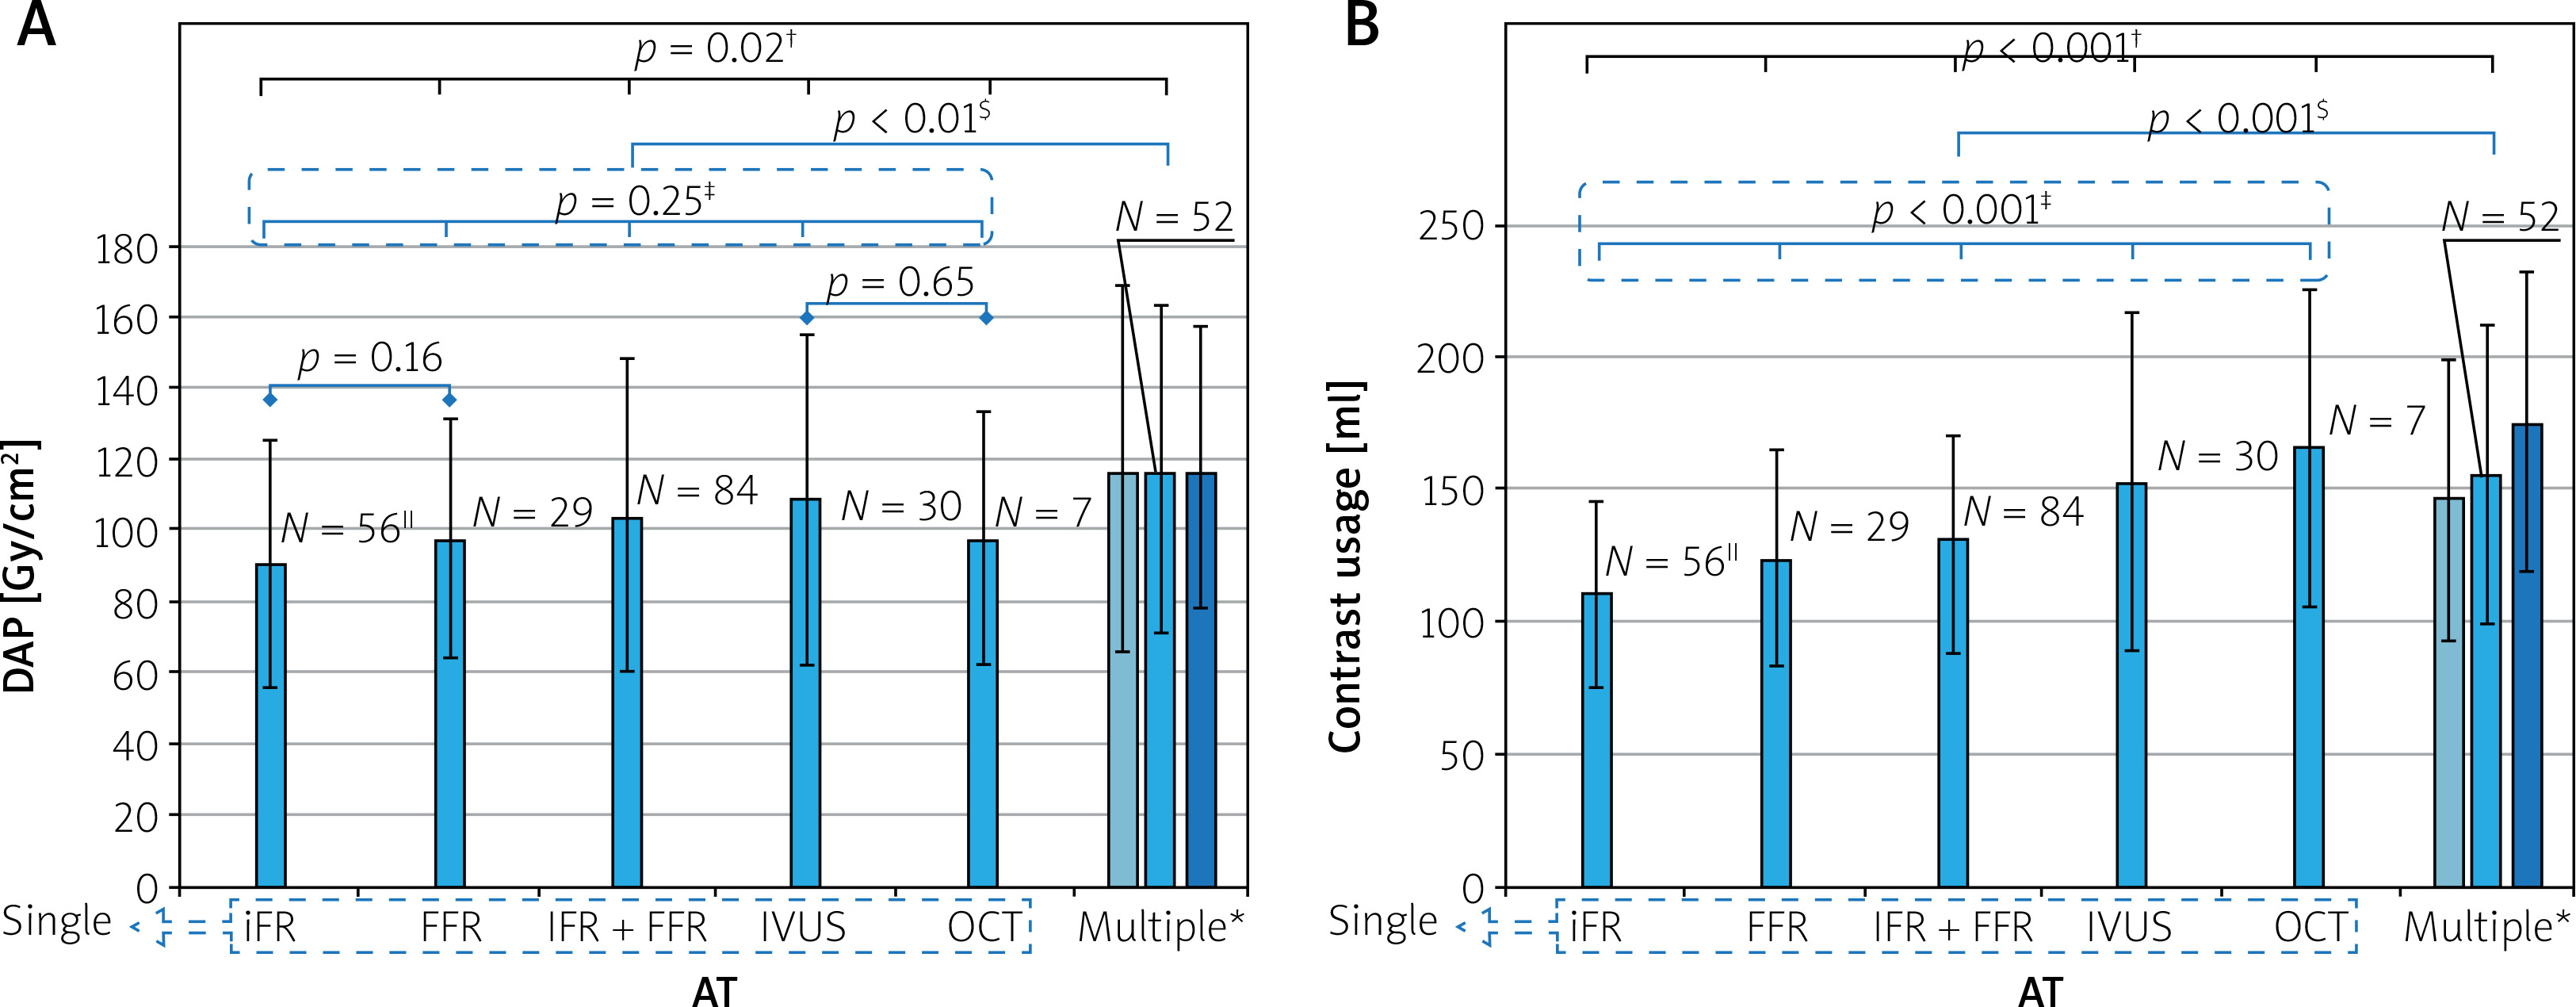
Figures 1 A and B display the mean values of DAP and contrast usage, respectively, required for performing single and multiple AT procedures. The bars represent the mean values, while the error bars indicate standard deviations. The p-value for the overall comparison is indicated in black, while the p-values for subgroup comparisons between single AT are shown in blue. A significant difference in DAP was observed across the AT (p = 0.02), but no significant differences were found between single AT (p = 0.25). Mean DAP for multiple AT was significantly higher than that of the single AT (117.07 ±46.50 Gy·cm2 vs. 99.28 ±40.70 Gy·cm2; p < 0.01). Significant differences in contrast usage were observed both across all AT and among all single AT (p < 0.001). Furthermore, the use of multiple AT procedures resulted in significantly higher mean contrast usage compared to the single ones (128.8 ±46.2 ml vs. 117.1 ±46.5 ml; p < 0.001).
Figure 1
Bar graph illustrating the two primary outcome variables for performing various single and multiple adjunctive technologies. A – Dose-area product; B – contrast usage. The bars (shown in blue) represent the mean values, with error bars indicating standard deviations
AT – adjunctive technology, DAP – dose-area product, FFR – fractional flow reserve, iFR – instantaneous wave-free ratio, IVUS – intravascular ultrasound, OCT – optical coherence tomography. *In the multiple AT category, the medium bar represents all multiple procedures (shown in blue), the left bar (shown in light blue) represents procedures performed with one AT device at multiple vessels and the right bar (shown in dark blue) represents those carried out with more than one device, either of the same or different technology, at one or more vessels. †P-value for the overall AT comparison, shown in black. ‡P-value for the comparison of all single ATs, shown in blue. §P-value for the comparison between multiple and single AT, shown in blue. ||N represents the number of procedures.
Discussion
The present study revealed that patients’ radiation dose, in terms of DAP and ED, was significantly higher by ~70% in the AT group compared to the NoAT group. This difference can primarily be attributed to the UAT, which had the greatest impact on DAP (Table IV). Notably, the UAT led to a median DAP of 94.06 Gy · cm2, which far exceeds the European diagnostic reference level (DRL) for CA (35 Gy · cm2) and, to a lesser extent, the DRL for percutaneous coronary intervention (85 Gy · cm2) [13], underscoring the need for a thorough investigation and highlighting the potential for improving our current practices. In this regard, a practice which combined a reduction in fluoroscopic frame rate from 15 to 7.5 fps with increased collimation [14], used by another interventional cardiologist of our catheterization laboratory in 28 patients who underwent CAs assisted by AT, resulted in a significant reduction in mean DAP by ~37% (103.38 ±42.40 Gy · cm2 vs. 66.00 ±31.27 Gy · cm2; p < 0.001), without significantly affecting mean fluoro-time (9.2 ±4.4 min vs. 8.8 ±4.3 min; p = 0.74) or procedural time (37.9 ±14.9 min vs. 38.8 ±11.9 min; p = 0.41). However, a larger patient sample undergoing procedures with this dose-reduction practice, along with a more robust statistical analysis accounting for baseline and procedural covariates, will be necessary to further validate and refine these findings, objectives to be addressed in future studies. Compared to iFR and FFR, significant reduction of additional radiation without loss of diagnostic accuracy can be achieved through the application of QFR [15], a wireless method for FFR computation that uses a software package to analyze ordinary CA images acquired with conventional and, if necessary, additional specific angulations. However, QFR requires specialized software, along with the associated costs.
Male gender and increasing BMI were significant predictors of elevated DAP in both the whole and AT group analyses, consistent with findings from previous studies [16]. Notably, males were associated with higher DAP than females, even though the groups do not have significantly different mean BMIs (whole group: 27.86 ±3.99 kg/m2 for males vs. 27.49 ±5.14 kg/m2 for females, p = 0.40; AT group: 28.24 ±3.97 kg/m2 for males vs. 27.48 ±4.26 kg/m2 for females, p = 0.44). A potential reason for this gender-based difference could be weight, as males were heavier than females (whole group: 83.1 ±14.3 kg for males vs. 70.0 ±14.8 kg for females, p < 0.001; AT group: 84.2 ±15.0 kg for males vs. 70.0 ±11.2 kg for females, p < 0.001). Heavier patients require higher doses due to the automatic exposure control (AEC) feature, which amplifies tube voltage and current to maintain optimal radiation levels at the image receptor, compensating for the increased amount of tissue traversed by X-rays. Additionally, multivariate analysis of the AT group revealed a significant association of DAP with AT process type, procedural time, and number of AT procedures (Table IV). After CA, performing AT processes on an ad-hoc basis, rather than electively, resulted in a lower DAP. Prior to UAT, elective processes required repeating the angiography of the vessels being assessed, which led to a DAP increase compared to ad-hoc processes. Obviously, DAP increases with the number of AT procedures, especially when AT are performed on multiple vessels (Figure 1 A). When multiple AT are used on a single vessel, this trend can be attributed to the need for re-irradiation while advancing a new AT device (wire or catheter) into the target vessel and accurately positioning it within the stenotic segment. However, no significant differences in DAP were observed between single AT procedures (Figure 1 A). Although FFR resulted in a higher DAP than iFR, the difference was not significant (97.72 ±33.72 Gy · cm2 vs. 90.31 ±34.87 Gy · cm2; p = 0.16), consistent with the findings of Ziubryte and Jarusevicius [17]. Additionally, no significant differences were found between the radiation doses received by patients from IVUS and OCT (22.94 ±9.48 mSv vs. 20.71 ±7.69 mSv; p = 0.63), in alignment with the results of Januszek et al. [10]. Univariate analysis performed within the single AT subgroup indicated that DAP was not significantly correlated with any of the used AT (iFR vs. other AT: p = 0.09; FFR vs. other AT: p = 0.64; iFR + FFR vs. other AT: p = 0.60; IVUS vs. other AT: p = 0.29; OCT vs. other AT: p = 0.90).
Similar to the findings for DAP, the current study also demonstrated a ~72.5% increase of contrast use in the AT group compared to the NoAT group (78.3 ±39.3 ml vs. 135.1 ±39.3 ml; p < 0.001), mainly due to the UAT. Notably, this additional volume of contrast may rise from ~57 to ~97 ml when lesions are assessed using multiple AT (78.3 ±39.3 ml vs. 175.7 ±57.1 ml) (Figure 1 B). This is a significant finding, as every additional 100 ml of contrast medium administered increases the CIN risk score by one point on the Mehran scoring system [18]. This risk further escalates if patients undergo a repeat intervention within 24–72 h [17], a scenario observed in 13.6% of the AT group patient population. Notably, for patients with pre-existing CKD, the risk is low (7.5%) [19], but it can rise to a moderate level (14%) after successive interventional procedures. Previous studies have also observed a further amplification of risk among elderly patients and those with HT and/or DM [5], emphasizing the need to administer a reduced amount of contrast to them. However, our multivariate analysis did not identify CKD, HT, DM, or age as significant predictors of contrast volume usage. This lack of significance for HT, DM, and age can likely be attributed to the urgent nature of some procedures and the operator’s general effort to limit contrast use across all patients, not just those who are elderly or have HT and/or DM. As for CKD, a larger sample size would be necessary to draw a definitive conclusion, as these patients comprised a small minority (2%) of the AT group. However, appropriate management of patients at risk is crucial for the prevention of CIN. Approaches aiming to minimize contrast usage, i.e., ultra-low contrast CA, should be prioritized by operators, despite the potential downside of increased acquisition frame rates [19]. Moreover, administering contrast through advanced systems instead of manual injection during CA significantly reduces the volume of contrast delivered to the patient and the incidence of CIN [20, 21]. In centers lacking these technologies, catheterization laboratory staff should closely monitor the amount of contrast used during a procedure and maintain regular communication with the operating interventionist. Once a patient-specific contrast limit has been reached, consideration should be given to staging further procedures if clinically appropriate [22]. Furthermore, comparing contrast use across either the three physiological modalities or the two intravascular imaging techniques may aid in clinical decision-making to determine the most suitable patient-specific AT. In the present study, no significant differences were observed between iFR and FFR (111.1 ±34.9 ml vs. 124.8 ±40.8 ml; p = 0.06). Conversely, a significant difference of ~17% was detected when comparing iFR with the hybrid iFR + FFR scheme (111.1 ±34.9 ml vs. 130.0 ±40.9 ml; p = 0.004). However, this difference may not be substantial enough to preclude the use of the hybrid scheme, when iFR values fall between 0.86 and 0.93. Compared to IVUS, OCT is expected to be associated with higher contrast volumes, as it requires temporary catheter flushing to clear blood from the imaging field. However, in the present study, no significant difference was found between IVUS and OCT volumes (153.3 ±64.0 ml vs. 165.7 ±60.2 ml; p = 0.68), contrasting with findings reported by Januszek et al. [10]. Nonetheless, a larger OCT sample size would be necessary to draw definitive conclusions, as patients undergoing OCT comprised only a small subset (3.5%) of the single AT subgroup. Univariate analysis performed within the single AT subgroup revealed that contrast usage was significantly correlated with iFR and IVUS (iFR vs. other AT: p = 0.002; FFR vs. other AT: p = 0.87; iFR + FFR vs. other AT: p = 0.44; IVUS vs. other AT: p = 0.04; OCT vs. other AT: p = 0.06). However, multivariate analysis demonstrated that contrast usage was not significantly associated with the two prementioned AT (iFR vs. other AT: p = 0.13; IVUS vs. other AT: p = 0.31). Instead, it was significantly linked to AT process type, patient gender, and procedural duration (Table IV). While contrast reduction is essential in preventing CIN, adequate patient hydration remains the cornerstone for this prophylaxis. Interestingly, a simplified rapid hydration was found to be non-inferior to standard hydration in preventing CIN in patients with CKD undergoing CA [23].
Multivariable analysis, performed on both the entire dataset and the AT group (Table IV), revealed a significant association between male gender and increased contrast administration, consistent with the findings of De la Garza-Salazar et al. [11]. These gender-based differences may be attributed to larger coronary artery volumes in males compared to females [24], with males requiring a larger volume of contrast to adequately fill their vessels for optimal visualization. Analysis of the entire group revealed that procedures performed on patients with a history of CABG resulted in a significant increase in contrast use, likely due to the need for larger volumes of contrast to visualize the graft bypass vessels in addition to native coronary vessels. The significant association between contrast usage, AT process type, and the number of AT procedures observed in the AT group analysis is explained by the same reasons previously mentioned for DAP. Moreover, RRA access route was associated with a significant decrease in contrast use, aligning with the results of some studies [11, 16], but contradicting the conclusions of other researchers who reported the opposite effect [25, 26]. Our finding may be partly explained by the fact that all procedures on prior-CABG patients, which required more contrast, were performed through the left radial artery and femoral access routes, rather than through the RRA. It is crucial for the operator to be aware of the patency of all grafts, as this can reduce the need for extensive angiography of the native coronary arteries, potentially saving contrast. In this regard, radiopaque bypass graft markers placed by CABG surgeons at the origin of the graft on the ascending aorta help the operator to clearly visualize the graft’s location during follow-up coronary angiography, thereby reducing the amount of contrast used [27].
It is evident, even without additional analysis, that the implementation of adjunctive technologies (AT) will lead to increased radiation exposure and contrast agent use compared to angiography performed alone. However, quantifying this increase would be of considerable clinical value, as it could facilitate improved planning of subsequent therapeutic steps – particularly in patients requiring repeat procedures or those with pre-existing CKD. Moreover, evaluating the interaction between AT and other predictors of radiation exposure and contrast usage could further enhance risk stratification and management strategies. The decision to employ AT modalities after CA rests with the operator and is driven by the necessity to better elucidate the findings prior to determining the appropriate therapeutic approach. Substantial evidence supports the association between the use of AT and a reduction in major cardiovascular events [2, 11]. Nonetheless, operators bear the responsibility to mitigate radiation- and contrast-induced risks. Given that most steps in the AT process are performed under fluoroscopy without requiring high image quality, simply lowering the fluoroscopic frame rate from 15 to 7.5 fps can effectively reduce the patient’s radiation dose without affecting procedural complication rates or major adverse cardiovascular events [28]. Furthermore, a prospective study encompassing over 21,000 consecutive PCI procedures demonstrated that collaboration between operators and other subspecialties, such as nephrologists, resulted in a 28% reduction in CIN among patients with pre-existing CKD [22].
Besides limitations stemming from its retrospective and single-center design, the present study has several other constraints. Potential confounders that may have influenced DAP were not captured or adjusted for, such as patient-to-detector distance and projection angles. Furthermore, the limited number of patients who have undergone prior CABG or been diagnosed with CKD reduces the statistical power of the associated analysis and may compromise the reliability of the results. However, they were included to faithfully represent the real-world clinical environment of our catheterization laboratory. The study relies on procedures conducted by a single, experienced operator, thereby limiting its external validity. Notably, both patient exposure and contrast use may be more substantially affected by adjunctive technologies in centers staffed by less experienced operators. Lastly, ED was not directly measured or estimated through accurate Monte Carlo simulations, but rather estimated from the DAP recorded by the equipment.
Conclusions
In real-world clinical settings, the present study found that the AT group experienced significant increases in several parameters compared to the NoAT group. Specifically, DAP, patient ED, and contrast usage rose by approximately 70–73%, total irradiation time increased by 120%, and procedural time was approximately 135% longer. The whole patient group analysis revealed that the use of AT was the strongest predictor of increased DAP and contrast usage. Additionally, higher contrast usage was observed in procedures performed on patients with a history of prior CABG. In the AT group analysis, both primary outcome variables were significantly associated with gender, AT process type, number of AT procedures, and procedural time. Among these factors, male gender and elective (vs. ad-hoc) AT processes were the strongest predictors of elevated DAP and contrast usage, respectively. Furthermore, procedures performed via the RRA access route were significantly associated with reduced contrast usage. Both analyses demonstrated that, although DAP increased with higher BMI, contrast usage was not significantly associated with this index. Additionally, more contrast was required for AT examinations in males.


