
Introduction
Currently, steatotic liver disease (SLD) is the most common cause of chronic liver disease, which can progress to cirrhosis and hepatocellular carcinoma [1]. The development of metabolic dysfunction-associated steatotic liver disease (MASLD) is strongly associated with unhealthy dietary habits, making weight reduction a key therapeutic approach. Studies have demonstrated that lifestyle interventions, including dietary modifications and exercise for 3-12 months, can improve metabolic dysfunction-associated steatohepatitis (MASH) and liver fibrosis [1–3].
Our previous study found that a moderate carbohydrate diet over one year successfully normalized alanine aminotransferase (ALT) levels in more than 60% of MASLD patients. However, many patients continued to exhibit persistently high ALT levels despite dietary therapy [4]. In clinical practice, ALT normalization is a primary treatment goal for MASLD patients, yet optimizing strategies for those resistant to dietary therapy remains a challenge.
MASLD patients often present with metabolic comorbidities such as dyslipidemia, type 2 diabetes mellitus, and hypertension. While weight reduction can improve metabolic conditions, treatment-resistant cases are common. Clinical practice guidelines recommend several pharmacological therapies that have demonstrated benefits for MASH in clinical trials [1–3].
Among potential therapeutic agents, pemafibrate, a novel fibrate developed as a selective peroxisome proliferator-activated receptor α modulator, has shown promise in enhancing efficacy while minimizing the adverse effects seen with conventional fibrates [5, 6]. Approved in Japan in 2017 for hyperlipidemia treatment, pemafibrate has not yet received regulatory approval for MASLD management. However, a phase 2 trial involving MASLD patients reported significant reductions in ALT levels and liver stiffness following pemafibrate treatment [7]. Since these results were not specific to diet-resistant MASLD, its efficacy in this patient subgroup remains unclear.
The present study aimed to evaluate pemafibrate’s effectiveness in patients with diet-resistant MASLD and hyperlipidemia.
Material and methods
Patients
This was a retrospective cohort study of pemafibrate for patients with diet-resistant MASLD and hyperlipidemia. According to previous Japanese guidelines for non-alcoholic fatty liver disease, MASLD in this study was diagnosed before dietary therapy based on the following three criteria: 1) detection of steatosis by either imaging or histology; 2) exclusion of alcoholic liver disease; 3) appropriate exclusion of other liver diseases such as viral hepatitis, autoimmune liver diseases, and metabolic or hereditary liver diseases. The criterion for “nonalcoholic” was a daily alcohol intake < 20 g in women and < 30 g in men. MASH was diagnosed from a liver biopsy based on the presence of steatohepatitis [8].
Liver biopsy was offered to all patients and performed on those who provided consent, allowing for a definitive diagnosis of MASH. Matteoni classification [9], and pathological findings were evaluated using the Brunt classification [10]. The present study defined patients with diet-resistant MASLD as individuals who exhibited persistently elevated ALT despite receiving face-to-face dietary counseling by registered dietitians every 3 months for a period exceeding one year. ALT elevation was defined as > 33 IU/l in males and > 25 IU/l in females, based on the guidelines of the American College of Gastroenterology [11]. The dietary intervention employed in this study was a moderate carbohydrate diet [4]. All enrolled patients received face-to-face counseling in a moderate-carbohydrate diet by registered dietitians every 3 months. In counseling with dietitians, patients were recommended to restrict carbohydrate intake to 150-200 g/day regardless of the kind of carbohydrates. No specific counseling on additional concrete physical activity was provided, although changes to physical activity were allowed.
Inclusion criteria were as follows: 1) patients with diet-resistant MASLD and hyperlipidemia (triglycerides [TG] ≥ 150 mg/dl or low-density lipoprotein cholesterol ≥ 140 mg/dl); 2) patients who received pemafibrate at a standard dose of 0.1 mg twice daily in combination with dietary therapy. Exclusion criteria were as follows: 1) patients who were lost to follow-up; 2) patients who discontinued pemafibrate, or patients with medication adherence ≤ 80%; 3) patients who did not continue with dietary counseling or their previous medication regimen for conditions such as hypertension, diabetes, hyperlipidemia, or hyperuricemia, during the pemafibrate medication period.
Between June 2019 and July 2024, pemafibrate was administered to a total of 97 patients with diet-resistant MASLD and hyperlipidemia in our hospital. After excluding 5 patients who were lost to follow-up, and one patient with poor medication adherence, a total of 91 patients were included in the analysis. The evaluation of outcomes was performed after 6 months. The sample size for this study was determined from our patient database.
The present study was approved by the ethics committee of Wakayama Rosai Hospital (approval no. 22-10), and conformed to the Declaration of Helsinki. The requirement for written informed consent was waived, due to the retrospective nature of the investigation.
Noninvasive liver fibrosis tests
Liver stiffness was assessed using shear wave velocity generated by acoustic radiation force impulse (ARIETTA850; FUJIFILM, Tokyo, Japan). Serum levels of Mac-2-binding protein glycosylation isomer (M2BPGi) were measured as a liver fibrosis marker using a chemiluminescence enzyme immunoassay (HISCL-5000; Sysmex, Kobe, Japan).
Analyses of body composition and liver fat content
Percent body fat and skeletal muscle index (SMI) were evaluated using an InBody 720 system (InBody, Tokyo, Japan). Liver fat content and visceral fat area were also assessed using non-enhanced computed tomography (CT). CT images were obtained on a General Electric Discovery HD750 CT scanner (GE Healthcare, Waukesha, WI). Liver-to-spleen (L/S) ratio was calculated by measuring the ratio of liver density to spleen density on CT. Visceral fat area was also measured on an axial slice of the umbilical region using automatic analysis software (AZE Virtual Place Raijin; Canon, Tochigi, Japan). After December 2019, percent liver fat was also measured using magnetic resonance imaging-proton density fat fraction (MRI-PDFF) (Ingenia 3.0T; Philips Japan, Tokyo, Japan).
Primary endpoint
The primary endpoint was defined as the ALT response, measured at 6 months after the start of pemafibrate therapy. Complete response (CR) was defined as ALT normalization (≤ 33 IU/l in males, ≤ 25 IU/l in females), in accordance with the guidelines of the American College of Gastroenterology [11]. Partial response (PR) was defined as a ≥ 30% reduction in ALT level from baseline, without achieving CR [12]. The response rate was defined as the proportion of patients achieving CR or PR. No response (NR) was defined as the absence of achievement of CR or PR.
Secondary endpoints
Secondary endpoints included: 1) changes in levels of liver enzymes such as aspartate aminotransferase (AST), ALT, alkaline phosphatase (ALP), and γ-glutamyl transpeptidase (γ-GT); 2) changes in liver fibrosis tests using shear wave velocity and serum M2BPGi level; 3) changes in lipid metabolism using TG, total cholesterol (TC), high-density lipoprotein cholesterol (HDL-C), and low-density lipoprotein cholesterol (LDL-C); 4) changes in glucose metabolism using fasting plasma glucose, insulin, hemoglobin A1c (HbA1c), and homeostasis model assessment for insulin resistance (HOMA-IR); and 5) changes in body weight, percent body fat, and visceral fat area, and liver steatosis.
Statistical analysis
Data are presented as mean ± standard deviation, median and range, interquartile range, or number and percentage. The significance of post-treatment changes was assessed using the Wilcoxon signed-rank test. Spearman’s correlation coefficient test was employed to examine the relationship between body weight change and ALT change. Factors contributing to NR were analyzed using logistic regression modeling with the stepwise method. A p-value of < 0.05 was considered statistically significant. All data analyses were performed using SPSS for Windows, version 24J (SPSS, Tokyo, Japan).
Results
Patient characteristics
Baseline characteristics of patients are summarized in Table 1.
Table 1
Baseline characteristics of patients
ALT response
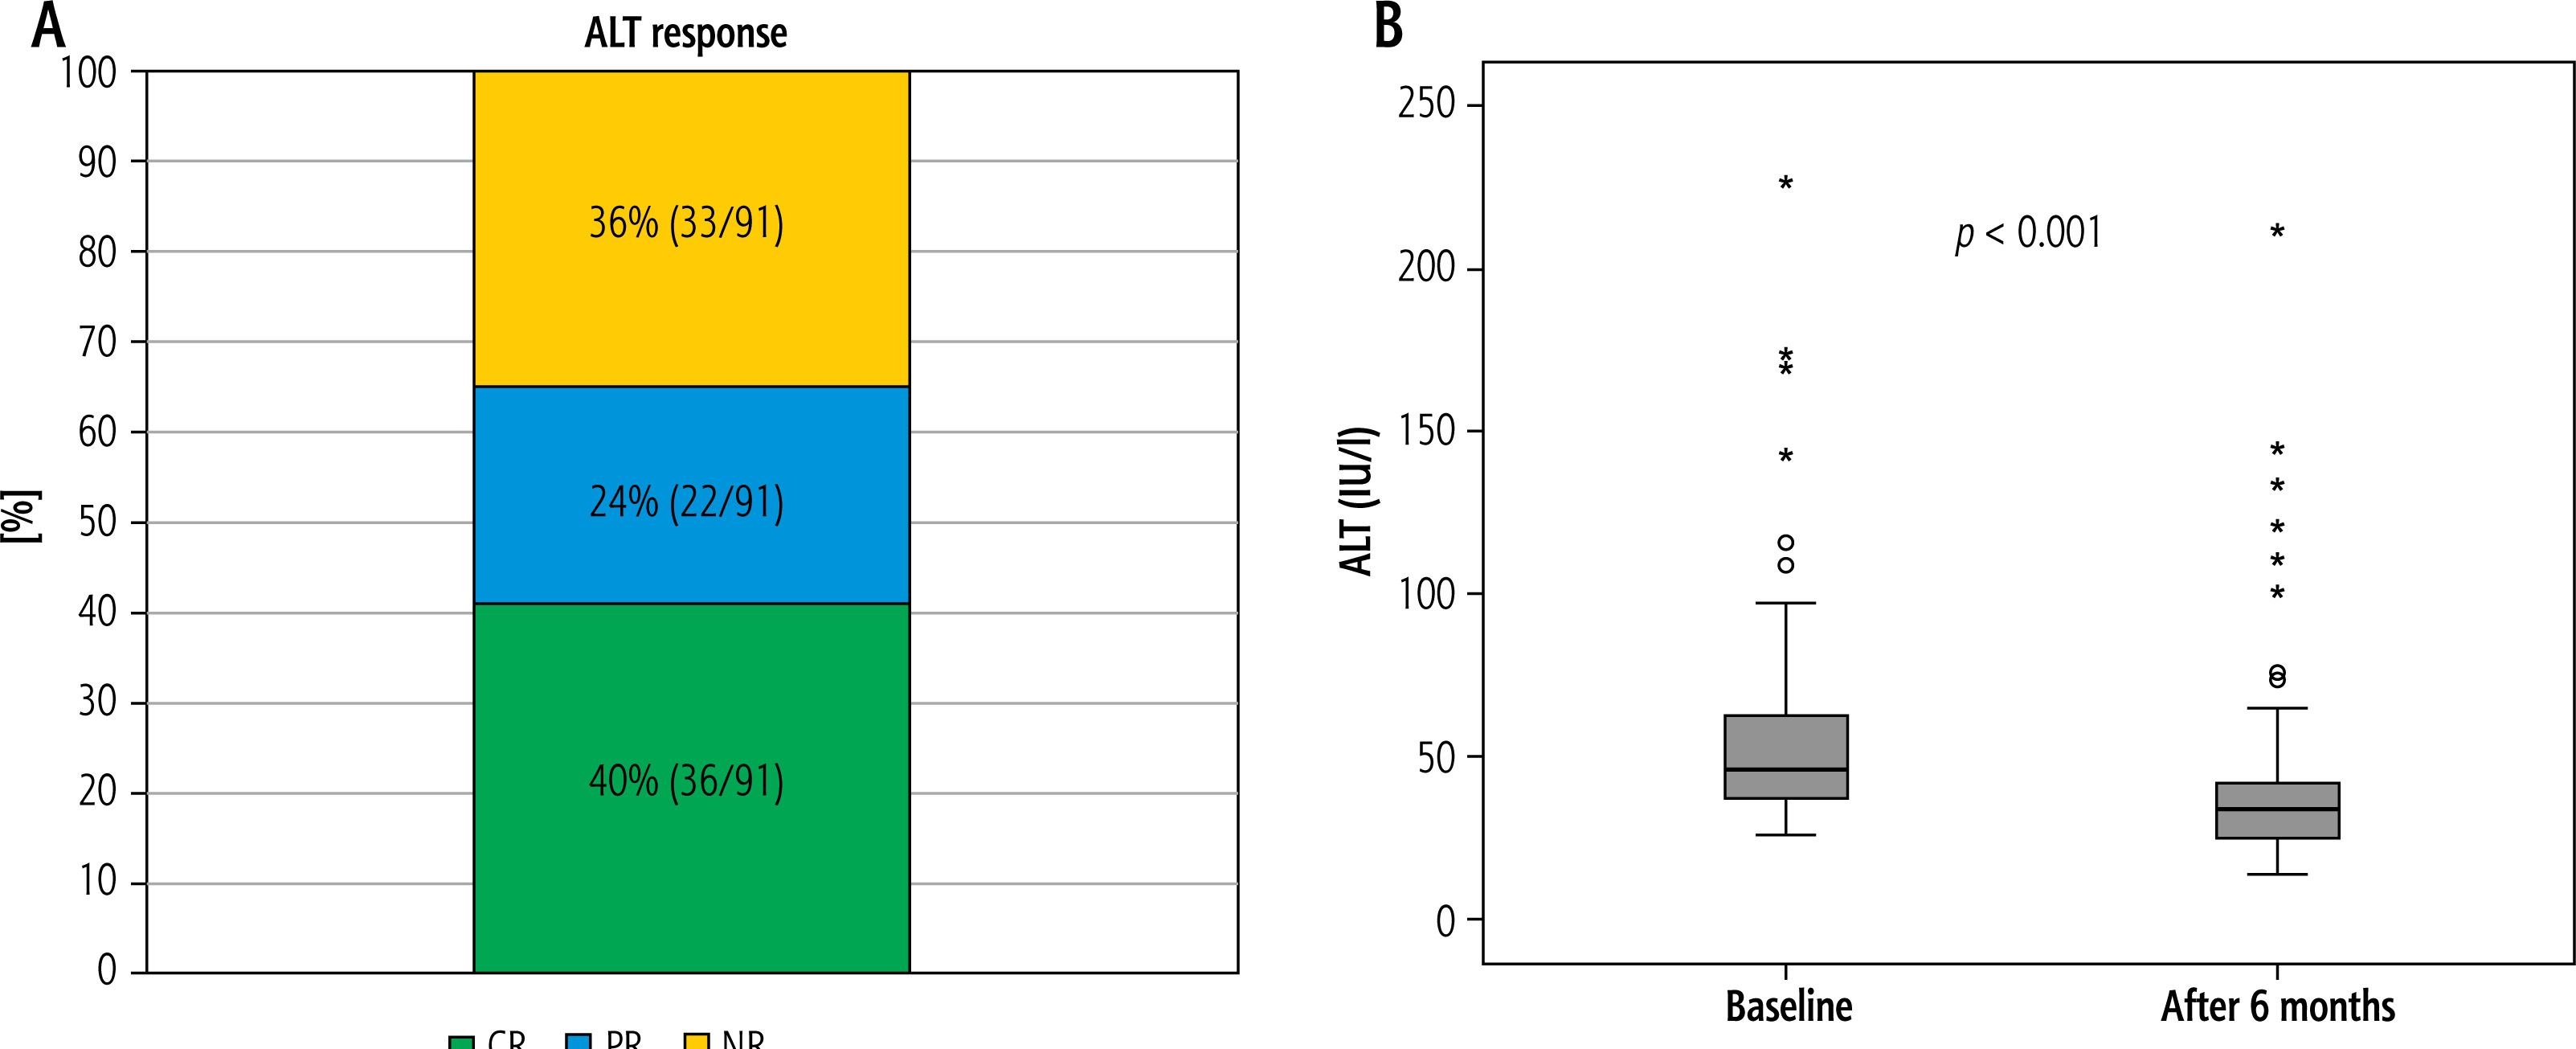
Complete response, PR, and NR rates were 40% (36/91), 24% (22/91), and 36% (33/91), respectively. The response rate (CR + PR) was 64%. Results for ALT response and changes in ALT level are shown using box-and-whisker plots in Figure 1.
Fig. 1
A) Results of alanine aminotransferase (ALT) response at 6 months. Complete response (CR), partial response (PR), and no response (NR) rates are 40% (36/91), 24% (22/91), and 36% (33/91), respectively. The response rate (CR + PR) is 64%. B) Changes in ALT at 6 months. Changes in alanine aminotransferase (ALT) level are shown using box-and-whisker plots. ALT levels are significantly reduced at 6 months (p < 0.001)
Changes in liver enzymes, liver stiffness, and fibrosis markers
Changes in liver enzymes, liver stiffness, and fibrosis markers are summarized in Table 2. ALT level was significantly reduced at 6 months (p < 0.001). Levels of other liver enzymes such as AST, ALP, and γ-GT were also significantly reduced. Although no significant change was seen in shear wave velocity, M2BPGi was significantly reduced at 6 months compared to baseline (p < 0.001).
Table 2
Changes in several parameters
[i] Values are expressed as mean ± standard deviation, median (range) [interquartile range] or number.
[ii] AST – aspartate aminotransferase, ALT – alanine aminotransferase, ALP – alkaline phosphatase, γ-GT – γ-glutamyl transferase, M2BPGi – Mac-2-binding protein glycosylated isomer, COI – cut-off index, HDL – high-density lipoprotein, LDL – low-density lipoprotein, HOMA-IR – homeostatic model assessment for insulin resistance, HbA1c – hemoglobin A1c, L/S – liver-to-spleen, MRI-PDFF – magnetic resonance imaging proton density fat fraction
Changes in lipid and glucose metabolism
Changes in lipid and glucose metabolism data are also shown in Table 2. Levels of TG, LDL-C, insulin, and HOMA-IR were significantly reduced compared to baseline.
Changes in body weight, body fat, visceral fat, and steatosis
Changes in body weight, body fat, visceral fat and steatosis are also summarized in Table 2. No significant changes were seen in body weight, percent body fat, and visceral fat area at 6 months compared to baseline. Although the L/S attenuation ratio on CT was significantly reduced, no significant change in MRI-PDFF was identified.
Correlation between body weight change and ALT change
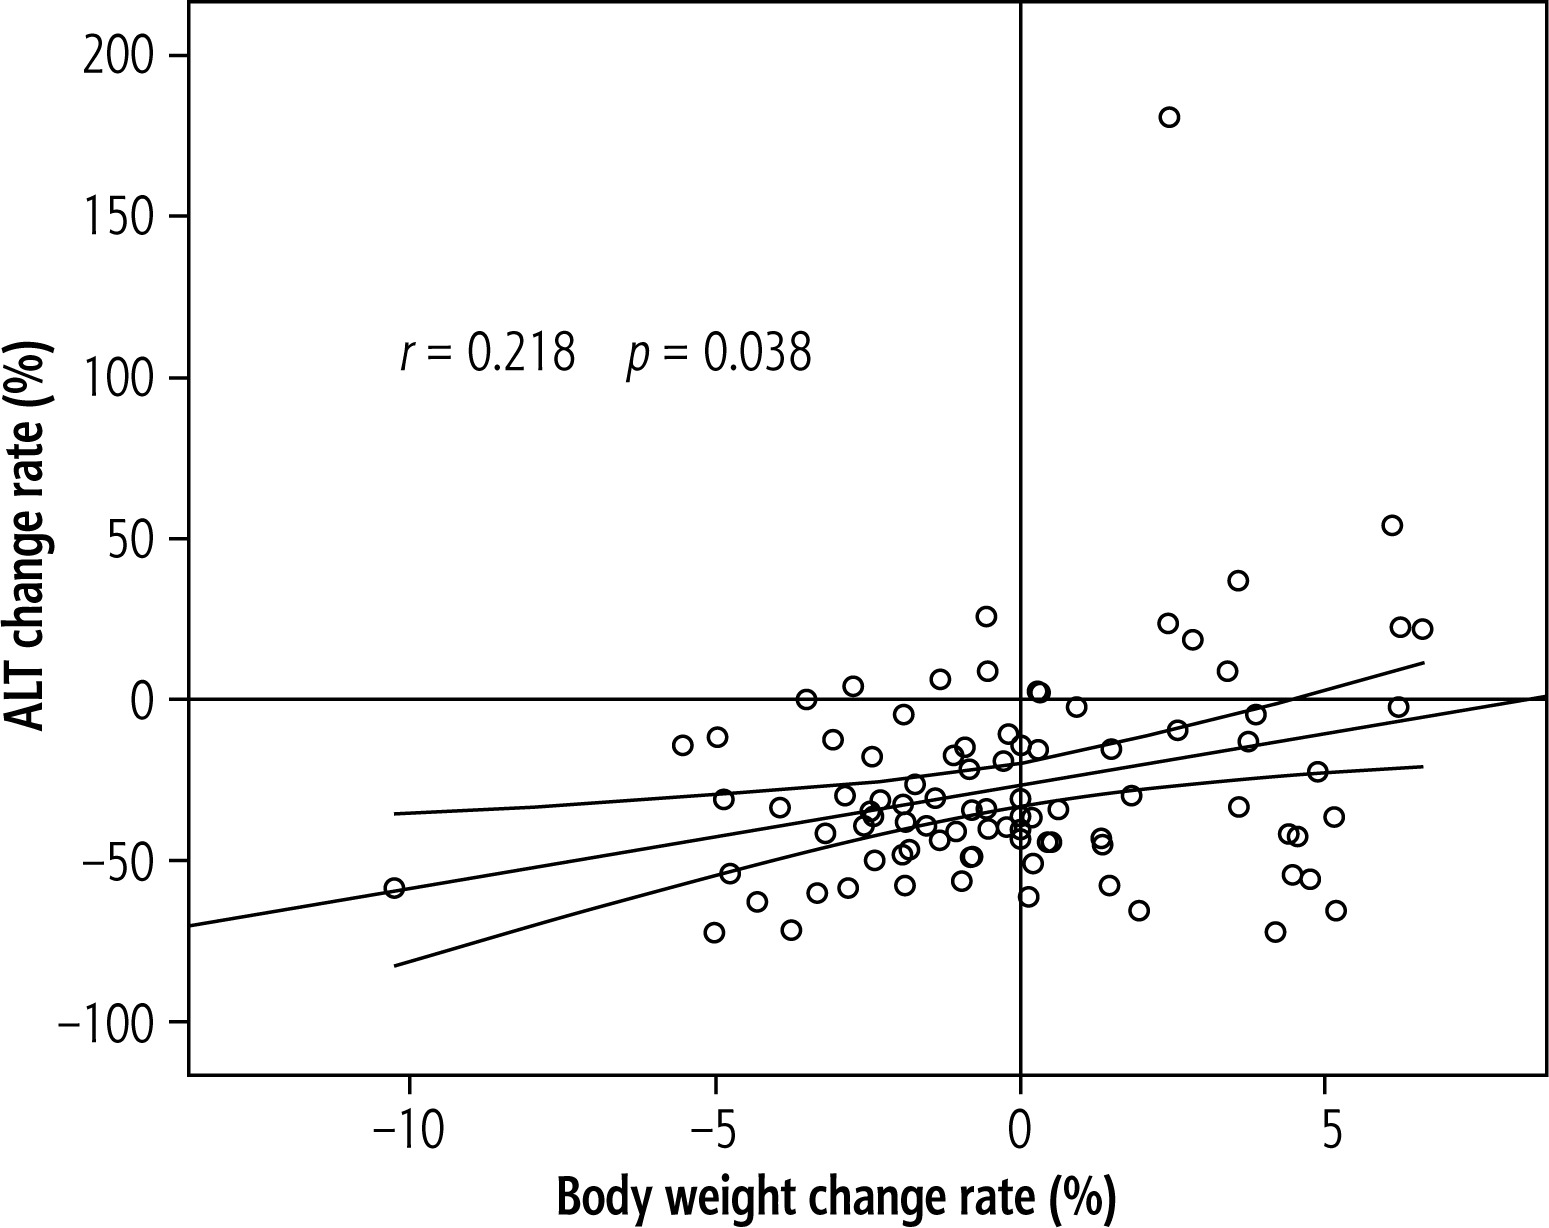
The correlation between body weight change rate and ALT change rate at 6 months is shown in Figure 2. A weak but significant correlation was found between body weight change rate and ALT change rate (p = 0.038, r = 0.218).
Factors contributing to NR
Factors contributing to NR are summarized in Table 3. On univariate analysis, body weight, body mass index (BMI), percent body fat, visceral fat area, and SMI were identified as factors significantly associated with NR. However, no factors were independently associated with NR on multivariate analysis.
Table 3
Factors contributing to no response
[i] OR – odds ratio, CI – confidence interval, L/S – liver-to-spleen, AST – aspartate aminotransferase, ALT – alanine aminotransferase, ALP – alkaline phosphatase, γ-GT – γ-glutamyl transferase, HDL – high-density lipoprotein, LDL-C – low-density lipoprotein, HOMA-IR – homeostatic model assessment for insulin resistance, HbA1c – hemoglobin A1c, M2BPGi – Mac-2-binding protein glycosylated isomer, COI – cut-off index
Discussion
This study is the first to evaluate the efficacy of pemafibrate in patients with MASLD who are resistant to dietary therapy. Several reports have already demonstrated its effectiveness in non-diet resistant MAFLD patients treated with pemafibrate as a first-line therapy [7, 13–27]. However, only a few of these studies have reported the ALT normalization rate. A retrospective cohort study by Yamada-Shimizu et al. reported that the ALT normalization rates at 3, 6, and 12 months were 40%, 55%, and 60%, respectively [27]. Sugimoto et al. found that the percentage of patients with normal ALT levels increased from 7% to 33% after 24 weeks of pemafibrate therapy [21]. In a phase 2 study of pemafibrate in patients with MASLD, the ALT normalization rates at 24, 48, and 72 weeks were 57.9%, 61.8%, and 62.3% in the pemafibrate group, and 30.5%, 33.9%. and 27.1% in the placebo group, respectively [7]. In the present study, CR (the ALT normalization rate) was achieved in 40% of diet-resistant patients after 6 months of pemafibrate therapy, and the total response rate was high, at 64%. Levels of other liver enzymes were also significantly reduced by pemafibrate therapy. Pemafibrate can thus be expected to have some benefit in patients with diet-resistant MASLD, as well as in patients treated with pemafibrate as primary treatment.
Regarding changes in liver stiffness and fibrosis, although M2BPGi levels were significantly reduced in the present study, no significant reductions in liver stiffness using shear wave velocity were evident after 24 weeks of pemafibrate therapy. In a retrospective study, Kikuchi et al. reported that although values from liver stiffness prediction formulae, such as the fibrosis-4 index and aspartate aminotransferase-to-platelet ratio index, were significantly reduced at 6 months, no significant reduction in liver stiffness measurement (LSM) by vibration-controlled transient elastography was observed [26]. Morishita et al. likewise found no significant reduction in LSM despite a significant reduction in autotaxin levels [24]. A prospective study by Ono et al. revealed a significant reduction in M2BPGi at 48 weeks, but no significant change in LSM [23]. A phase 2 randomized controlled trial of pemafibrate in MASLD patients also showed a significant reduction in M2BPGi at 24 weeks without any significant reduction in liver stiffness on magnetic resonance elastography [7]. On the other hand, a retrospective study by Sugimoto et al. showed that liver shear wave velocity was significantly reduced for at least 24 weeks. However, that reduction in shear wave velocity correlated strongly with reductions in body weight and ALT [21]. Fibrosis markers such as M2BPGi and autotaxin have been used as biomarkers to assess the degree of liver fibrosis and as indicators of hepatitis activity [28, 29]. In view of these reports, pemafibrate can be considered effective in reducing hepatitis, but appears to have little effect on liver fibrosis in the short term.
Regarding changes in liver steatosis, Kikuchi et al. noted significant reductions in the hepatic steatosis index and the controlled attenuation parameter (CAP) level, which reflect lipid accumulation in the liver, after 6 months of pemafibrate treatment [26]. In contrast, Morishita et al. and Ono et al. reported no significant improvements in CAP levels even after 48 weeks [23, 24]. A phase 2 trial also showed no significant improvement in MRI-PDFF levels even after 72 weeks [7]. In the present study, the L/S ratio was significantly reduced and no significant change in PDFF levels was observed after 24 weeks. Pemafibrate seems likely to have no beneficial effect on hepatic steatosis.
In terms of factors contributing to the efficacy of ALT reduction with pemafibrate therapy, Iwadare et al. reported that non-responders were more likely to be male and to have lower ALT levels, a lower percent body fat, and a higher percent skeletal muscle than responders [30]. On the other hand, high body weight, high BMI, high percent body fat, high visceral fat area, and high SMI were factors significantly associated with NR in the present study. The reasons for this discrepancy in the results are not known. However, Shinozaki et al. indicated that patients with lean MASLD have a greater response to pemafibrate therapy compared to those with obese MASLD [19]. Furthermore, they investigated pemafibrate dose escalation from 0.2 mg to 0.4 mg daily in MASLD patients who were refractory to standard-dose therapy [31]. Their findings suggest that dose escalation may have the potential to improve liver inflammation. Therefore, pemafibrate dose escalation may be beneficial for patients with high body weight and BMI. Further studies are needed to clarify the characteristics of non-responders.
The present study showed some limitations that need to be kept in mind when interpreting the results. First, this study retrospectively analyzed data from a small, single-center cohort with some inherent biases such as selection bias, information bias and confounding. Second, this study did not include a control group. Further multicenter randomized controlled trials in diet-resistant MASLD patients are needed to confirm its efficacy and clarify its role in MASLD management. Third, although patients with autoimmune chronic liver diseases, such as autoimmune hepatitis and primary biliary cholangitis, were excluded before initiating dietary therapy in this study, it remains clinically difficult to fully distinguish MASH and autoimmune liver disease. Consequently, some MASLD patients with autoantibody negative autoimmune liver disease may be included among diet-resistant MASLD patients. Since pemafibrate is also effective in treating cholestatic liver diseases such as primary biliary cholangitis [32, 33], this represents a limitation that should be considered when interpreting the results of this study. Fourth, the moderate carbohydrate diet we reported has not yet been established as a standard treatment for MASLD [4]. However, Suzuki et al. reported the effectiveness of combining pemafibrate with a mild low-carbohydrate diet in both obese and non-obese MASLD patients [34]. Pemafibrate may provide additional benefits when combined with a moderate carbohydrate diet. Fifth, although no significant change in body weight was observed, a weak correlation was evident between weight loss and ALT reduction. ALT responses may thus have been overestimated. Further studies are needed to assess the true effects of pemafibrate in a larger number of patients, excluding those with weight loss. Sixth, pemafibrate improved liver function tests, but whether this effect leads to improvements in liver fibrosis is still unclear. Future studies should evaluate long-term outcomes. Seventh, the efficacy of pemafibrate in patients with diet-resistant MASLD without hyperlipidemia could not be assessed in this study. Whether pemafibrate is effective in diet-resistant MASLD patients without hyperlipidemia needs to be determined in the future.
In conclusion, pemafibrate appears effective in the treatment of both liver dysfunction and hyperlipidemia in MASLD patients resistant to dietary intervention. These findings suggest that pemafibrate may be a potential second-line therapeutic option for diet-resistant MASLD patients with hyperlipidemia.


