
Introduction
Children and adolescents with type 1 diabetes (T1D) have to independently ensure appropriate diabetes management, which requires careful interaction between insulin administration and carbohydrate intake [1–3]. This includes, among others, the interpretation of both continuous glucose monitoring (CGM)-derived glucose values and trend arrows so that the insulin dose can be adjusted to individual life situations, such as food intake or physical activity [4, 5]. Of note, physical activity is exceedingly complex and can lead to increased risk of hypoglycaemia and loss of glycaemic control [6], often discouraging children and adolescents as well as their caregivers from engaging in regular exercise [7–9]. On the other hand, regular physical activity and exercise are recommended at an early age to improve metabolic, cardiovascular, and mental health and to promote adequate development [1, 10–12]. This presents young people with T1D and their caregivers with a multitude of concerns because specific as well as individualised and regular adjustments of diabetes therapy are required [7, 11].
These days, one integral part of diabetes management is real-time continuous glucose monitoring (rtCGM) [13]. Regular CGM use enables an increased quantity of readings per day [14] and is associated with improved glycaemia by means of improved HbA1c levels, increased time in range (TIR, 70–180 mg/dl), reduced time below (< 70 mg/dl) and above range (> 180 mg/dl), and lower glycaemic variability [13, 15–19]. However, data on CGM performance in children and adolescents, especially during exercise, is still scarce. It is therefore of great interest to collect further data quantifying rtCGM sensor performance for paediatric individuals during exercise. Reviewing current studies, the mean absolute relative difference (MARD) of CGMs compared to venous/capillary glucose under different physiological or experimental conditions is comparable for the widest range of new-generation systems and lies between 10% and 20% overall [20–24]. However, periods of high rates of change in glucose are a particular limitation for the performance of CGM systems because the diffusion of glucose from the bloodstream to the interstitial fluid, where the CGM sensor is detecting glucose, results in a physiological lag time of 3–12 minutes [25–27]. Consequently, as shown in multiple studies, the use of CGM systems around exercise decrease sensor performance to a certain extent [23, 24, 27, 28]. Furthermore, sensor accuracy performs worse during hypoglycaemia than in hyperglycaemia. Therefore, the often increased rates of hypoglycaemia during and after physical workouts pose another additional challenge [23, 29].
Based on the results of these previous CGM performance studies, Eichenlaub et al. [30] published guidelines for comparator data characteristics and testing procedures for the clinical performance evaluation of CGM systems. These guidelines propose characteristics of the comparator measurements collected during CGM performance studies that include the blood glucose (BG) concentrations and their rate of change (RoC).
Aim of the study
This investigation aimed to determine the sensor accuracy of the Dexcom G6 rtCGM-system (Dexcom Inc., San Diego, CA) around the acute glycaemic challenges of the exercise sessions of a 4-week intensive track and field training, combining a variety of stimuli as well as exercise types and variable intensities, in adolescents with T1D. Additionally, this study considers the validity of the results based on the guidelines for CGM performance assessment.
Material and methods
This study is an analysis of a prespecified secondary outcome of the ChilDFiT1 study [31]. The trial was registered at the German Clinical Trials Register (DRKS00027954). The study was conducted in conformity with the declaration of Helsinki and Good Clinical Practice. Before any trial-related activities, potential participants and respective legal guardians were informed about the study protocol and gave their written informed consent to participate in this trial. This sub-study included 4 participants from the study conducted by the University of Bayreuth and 4 participants from the Medical University of Graz who were allocated to the exercise group according to the randomisation.
Eligibility criteria
Eligibility criteria included male or female individuals aged 10–17 years (both inclusive) with a body mass index (BMI) within the 10th (P10) to 90th (P90) percentile of the respective sex and age of children in Germany (Bayreuth) and Austria (Graz). Participants with a diagnosis of T1D for at least one year (HbA1c < 12% at screening) and with an insulin therapy established either with insulin pen therapy (multiple daily injections) or continuous subcutaneous insulin infusion (pump therapy) were included. All adolescents had avoided recurrent severe hypoglycaemia (defined as >1 severe hypoglycaemic event during the previous 12 months), and demonstrated normal hypoglycaemia awareness (Gold score ≤ 2) [32, 33]. Significant abnormal ECG, heart rate, or blood pressure at screening or any contraindicative medication were reasons for non-qualifying to participate in the study. Further exclusion criteria were as follows: the presence or history of a clinically severe disease that could jeopardise the participant’s safety or directly influence the study results, clinically relevant hypoglycaemia or diabetic ketoacidosis requiring third-party help during the last 6 months, and any other condition that would interfere with trial participation or evaluation of results as judged by the investigator.
Study design
This is a sub-study of the ChilDFiT1 trial [31]. The ChilDFiT1 study included 10 adolescents with T1D, who received medically supported intensive glycaemic management only (3 times per week for 4 weeks), and 8 participants who additionally performed track and field training 3 times per week for 4 weeks.
At the screening visit, participants and their respective legal guardians were instructed on all study-related procedures. At the pre- and post-intervention laboratory visits, the medical and therapy history were queried. Anthropometric parameters of the participants were assessed via bioelectrical impedance analysis (Inbody 720, Inbody Co., Seoul, Korea; BIACORPUS RX 4004M, MEDI CAL HealthCare GmbH, Karlsruhe, Germany) for body composition and via manual measurement (mobile stadiometer) for body height. Additionally, a venous blood sample from the antecubital vein was obtained. At the screening, a 12-lead ECG (CardioPart 12, Amedtec, Aue-Bad Schlema, Germany) was recorded and a cardiac assessment (blood pressure, heart rate) was performed for safety reasons.
The 4-week track and field intervention phase began the week after the pre-intervention laboratory visit. All participants continuously wore a Dexcom G6 rtCGM and received online or on-site consultations with the study diabetologist 3 times per week. Track and field training was performed every Monday, Wednesday, and Friday afternoon (60 min activity per session) over 4 weeks). Sensor glucose and rates of change (trend arrows) were constantly monitored by rtCGM (Dexcom G6) and documented before, every 15 min during the training session, and 5 min post-exercise. At these depicted time points, simultaneously, BG sampling from the earlobe (BIOSENS S-Line Lab+, EKF-diagnostic GmbH, Barleben, Germany) was performed.
For the exercise sessions, it was anticipated that in concordance with current guidelines for exercise management in T1D [34], the start of exercise is possible if the sensor glucose is between 90 and 270 mg/dl. In the case of lower values, an individual amount of carbohydrates was given orally, documented, and glucose was rechecked. If the sensor glucose exceeded 90 mg/dl, the exercise session was initiated. In case of initial BG exceeding 270 mg/dl, blood ketones were determined, and insulin correction was applied considering potential bolus insulin still onboard. If blood ketones exceeded 1.5 mmol/l, the exercise session was cancelled for this day [34]. The exercise program mirrored a children's track and field intervention and was based on the framework for the competition program “Kinderleichtathletik”, developed and implemented by the DLV (German Athletics Association) [35]. Participation in ≥ 75% of the exercise visits were required not to be excluded from the main ChilDFiT1 study (at least 9 of 12 exercise visits had to be performed). In the week after the last exercise session, the post-intervention laboratory visit was performed.
Statistical analysis
Data were collected and summarised in a trial Masterfile in Microsoft Excel version 16.0 (Microsoft Corporation, Redmond, USA) and analysed via Prism software version 8.0 (GraphPad, La Jolla, CA, USA).
Data were tested for normal distribution via Shapiro-Wilk normality test. Descriptive statistics are given as mean ± standard deviation (SD). RtCGM sensor performance was evaluated by comparison of sensor glucose against capillary BG for the same time point by median absolute relative difference (MedARD) analysis (interquartile range) and Bland-Altman method (bias and 95% limits of agreement) for overall glucose values immediately before, during, and after exercise and stratified for glycaemic ranges (hypoglycaemia: < 70 mg/dl, euglycaemia: 70–180 mg/dl, hyperglycaemia: > 180 mg/dl). MedARD for BG ranges, time points, and RoC was tested for significant differences through a linear regression model with patient ID as a fixed offset effect, a Mann-Whitney U test, and a Clarke’s error grid. Statistical significance was accepted at p < 0.05 (2-tailed). Comparator data distribution was analysed as proposed by the guidelines for clinical performance evaluation of CGM systems by Eichenlaub et al. [30].
Results
In the main ChilDFiT1 study, 10 participants were randomly allocated to the control group (no exercise), while 8 participants were allocated to the intervention group (exercise). A ninth intervention group participant had to be withdrawn from the analysis due to an insufficient amount of training visits. Therefore, all 8 adolescents (2 females) with T1D from the exercise group were included in this sub-study (age 15.5 ±1.0 years, T1D duration 5.8 ±3.8 years, HbA1c 53.0 ±6.6 mmol/mol [7.0 ±0.6%], BMI 21.0 ±2.3 kg/m2, BMI Z-score 0.20 ±0.65, BMI percentile 57.0 ±23.3 [36]). Four participants followed an MDI therapy, and 4 participants were on pump therapy. All participants wore the Dexcom G6 rtCGM on the upper arm.
Median absolute relative difference
Overall, 443 glucose data pairs (CGM and BG) were available (pre-exercise: 82, during exercise: 315, post-exercise: 46).
The overall median absolute relative difference (MedARD) for time in range (TIR, 70–180 mg/dl), time below range (TBR, < 70 mg/dl), and time above range (TAR, > 180 mg/dl) as well as pre-exercise (Pre-Ex), during exercise (In-Ex), and post-exercise (Post-Ex) are given in Table I. The total In-Ex MedARD was 19.4% [12.3–27.8], further detailing an In-Ex MedARD for TIR of 19.1% [12.1–27.2], for a TBR of 28.7% [18.7–35.4] and TAR of 17.4% [11.9–20.5], respectively. The MedARD [IQR] per participant beforte, during, and after the exercise sessions can be found in Figure 1, and the overall MedARD, ranges, Q1, Q3, and IQR for the individual participants in Table II. There were no significant differences between MedARDs for different BG ranges or between Pre-Ex, In-Ex, and Post-Ex. The overall MedARD for different RoCs (> ±2 mg/dl/min [> ±0.11 mmol/l/min], ±1–2 mg/dl/min [±0.06–0.11 mmol/l/min] and < ±1 mg/dl/min [< ±0.06 mmol/l/min]) are given in Table III. There were no significant differences between MedARDs for different RoCs.
Figure 1
Median absolute relative difference [interquartile range] per participant before (t0), during (t1t4), and after (t5) the exercise session
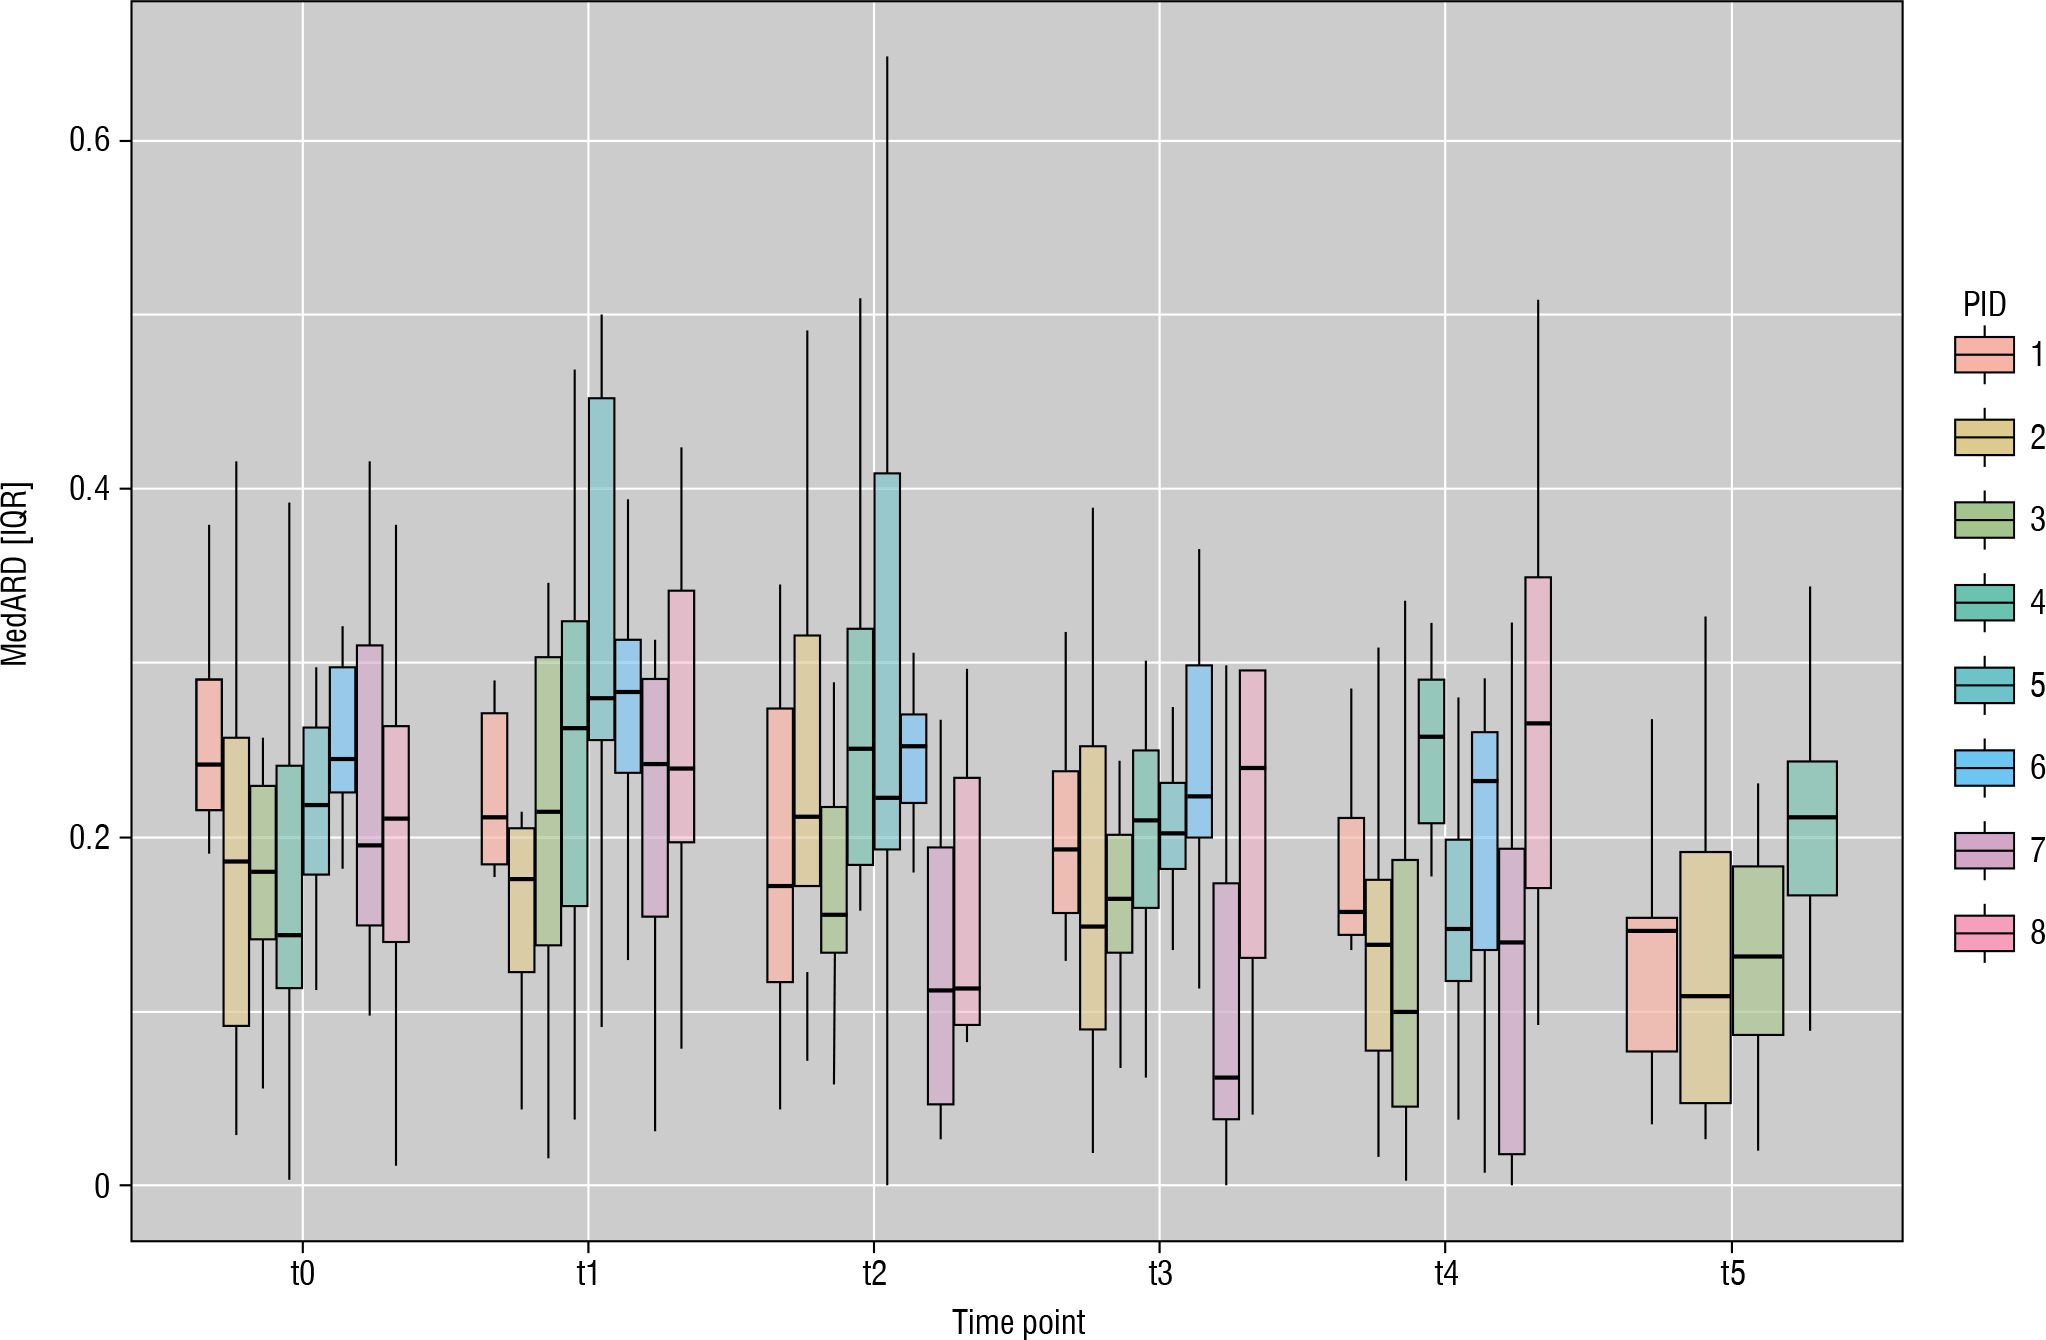
Table I
Median absolute relative difference (MedARD) and interquartile range (IQR) between interstitial glucose (rtCGM) and reference BG around exercise. Overall summarises Pre-Ex, In-Ex, and Post-Ex values
Table II
Median absolute relative difference (MedARD), range, Q1, Q3, and interquartile range (IQR) between interstitial glucose (rtCGM) and reference BG for the individual participants around exercise
Table III
Median absolute relative difference (MedARD) and interquartile range (IQR) between interstitial glucose (rtCGM) and reference BG for different rates of change around exercise. Overall summarises Pre-, In-, and Post-Ex values
* n - number of points of comparison **Median absolute relative difference is expressed as a percentage. Median absolute relative difference indicates absolute values of difference and thus ignores the direction of the measurement error but indicates the size of the error expressed as percentage error ***The RoCs were derived from the trend arrows displayed by the rtCGM sensor at each measurement point, reflecting the RoC participants responded to
Bland-Altman analysis
The Bland-Altman method derived bias ±SD of bias and 95% levels of agreement for absolute values of glucose (rtCGM to BG) were found to be 28.0 ±25.4 (–21.8, 77.9) mg/dl for TIR, 25.0 ±19.2 (–12.5, 62.6) mg/dl for TBR, and 38.1 ±25.3 (–11.4, 87.7) mg/dl for TAR.
The bias amounted to 32.4 ±24.2 (–15.0, 79.7) mg/dl for Pre-Ex, 28.7 ±25.7 (–21.7, 79.0) mg/dl for In-Ex, and 21.6 ±20.3 (–18.2, 61.4) mg/dl for Post-Ex. The respective Bland-Altman plots are presented in Figure 2A–F.
Figure 2
Bland-Altman plots comparing reference glucose and rtCGM values for time in (A), below (B), and above (C) the target range, as well as before (D), during (E), and after (F) exercise and (G) overall
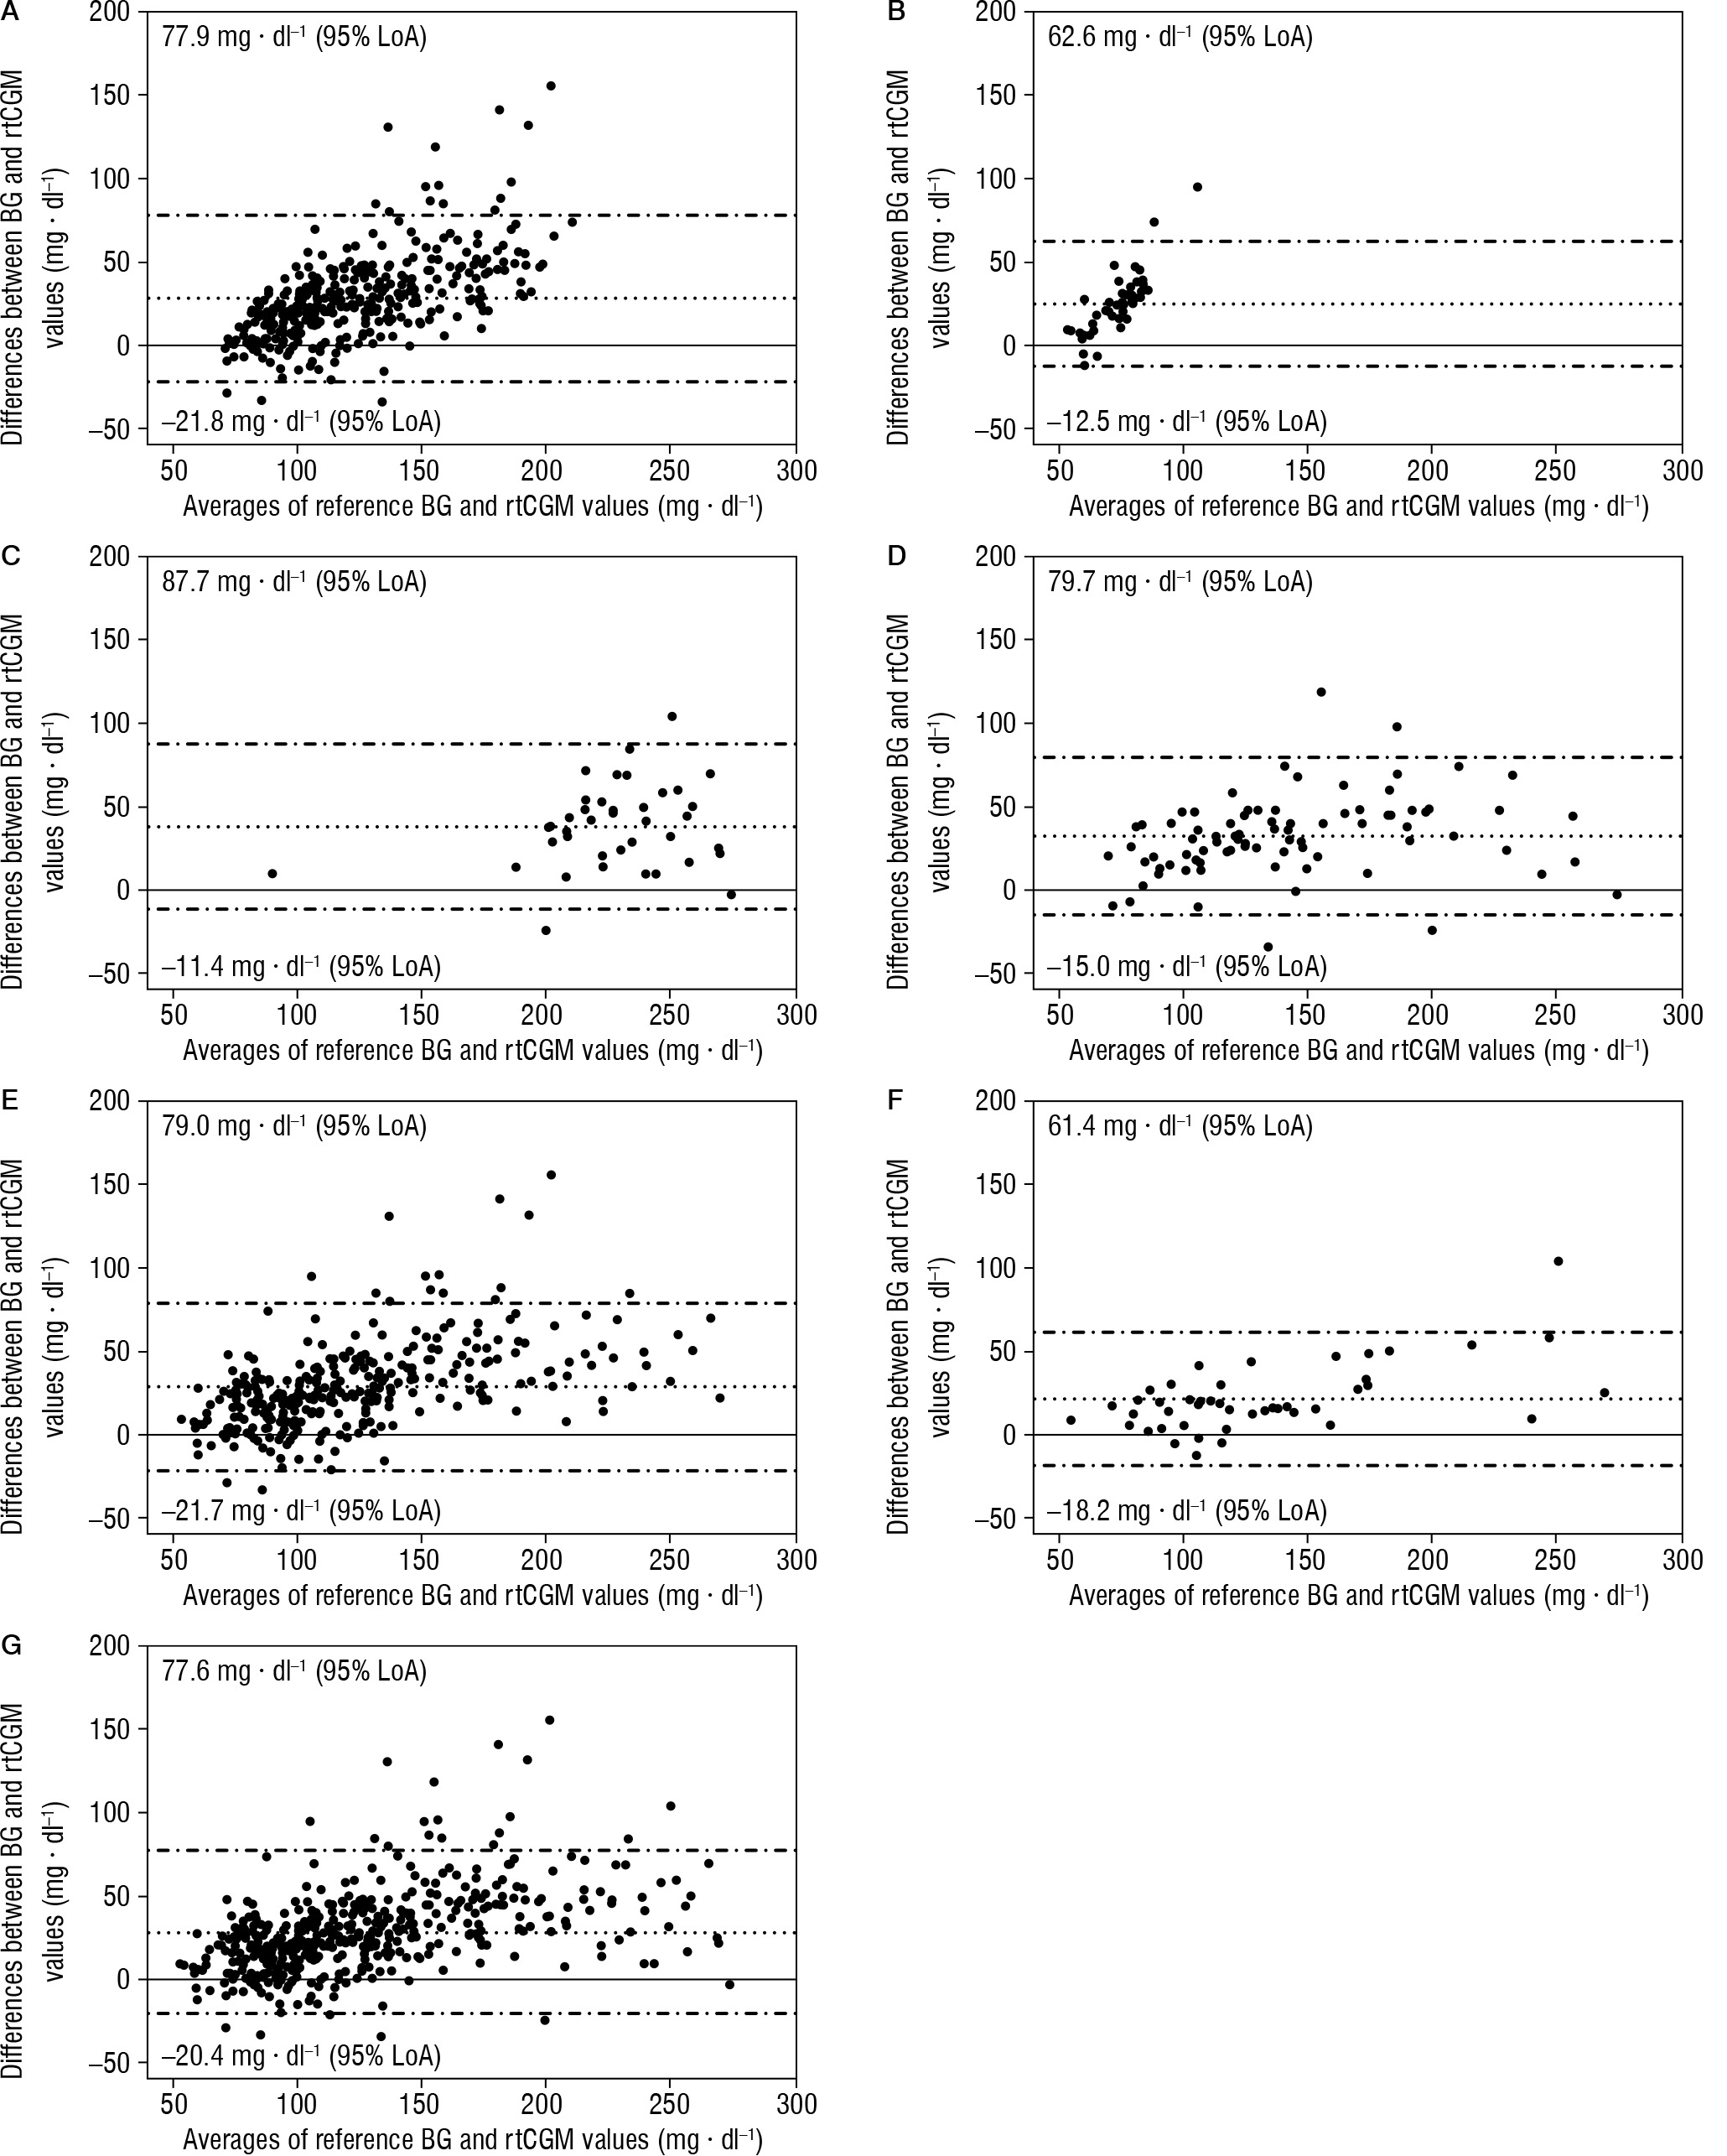
The overall bias was found to be 28.6 ±25.0 (–20.4, 77.6) mg/dl (Fig. 2G). Overall, the results in every scenario show a positive bias, indicating an overestimation of BG values by the rtCGM on average.
Comparator data distribution
Table IV shows the definitions of the glucose regions and recommended percentages of RoC-BG data points in each region as proposed by the guidelines for clinical performance evaluation of CGM systems by Eichenlaub et al. [30]. Additionally, Table IV shows the percentage of the present study’s CGM values that fell within these regions, and whether or not the guidelines were met.
Table IV
BG-RoC region recommendations for the comparator data distribution [30] and comparison to the percentages achieved by the ChilDFiT1 study
Discussion
This secondary analysis of the ChilDFiT1 study showed that the accuracy of glucose values measured using the Dexcom G6 rtCGM system was lower compared to capillary glucose testing during track and field exercise. With an overall MedARD [IQR] of 19.1% [12.2–27.3], and an clinically relevant in-exercise hypoglycaemia of 28.7% [18.7–35.4], the results clearly showed that trend arrows should be used as a supporting tool during exercise to maintain euglycaemia. When in doubt, additional capillary blood assessment should be performed to ensure glycaemic safety during exercise.
In addition, an overestimation of rtCGM values in comparison to BG reference values was demonstrated by Bland-Altman analysis, which might mask hypoglycaemia and therefore increase the risk of wrong therapeutic decisions during exercise.
In the following, MedARD (Median absolute relative difference) is compared with MARD (Mean absolute relative difference). MedARD is used in the present study due to non-normal data distribution (Shapiro-Wilk test) and a relatively small sample size (443 glucose data pairs). In this dataset, MedARD offers greater robustness to outliers, better reflecting central tendency and improving interpretability. However, for normally distributed data with larger sample sizes, MARD is preferred for its higher sensitivity to changes.
For children aged 2 to 17 years, the manufacturer Dexcom Inc. reports an overall MARD of approximately 9.3% for the Dexcom G6, which is notably lower than the 19.1% MedARD observed in the present study. However, these values were generated in clinical studies conducted by the manufacturer and were not specifically assessed during exercise, which may account for the discrepancies in other independent studies. In turn, this argument raises the question of why Pre-Ex MedARD values of the present study are worse compared to everyday conditions reported in the literature. Before exercising, physiological stress and adrenaline can cause temporary fluctuations in BG levels. Additionally, pre-exercise strategies such as insulin adjustments and snacks, along with increased physical activity from arriving at the session, can also lead to rapid BG changes, further worsening the MedARD.
For the Dexcom G6 in children and adolescents, Welsh et al. [37] reported an even lower overall MARD throughout the day with 7.7%. This is probably because the clinical trial was also not conducted specifically targeting exercise. Although CGM performance was more accurate than in the ChilDFiT1 study, the following tendencies could be observed: First, performance in hypoglycaemia was reported to be the weakest with a MARD of 13.3%. Second, rapidly falling glucose levels (< –2 mg/[dl•min]) had a worse MARD (11.9%) than all other CGM rate changes, which varied between 7.3% and 7.8% MARD. Rapidly decreasing glucose values thus seem to be more difficult to detect correctly even in a clinical setting.
These tendencies are supported by the study of Nagl et al. [38], conducted in a quasi-real-life setting of a diabetes summer camp for children and adolescents, where overall MARDs of 10.3% for the Dexcom G6 were recorded, which were also significantly higher at 18.7% for hypoglycaemia. While the present study found that the In-Ex MedARD during hypoglycaemia was not significantly worse than in other BG ranges, the clinically relevant MedARD of 28% in this range nonetheless underlines these observations.
The trends observed in the independent studies as well as the clinically relevant result of the present study are directly linked to the reason for the low MedARD values of the rtCGM sensor during track and field. During exercise, people with T1D tend to spend more time in hypoglycaemia, and glycaemic management suffers from high fluctuation rates and rapidly falling BG levels. This is particularly true for children and adolescents, who often have problems with efficient glycaemic management [7, 8], especially in a challenging situation such as exercise. Therefore, exercise has been shown to significantly worsen the performance of the Dexcom G6 rtCGM, which can mainly be attributed to the fact that the diffusion of glucose from the bloodstream to the interstitium has a physiological lag time of 3–12 minutes [25–27].
This is also supported by the study of Dyess et al. [39], where the MARD of the Dexcom G6 rtCGM in adolescents increased from 14% at the beginning of a cycling training to 33% at the end of the exercise session. Furthermore, MARD improved after exercise. This tendency also suggests that the primary challenge for the CGM sensors is the high rate of change in glucose during exercise, which is why the MARD or MedARD improves significantly as soon as exercise no longer affects BG.
Comparable tendencies were also found for the FreeStyle Libre 1 isCGM by a previous study of our research group [28]. Here, an overall MedARD of 22.0% [13.9–29.7] and 36.3% [24.2–45.2] during hypoglycaemia for 55 min of moderate-intensity cycling exercise in adults with T1D was observed. Similarly to the present study, an overestimation of CGM glucose values compared to the reference BG was detected (Bland–Altman analysis). Overall, CGM inaccuracy seems to be a challenge resulting predominantly from exercise physiology and only to a limited extent from technological aspects of the specific CGM sensors. As a result, in addition to improved CGM systems, novel approaches to overcome the lag time and reduce the risk of inadequate therapy decisions are necessary. Possible solutions could be an exercise-related algorithm [25, 40], the integration of additional physiological parameters [41, 42], or faster-acting insulins [43]. However, technological advancements as well as expanded research in multiple areas are necessary to overcome this hurdle completely [44].
In addition, the study-specific BG-RoC data distribution was compared with the data distribution recommended by the guidelines to test the validity of the accuracy calculations [30]. The recommended 7.5% for glucose values “> 300 mg/dl”, “< 70 mg/dl”, and “Alert high” as well as the ≤ 70% for “neutral” glucose values could not be achieved in our study. However, it should be emphasised that the aim of this study was to evaluate the accuracy for a specific type of sport – track and field – in real-life conditions. Therefore, only a conclusion about the sensor accuracy in a very specific situation can be made.
In addition to not meeting the glucose area targets, limitations of the present study include the small number of participants. This can be partly compensated by the fact that all participants took part in 9–12 exercise visits, resulting in 443 measurement pairs being evaluated. Furthermore, the absence of Post-Ex values for n = 4 participants due to organisational reasons introduces a bias, resulting in the Post-Ex values appearing artificially better than those obtained Pre-Ex and In-Ex. However, no significant differences were observed between Pre-, In-, and Post-Ex measurements. When working with children and adolescents in real-world settings, organisational challenges may inevitably arise. These hurdles should be considered in future studies. Additionally, to simulate real-world conditions, we did not control insulin dosing, carbohydrate intake, or sensor calibration prior to exercise, which can influence the sensor accuracy [28]. Furthermore, the sampling of capillary BG during exercise visits could reduce the accuracy of the reference values. However, the collection never took place during active movement, so this limitation should be minimal. Additionally, it could be argued that the type of exercise may play a role in the performance of the sensor. This is refuted by the study of Guillot et al., who showed that the Dexcom G6 system showed no significant changes in MedARD across aerobic, resistance, and HIIT exercise [45].
Conclusions
In the context of structured track and field training involving adolescents with T1D, the accuracy of the Dexcom G6 system appears reduced across pre-, during, and post-exercise periods. Especially the observation of a clinically relevant 28% MedARD during exercise-related hypoglycaemia and the overestimation of CGM BG values underscores the importance of considering glucose trend arrows and, when in doubt, conducting capillary blood checks to maintain euglycaemia during physical activity.


