
Introduction
Portal vein thrombosis (PVT) is significantly more prevalent in individuals with cirrhosis, serving as a marker of disease severity [1]. The incidence of PVT increases notably in advanced stages of cirrhosis, with a prevalence of up to 17% in patients with decompensated cirrhosis; this prevalence increases up to 40% in the presence of HCC [2]. Zanetto et al. [3] emphasized that the re-equilibration of the hemostatic system, combined with decreased blood flow in the portal vein, is a significant contributor to the development of PVT in liver diseases, particularly cirrhosis. This highlights the critical role of both hemostatic balance and hemodynamic alterations in the pathogenesis of PVT in these patients.
The pathophysiology of PVT is multifaceted, involving a convergence of molecular pathways and mechanisms. Central to its development is Virchow’s triad, which encompasses alterations in blood flow, endothelial dysfunction, and hypercoagulability. In addition, PVT is influenced by inflammatory pathways that promote a prothrombotic environment; portal hypertension, which disrupts normal hemodynamics, genetic and epigenetic factors that predispose individuals to thrombosis; the role of extracellular vesicles in coagulation and cellular communication, impaired fibrinolysis, leading to reduced clot resolution; and dysregulation within the gut–liver axis, which contributes to systemic and local inflammatory responses [4].
A recent large prospective study by Turon et al. [5] investigating predictors of PVT in cirrhotic patients revealed no significant correlation between baseline hemostatic alterations – particularly those associated with coagulation and fibrinolysis – and the incidence of PVT during follow-up. However, the study had notable limitations. The hemostatic assessment excluded platelet aggregation, an important factor in thrombus formation. Additionally, the study cohort primarily consisted of patients with compensated cirrhosis, who typically exhibit milder hemostatic disturbances and a lower inherent risk of PVT. These factors may have contributed to the absence of a detected association.
Platelets are crucial in thrombus formation, and any changes in their function can significantly impact the development of thrombosis [6]. A previous study showed that increased platelet activation, as reflected by plasma biomarkers and platelet aggregation tests adjusted for platelet count, is associated with further disease progression and liver-related mortality in cirrhosis [7].
These findings underscore the importance of close monitoring of cirrhotic patients, particularly those with advanced disease or concurrent PVT, for early identification and management of PVT. Therefore, this study was designed to explore the relation of platelet activation and adhesion using platelet agonists (ristocetin and ADP) in cirrhotic patients with and without PVT and to assess the levels of vWF-Ag in those cases.
Material and methods
Patients
The study included 100 subjects (30 cirrhotic patients with PVT, 40 cirrhotic without PVT, and 30 healthy individuals as a control group). The diagnosis of cirrhosis was confirmed through a comprehensive evaluation, including histological, radiological (e.g., ultrasound, CT and MRI), laboratory markers (e.g., liver function tests [LFTs], international normalized ratio [INR], activated partial thromboplastin time [aPTT], and fibrosis scores) and clinical assessments. Decompensated cirrhosis was characterized by the presence of any current or past complications associated with cirrhosis, such as ascites at the time of recruitment or a history of variceal hemorrhage or hepatic encephalopathy (either at recruitment or in the patient’s medical history). The diagnosis of PVT was confirmed through abdominal ultrasound with Doppler imaging of the portal circulation, as well as by CT scan or MRI.
Patients with prothrombotic disorders or congenital coagulation abnormalities, end-stage renal insufficiency, hepatorenal syndrome, bacterial infections, or spontaneous bacterial peritonitis (SBP), as well as those receiving anticoagulants, antiplatelet, or antifibrinolytic therapy, were excluded from the study and were not eligible for recruitment.
The study was approved by the Institutional Review Board (IRB) of the National Liver Institute (NLI IRB 00014014/FWA00034015, protocol number: 00582/2024) and was conducted in accordance with national and institutional ethical guidelines, the 1964 Declaration of Helsinki and its subsequent amendments, as well as other applicable ethical standards. Informed consent was obtained from all patients prior to participation.
Methods
Nine milliliters of venous blood was collected from all participants and divided into 4 aliquots. Two milliliters of blood was put in EDTA vacutainer tubes for complete blood count (CBC) and platelet indices using a Sysmex XN 1000 hematology analyzer (Sysmex, Kobe, Japan). Four milliliters of blood was put in 2 tubes of 3.2% sodium citrate: one tube to prepare platelet poor plasma (PPP) for PT, INR, a PTT, fibrinogen using Sysmex CS-1600 automated hemostasis testing (Sysmex, Kobe, Japan), and D-dimer using a Cobas 6000 analyzer. The other citrated tube was used for separation of platelet rich plasma (PRP) to assess the platelet aggregation using an automated light transmission aggregometer (LTA). The remaining 3 ml of blood was put in a plain tube with clot activator to prepare serum for liver and kidney tests using the Cobas 6000 analyzer (c 501 module-Diagnostics, Germany), fibrin degradation product (FDP) measurement with a latex agglutination kit, and vWF Ag testing by ELISA.
Platelet aggregation assessment
The citrated blood samples were then centrifuged at 150 g for 10 minutes at room temperature to prepare PRP. The primary sample tubes were subsequently centrifuged at 2000 g for 15 minutes to generate PPP [8]. Platelet aggregation in the PRP was measured by assessing the increase in light transmission in response to the addition of platelet agonists, specifically ADP (10 µM) and ristocetin (1.25 mg/ml). Platelet aggregation induced by ristocetin and ADP was measured using the SYSMEX CS2000 SERIES, following protocols that allowed the generation of raw data (light transmission) under strictly controlled conditions. The conditions were meticulously controlled, including sample volume, incubation time, reagent volume, stirrer speed of the reaction mixture, and the duration of reaction monitoring [9]. All platelet agonists were procured from Hyphen Biomed (Neuville-sur-Oise, France). The Sysmex CS-2000i, a fully automated blood coagulation analyzer (Sysmex Corporation, Kobe, Japan), was used as the reference instrument for these measurements.
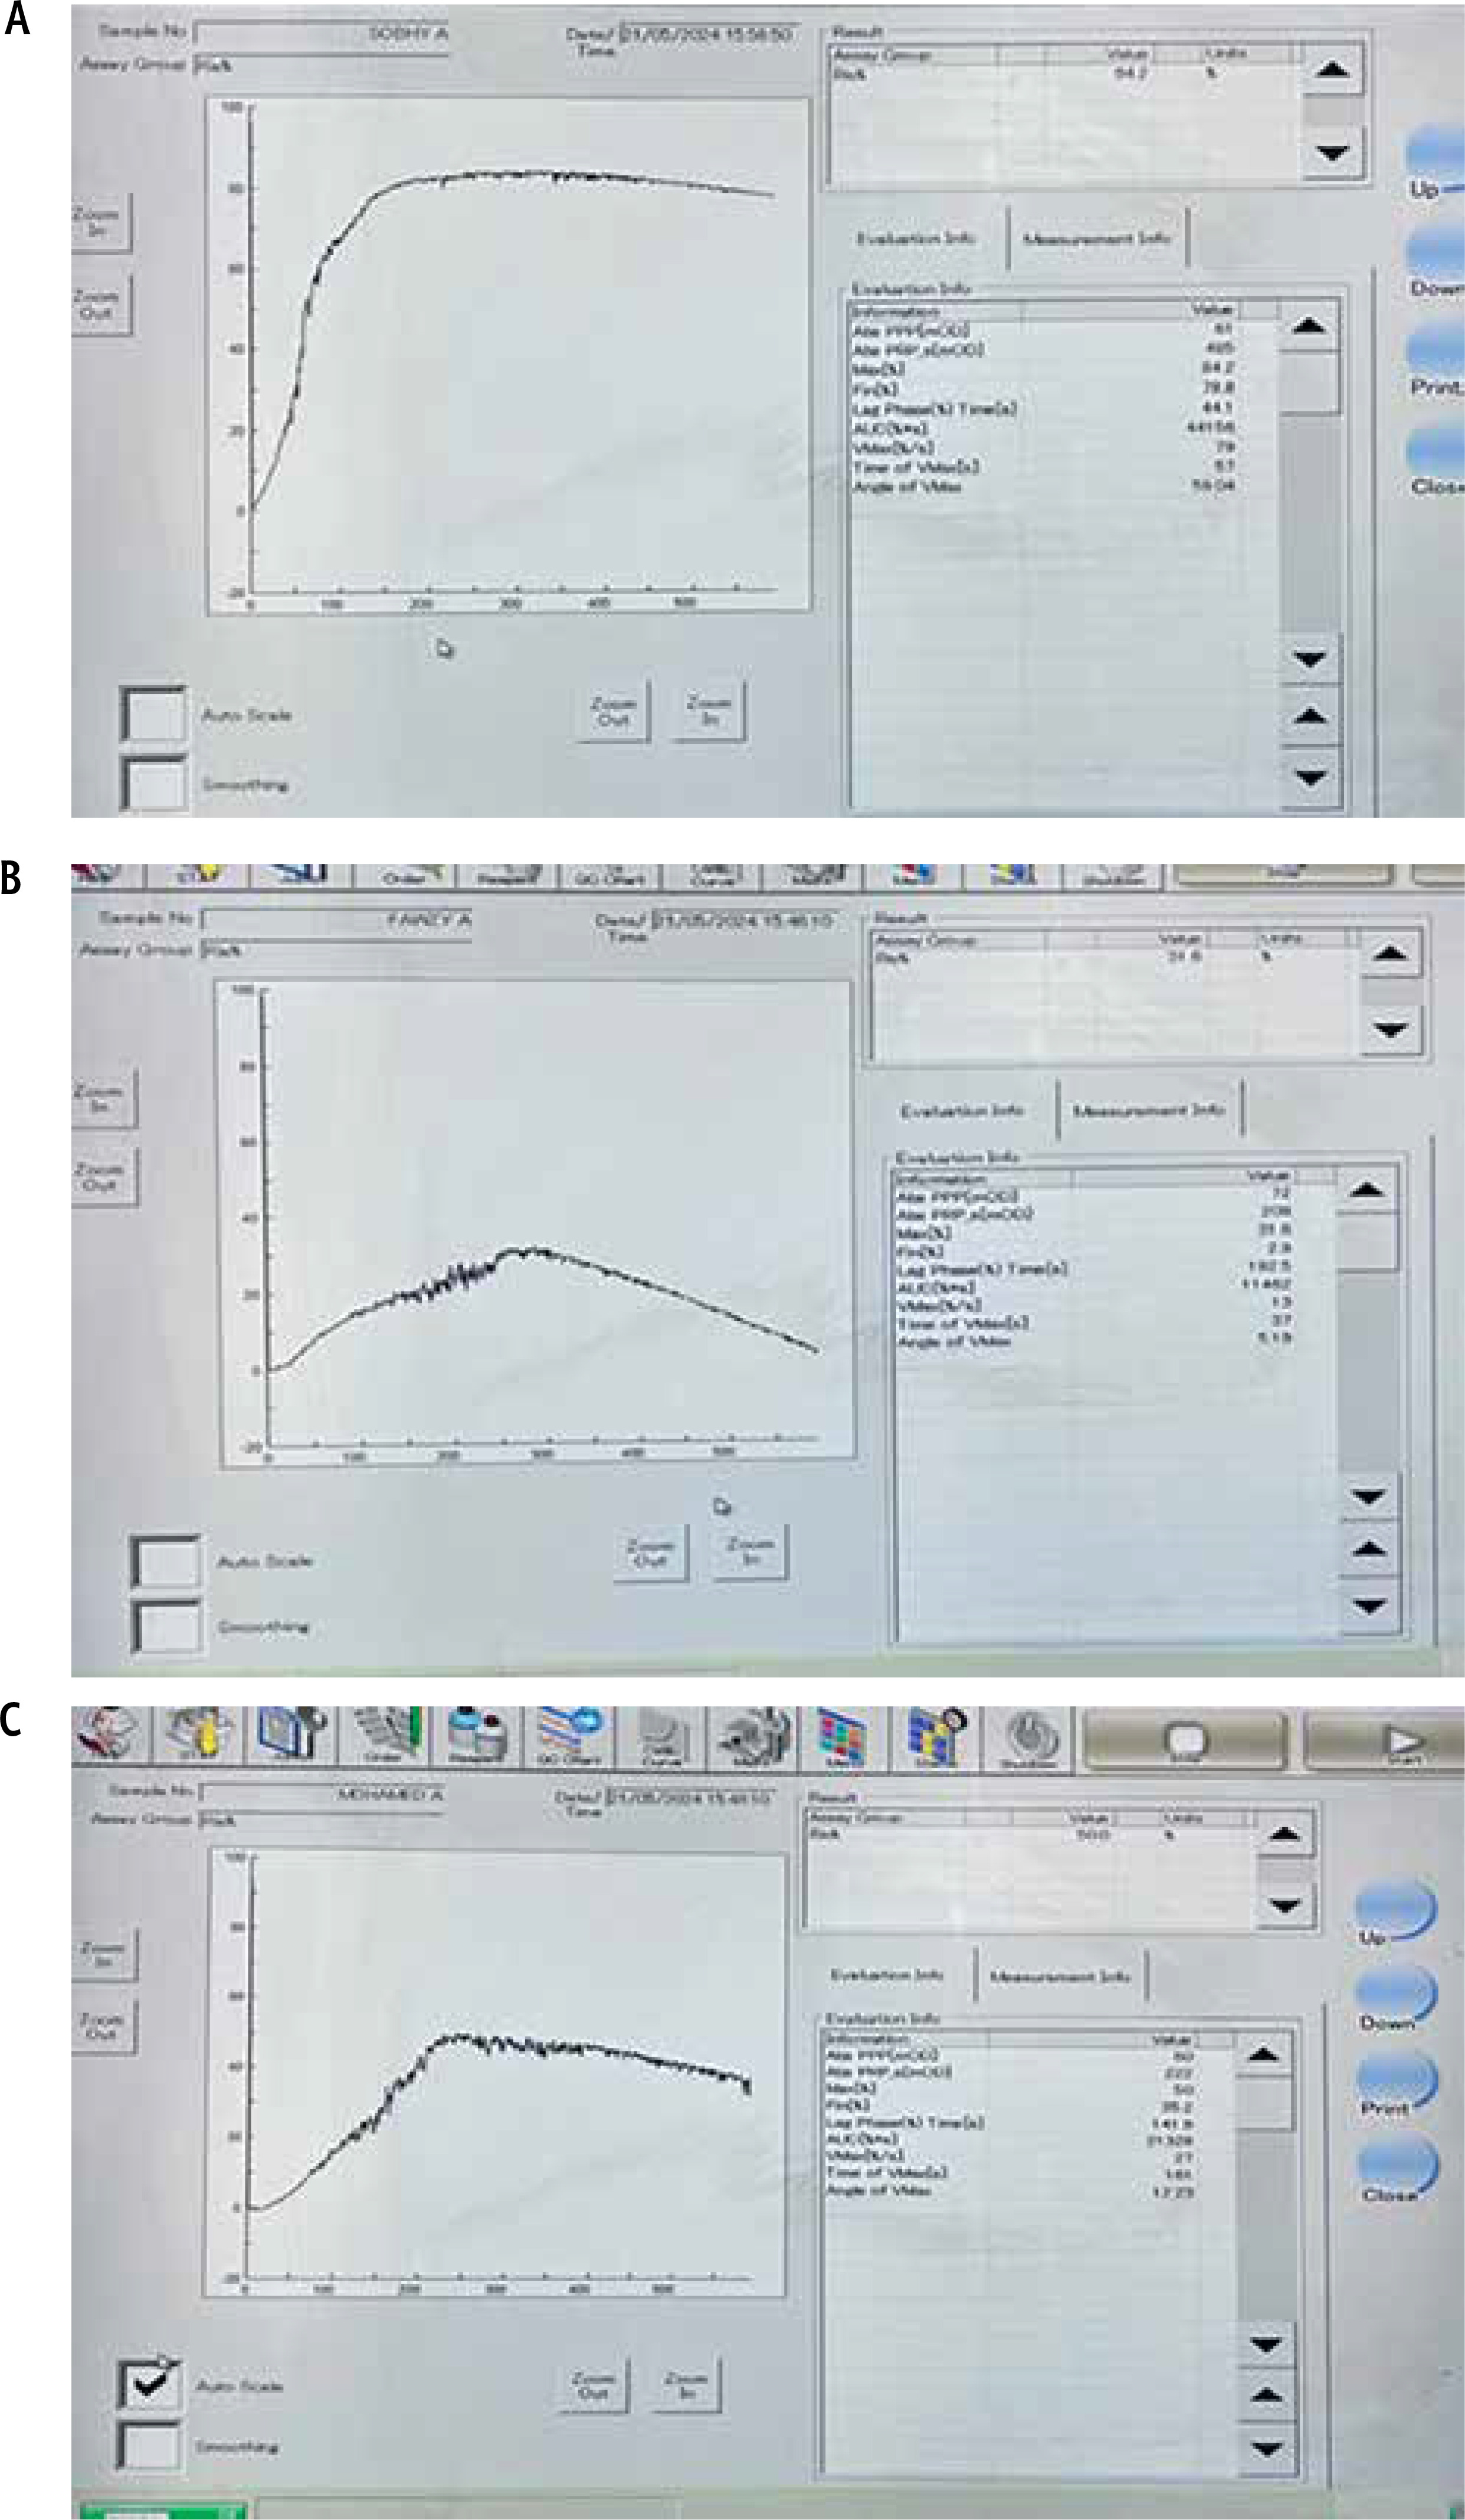
SB cuvettes were loaded into the CS-2000i analyzer, which automatically sampled the patient’s PPP prior to evaluating the PRP. The CS-2000i test protocols also included calculations for derived parameters, which were used to generate numerical data related to the platelet aggregation trace. These parameters included the light transmission at the start of monitoring, the maximum transmission, and the final transmission, with variations in these values indicating platelet disaggregation. Figures 1 and 2 illustrate ADP- and ristocetin-induced platelet aggregation measured using light transmission aggregometry (LTA) (Sysmex CS-2000i), in all studied groups.
Fig. 1
ADP-induced platelet aggregation using LTA (Sysmex CS-2000i). A) Healthy control showed maximum platelet aggregation (max %) = 82.4%. B) Patients with cirrhosis showed max (%) = 27.3%. C) Patients with PVT showed max (%) = 58.5%
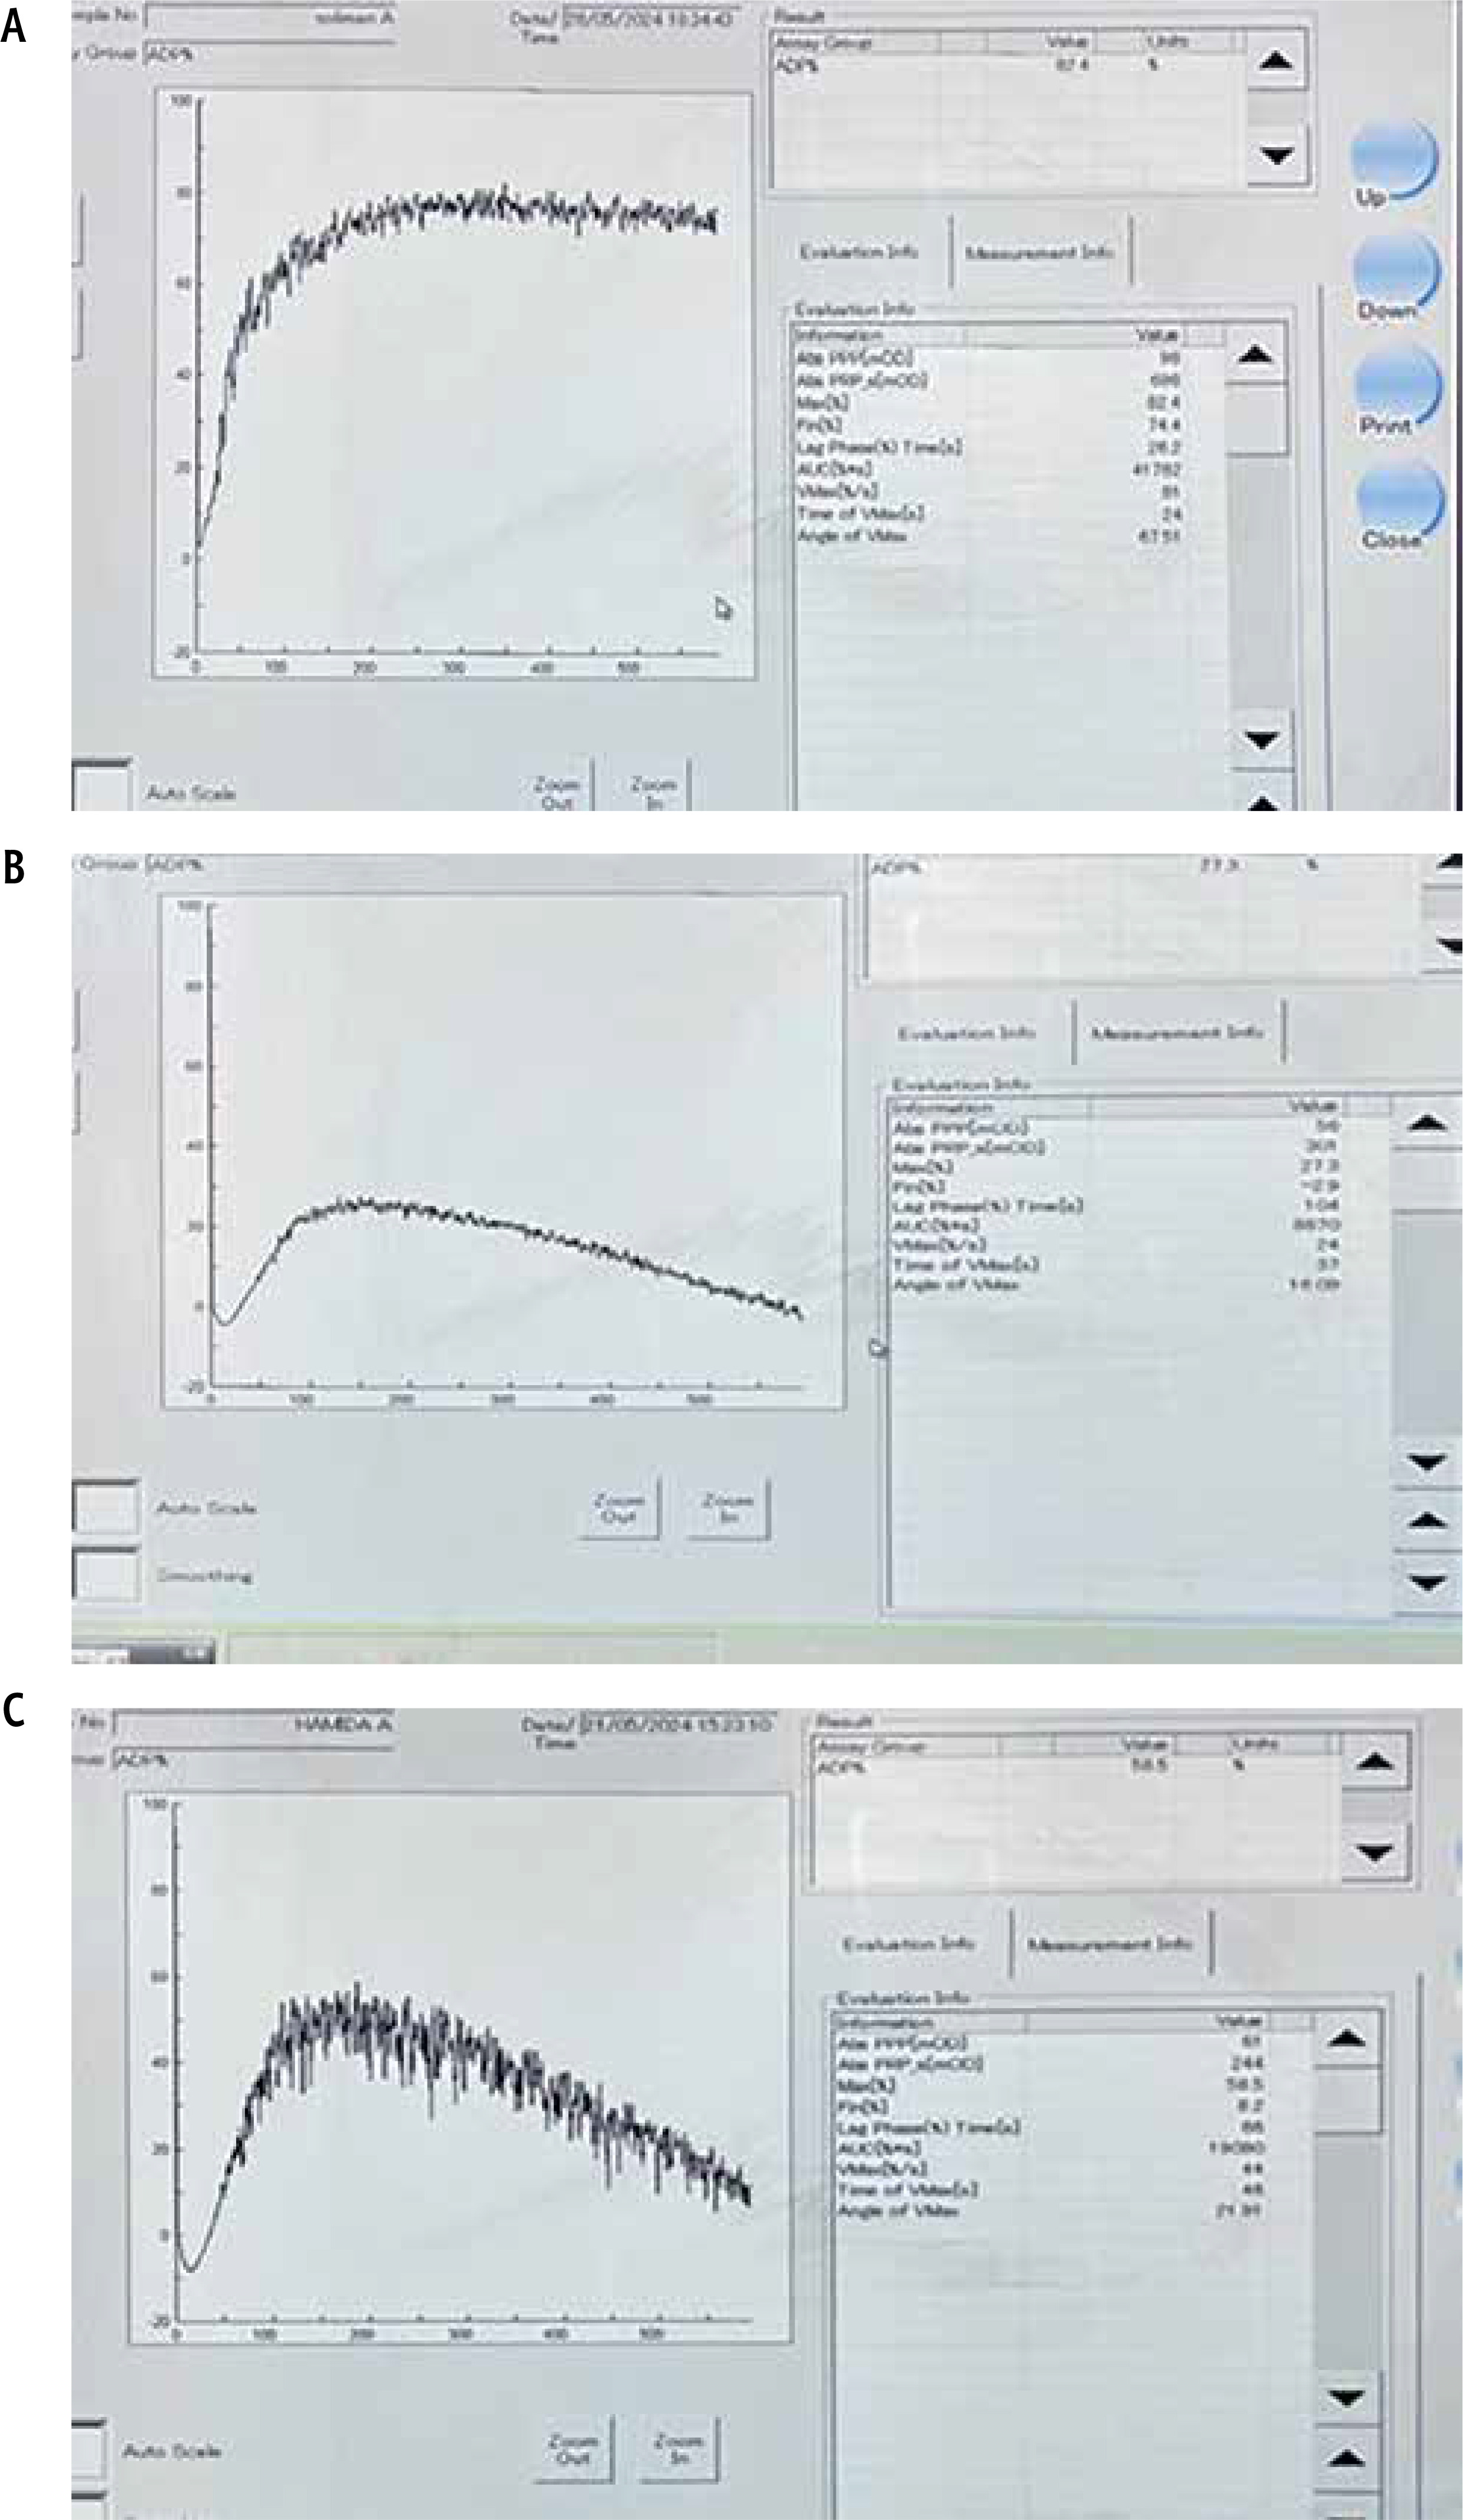
Fig. 2
Ristocetin-induced platelet aggregation using LTA (Sysmex CS-2000i). A) Healthy control showed maximum platelet aggregation (max %) = 84.2%. B) Patients with compensated cirrhosis showed max (%) = 31.6%. C) Patients with PVT showed max (%) = 50%
Von Willebrand factor levels were measured using a sandwich enzyme-linked immunosorbent assay (ELISA) kit (Catalog No: DL-vWF-Hu) [10]. The ELISA kit was pre-coated with an antibody specific to vWF. Standards and patient samples were added to the wells of a microplate, which contained a biotin-conjugated antibody specific to vWF. Following this, avidin conjugated with horseradish peroxidase (HRP) was added to each well and incubated. After the addition of tetra-methyl-benzidine (TMB) substrate solution, color changes were observed only in the wells containing vWF, the biotin-conjugated antibody, and HRP-conjugated avidin. The enzyme-substrate reaction was terminated by the addition of sulfuric acid, and the resulting color change was quantified spectrophotometrically at a wavelength of 450 nm. The vWF concentration in the samples was calculated by comparing their optical density (O.D.) values to a standard calibration curve.
The platelet count/spleen diameter ratio, a noninvasive predictive score for evaluating portal hypertension, was also calculated to assess its potential correlation with platelet function, vWF-Ag levels, and the presence of PVT.
Results
Among the participants, males comprised 57%, 63%, and 53% of cirrhotic with PVT, cirrhotic without PVT, and healthy groups, respectively. The mean ages of the groups were 50, 54, and 52 years, respectively. In cirrhosis patients, the prevalence of hepatic encephalopathy (HE) was 50% vs. 12%, and that of ascites was 67% vs. 30% in PVT vs. non-PVT patients.
Patients with PVT had more advanced liver disease and more severe portal hypertension compared to those without PVT, as evidenced by significantly lower platelet counts (p = 0.003), lower platelet/splenic diameter (p < 0.001), an elevated AST-to-platelet ratio index (APRI) (2.6 vs. 1.2, p = 0.001), and a more advanced Child-Pugh classification (57% of PVT patients were classified as Child-Pugh C, compared to 23% in the non-PVT cohort; p < 0.001). Further clinical data and statistical analyses are presented in Table 1.
Table 1
Comparison of clinical parameters among different diseased patient groups
| Parameters | PVT (n = 30) | Cirrhosis (n = 40) | Test of sig. | p | ||
|---|---|---|---|---|---|---|
| n | % | n | % | |||
| Esophageal varices | ||||||
| No | 28 | 93.3 | 34 | 85.0 | χ2 = 1.176 | FEp = 0.452 |
| Yes | 2 | 6.7 | 6 | 15.0 | ||
| Ascites | ||||||
| None | 10 | 33.3 | 28 | 70.0 | FET = 16.902* | < 0.001* |
| Mild | 8 | 26.7 | 11 | 27.5 | ||
| Moderate | 8 | 26.7 | 1 | 2.5 | ||
| Marked | 4 | 13.3 | 0 | 0.0 | ||
| Spleen diameter (cm) | ||||||
| Min-max | 13.0-23.0 | 11.0-23.0 | t = 4.354* | < 0.001* | ||
| Mean ±SD | 19.25 ±3.11 | 16.18 ±2.77 | ||||
| Platelet/splenic diameter | ||||||
| Min-max | 1.63-7.56 | 2.33-13.87 | t = 5.867* | < 0.001* | ||
| Mean ±SD | 4.53 ±1.80 | 8.18 ±3.34 | ||||
| Child-Pugh Score | ||||||
| A | 0 | 0.0 | 5 | 12.5 | FET = 10.230* | 0.005* |
| B | 13 | 43.3 | 26 | 65.0 | ||
| C | 17 | 56.7 | 9 | 22.5 | ||
| Min-max | 7.0-15.0 | 6.0-11.0 | t = 4.455* | < 0.001* | ||
| Mean ±SD | 10.37 ±2.14 | 8.38 ±1.37 | ||||
| FIB-4 | ||||||
| Min-max | 2.39-33.94 | 1.15-13.26 | U = 242.0* | < 0.001* | ||
| Median (IQR) | 7.36 (5.19-11.46) | 4.05 (2.79-5.22) | ||||
| Encephalopathy | ||||||
| No | 15 | 50.0 | 35 | 87.5 | χ2 = 11.813* | 0.001* |
| Yes | 15 | 50.0 | 5 | 12.5 | ||
IQR – interquartile range, SD – standard deviation, χ2 – chi square test, FET – Fisher exact test, F – F for one-way ANOVA test, pairwise comparison between each 2 groups was done using Tukey post hoc test, H – H for Kruskal-Wallis test, pairwise comparison between each 2 groups was done using a post hoc test (Dunn’s test for multiple comparisons), p – p value for comparing between PVT and cirrhosis, FIB-4 – Fibrosis 4;
Platelet aggregation was significantly reduced in both groups of patients with cirrhosis (with and without PVT) compared to healthy individuals; however, cirrhotic patients with PVT had higher platelet aggregation levels than those without PVT.
Additionally, ADP-induced maximum platelet aggregation (max%) was significantly lower in patients with PVT at 45.50 (41.0-50.0) and in non-PVT patients at 29.50 (23.0-34.0) compared to the 82.0 (80.0-86.0) observed in healthy controls (p < 0.001). Similarly, ristocetin-induced maximum platelet aggregation (max%) was 45.40 (35.20-56.30) in PVT patients and 37.70 (32.40-44.65) in non-PVT patients, both substantially lower than the 86.0 (82.0-89.0) seen in healthy individuals (p < 0.001). Further data and statistical analyses are presented in Table 2.
Table 2
Comparison of the studied groups based on platelet function test results
| Parameter | PVT (n = 30) | Cirrhosis (n = 40) | Control (n = 30) | H | p |
|---|---|---|---|---|---|
| ADP max (%) | |||||
| Min-max | 37.0-64.0 | 15.0-60.0 | 58.30-90.80 | 79.298* | < 0.001* |
| Median (IQR) | 45.50 (41.0-50.0) | 29.50 (23.0-34.0) | 82.0 (80.0-86.0) | ||
| Sig. bet. groups | p1 < 0.001*, p2 < 0.001*, p3 < 0.001* | ||||
| ADP disaggregation (%) | |||||
| Min-max | 2.70-28.0 | 9.0-26.0 | 4.0-27.30 | 50.504* | < 0.001* |
| Median (IQR) | 15.50 (12.0-19.0) | 13.50 (12.0-18.50) | 7.0 (6.0-8.0) | ||
| Sig. bet. Groups | p1=0.833, p2<0.001*, p3< 0.001* | ||||
| Platelet ratio (ADP max aggreg./platelet) | |||||
| Min-max | 0.25-1.55 | 0.10-0.88 | 0.16-0.45 | 39.421* | < 0.001* |
| Median (IQR) | 0.62 (0.41-0.77) | 0.25 (0.15-0.35) | 0.31 (0.24-0.37) | ||
| Sig. bet. Groups | p1 < 0.001*, p2 < 0.001*, p3 = 0.185 | ||||
| Ristocetin max (%) | |||||
| Min-max | 30.20-71.20 | 28.0-73.0 | 49.0-90.0 | 62.372* | < 0.001* |
| Median (IQR) | 45.40 (35.20-56.30) | 37.70 (32.40-44.65) | 86.0 (82.0-89.0) | ||
| Sig. bet. Groups | p1 = 0.074, p2 < 0.001*, p3 < 0.001* | ||||
| Ristocetin disaggregation (%) | |||||
| Min-max | 2.0-25.80 | 9.0-30.0 | 2.0-18.0 | 47.018* | < 0.001* |
| Median (IQR) | 15.70 (11.70-21.30) | 13.60 (12.0-16.85) | 7.0 (5.0-9.0) | ||
| Sig. bet. Groups | p1 = 0.717, p2 < 0.001*, p3 < 0.001* | ||||
| Platelet ratio (ristocetin max aggreg./platelet) | |||||
| Min-max | 0.19-1.13 | 0.12-1.07 | 0.21-0.44 | 28.773* | < 0.001* |
| Median (IQR) | 0.59 (0.39-0.80) | 0.30 (0.23-0.46) | 0.31 (0.25-0.37) | ||
| Sig. bet. Groups | p1 < 0.001*, p2 < 0.001*, p3 = 0.517 | ||||
| vWF concentration | |||||
| Min-max | 57.24-240.5 | 10.85-186.8 | 2.01-111.9 | 29.672* | < 0.001* |
| Median (IQR) | 142.3 (73.15-191.4) | 80.34 (56.66-128.3) | 46.91 (22.59-77.87) | ||
| Sig. bet. Groups | p1 = 0.002*, p2 < 0.001*, p3 = 0.006* | ||||
IQR – interquartile range, SD – standard deviation, H – H for Kruskal-Wallis test, pairwise comparison between each 2 groups was done using a post hoc test (Dunn’s test for multiple comparisons), p – p value for comparing between the three studied groups, p1 – p value for comparing between PVT and cirrhosis, p2 – p value for comparing between PVT and control, p3 – p value for comparing cirrhosis and control;
For ADP-induced aggregation, the PLT ratio was 0.62 (0.41-0.77) in PVT patients vs. 0.25 (0.15-0.35) in non-PVT patients. For ristocetin-induced aggregation, the PLT ratio was 0.59 (0.39-0.80) in PVT patients compared to 0.30 (0.23-0.46) in non-PVT patients (p < 0.001). Detailed comparisons are presented in Table 2.
The vWF-Ag serum levels were 142.3 (73.15-191.4) in PVT patients and 80.34 (56.66-128.3) in non-PVT patients and 46.91 (22.59-77.87) in healthy individuals. The level was significantly higher in cirrhotic patients with PVT compared to without, and both groups exhibited significantly elevated levels compared to healthy controls (p < 0.001) (Table 2).
Notably, the ADP-platelet ratio (ADP maximum aggregation/platelet count) demonstrated discriminative ability for predicting the development of PVT. A cutoff value of > 0.33 and AUC 0.884 yielded a sensitivity of 86.7% and a specificity of 75%. Similarly, the PLT ratio (maximum ristocetin-induced aggregation/platelet count) with a cutoff of > 0.36 and AUC 0.798 achieved 83.3% sensitivity and 62.5% specificity. The vWF levels with a cutoff value of > 87.52 and AUC 0.728 exhibited 70% sensitivity and 60% specificity for identifying the risk of PVT development (Table 3).
Table 3
Diagnostic performance of various parameters in distinguishing cirrhotic patients with PVT from those without PVT
| Parameter | AUC | p | 95% CI | Cut off | Sensitivity | Specificity | PPV | NPV |
|---|---|---|---|---|---|---|---|---|
| Platelet ratio (ADP max aggreg./platelet count) | 0.884 | < 0.001* | 0.806-0.961 | > 0.33 | 86.67 | 75.0 | 72.2 | 88.2 |
| Platelet ratio (ristocetin max aggreg./platelet count) | 0.798 | < 0.001* | 0.694-0.903 | > 0.36 | 83.33 | 62.50 | 62.5 | 83.3 |
| vWF concentration | 0.728 | 0.001* | 0.608-0.848 | > 87.52 | 70.0 | 60.0 | 56.8 | 72.7 |
A significant positive correlation was observed between the ADP platelet ratio and FIB-4 and APRI in the cirrhotic and PVT groups. In contrwast, a significant negative correlation was found between the ADP platelet ratio and both platelets count and the platelet/splenic diameter ratio (Table 4).
Table 4
Correlation between ADP platelet ratio (ADP maximum aggregation/platelet count) and various parameters in patient groups
| Parameter | Platelet ratio (ADP max aggreg./platelet count) | |||
|---|---|---|---|---|
| PVT (n = 30) | Cirrhosis (n = 40) | |||
| rs | p | rs | p | |
| Age | –0.026 | 0.891 | –0.111 | 0.495 |
| Spleen diameter | –0.080 | 0.675 | 0.202 | 0.210 |
| PLT/spleen diameter | –0.026 | 0.891 | –0.800 | < 0.001* |
| FIB-4 | 0.427 | 0.019* | 0.637 | < 0.001* |
| Child score | –0.071 | 0.711 | 0.214 | 0.185 |
| Hemoglobin | –0.020 | 0.917 | 0.323 | 0.042* |
| WBCs | 0.105 | 0.581 | –0.493 | 0.001* |
| Platelet count | –0.930 | < 0.001* | –0.818 | < 0.001* |
| MPV | 0.059 | 0.758 | 0.180 | 0.267 |
| INR | 0.177 | 0.350 | –0.008 | 0.960 |
| APTT | 0.602 | < 0.001* | 0.060 | 0.711 |
| AST | 0.040 | 0.834 | 0.082 | 0.614 |
| ALT | 0.037 | 0.848 | –0.086 | 0.596 |
| AST/ALT | –0.106 | 0.576 | 0.188 | 0.247 |
| ALP | –0.170 | 0.370 | –0.187 | 0.249 |
| Albumin | 0.003 | 0.986 | –0.402 | 0.010* |
| Fibrinogen | –0.400 | 0.029* | –0.037 | 0.818 |
| D-dimer | 0.344 | 0.063 | 0.147 | 0.365 |
| GGT | –0.158 | 0.405 | –0.342 | 0.031* |
| Bilirubin total | 0.204 | 0.279 | –0.222 | 0.169 |
| Creatinine | 0.210 | 0.264 | –0.262 | 0.102 |
| APRI | 0.510 | 0.004* | 0.617 | < 0.001* |
| ADP max aggregation (%) | 0.067 | 0.726 | 0.715 | < 0.001* |
| ADP disaggregation (%) | –0.097 | 0.611 | 0.335 | 0.035* |
| Ristocetin max aggregation (%) | –0.070 | 0.714 | 0.183 | 0.259 |
| Ristocetin disaggregation (%) | –0.104 | 0.586 | –0.140 | 0.390 |
| vWF concentration | –0.011 | 0.953 | –0.205 | 0.205 |
rs – Spearman coefficient, FIB-4 – Fibrosis-4, MPV – mean platelet volume, INR – international normalized ratio, APTT – activated partial thromboplastin time, AST – aspartate aminotransferase, ALT – alanine aminotransferase, ALP – alkaline phosphatase, GGT – γ-glutamyl transferase, APRI – aspartate aminotransferase to platelet ratio index;
The Ristocetin platelet ratio demonstrated a significant positive correlation with FIB-4, APRI, and Ristocetin maximum aggregation percentage in the PVT group and cirrhotic patients, as presented in Table 5.
Table 5
Correlation between ristocetin platelet ratio (ristocetin maximum aggregation/platelet count) and various parameters in patient groups
| Parameter | Platelet ratio (ristocetin max aggreg./platelet count) | |||
|---|---|---|---|---|
| PVT (n = 30) | Cirrhosis (n = 40) | |||
| rs | P | rs | P | |
| Age | 0.145 | 0.443 | 0.118 | 0.470 |
| Spleen diameter | –0.258 | 0.169 | 0.062 | 0.706 |
| PLT/spleen diameter | –0.689 | < 0.001* | –0.780 | < 0.001* |
| FIB-4 | 0.536 | 0.002* | 0.725 | < 0.001* |
| Child score | –0.055 | 0.771 | 0.134 | 0.410 |
| Hemoglobin | 0.167 | 0.378 | 0.286 | 0.074 |
| WBCs | –0.031 | 0.871 | –0.362 | 0.022* |
| Platelet count | –0.846 | < 0.001* | –0.871 | < 0.001* |
| MPV | 0.193 | 0.308 | 0.189 | 0.244 |
| INR | 0.169 | 0.371 | –0.113 | 0.488 |
| APTT | 0.438 | 0.016* | –0.138 | 0.395 |
| AST | 0.027 | 0.888 | –0.066 | 0.684 |
| ALT | –0.307 | 0.099 | –0.178 | 0.271 |
| AST/ALT | 0.162 | 0.393 | 0.234 | 0.146 |
| ALP | –0.161 | 0.396 | 0.102 | 0.531 |
| Albumin | –0.075 | 0.692 | –0.332 | 0.036* |
| Fibrinogen | –0.350 | 0.058 | 0.119 | 0.466 |
| D-dimer | 0.279 | 0.136 | –0.018 | 0.911 |
| GGT | 0.093 | 0.623 | –0.228 | 0.157 |
| Bilirubin total | 0.070 | 0.711 | –0.077 | 0.636 |
| Creatinine | 0.119 | 0.531 | –0.213 | 0.186 |
| APRI | 0.468 | 0.009* | 0.579 | < 0.001* |
| ADP max aggregation (%) | –0.206 | 0.274 | 0.308 | 0.053 |
| ADP disaggregation (%) | –0.127 | 0.505 | 0.039 | 0.810 |
| Ristocetin max aggregation (%) | 0.425 | 0.019* | 0.489 | 0.001* |
| Ristocetin disaggregation (%) | –0.084 | 0.659 | –0.145 | 0.372 |
| vWF concentration | 0.010 | 0.957 | –0.142 | 0.382 |
rs – Spearman coefficient, FIB-4 – Fibrosis 4, MPV – mean platelet volume, INR – international normalized ratio, APTT – activated partial thromboplastin time, AST – aspartate aminotransferase, ALT – alanine aminotransferase, ALP – alkaline phosphatase, GGT – γ-glutamyl transferase, APRI – aspartate aminotransferase to platelet ratio index;
Univariate and multivariate analyses were conducted to identify potential predictive factors for the development of PVT in cirrhosis. The univariate analysis revealed that the following factors were positively correlated with an increased risk of PVT: Child-Pugh classification (p = 0.004), D-dimer levels (p = 0.011), platelet count (p = 0.001), platelet aggregation following ADP stimulation (p < 0.001), platelet aggregation following ristocetin stimulation (p = 0.023), platelet ratio (maximum ADP-induced aggregation/platelet count) (p < 0.001), platelet ratio (maximum ristocetin-induced aggregation/platelet count) (p < 0.001) and vWF-Ag concentration (p = 0.001). The multivariate analysis, using a model adjusted for these parameters, identified vWF-Ag concentration as the sole independent risk factor and predictor for PVT pathogenesis in cirrhosis (Table 6).
Table 6
Univariate and multivariate logistic regression analysis of parameters influencing the presence of PVT in cirrhotic patients
| Parameter | Univariate | Multivariate# | ||
|---|---|---|---|---|
| p | OR (LL-UL 95% CI) | p | OR (LL-UL 95% CI) | |
| Age | 0.076 | 0.959 (0.915-1.004) | ||
| Gender | 0.622 | 1.275 (0.486-3.345) | ||
| Esophageal varices | 0.290 | 0.405 (0.076-2.165) | ||
| Child-Pugh classification (C vs. A + B) | 0.004* | 4.504 (1.599-12.686) | 0.537 | 1.907 (0.246-14.808) |
| Hemoglobin (g/dl) | 0.089 | 0.791 (0.603-1.037) | ||
| Platelet count (µl) | 0.001* | 0.977 (0.964-0.990) | 0.764 | 0.992 (0.938-1.048) |
| MPV | 0.448 | 1.261 (0.692-2.299) | ||
| ALT (U/l) | 0.076 | 0.978 (0.954-1.002) | ||
| ALP (U/l) | 0.644 | 0.999 (0.996-1.003) | ||
| Albumin (g/dl) | 0.817 | 1.075 (0.584-1.978) | ||
| Fibrinogen (mg/dl) | 0.054 | 0.993 (0.985-1.0) | ||
| D-dimer (mg/l) | 0.011* | 1.004 (1.001-1.007) | 0.974 | 1.000 (0.993-1.007) |
| Creatinine (mg/dl) | 0.731 | 0.856 (0.353-2.077) | ||
| ADP max (%) | < 0.001* | 1.241 (1.124-1.370) | 0.471 | 1.089 (0.864-1.371) |
| ADP disaggregation (%) | 0.627 | 1.023 (0.933-1.123) | ||
| Platelet ratio (ADP max aggreg./platelet) | < 0.001* | 2.071 (1.490-2.879) | 0.278 | 4.050 (0.323-50.705) |
| Ristocetin max (%) | 0.023* | 1.053 (1.007-1.101) | 0.139 | 1.143 (0.958-1.363) |
| Ristocetin disaggregation (%) | 0.628 | 1.022 (0.935-1.118) | ||
| Platelet ratio (ristocetin max aggreg./platelet) | < 0.001* | 1.548 (1.215-1.972) | 0.316 | 0.415 (0.074-2.318) |
| vWF concentration (ng/ml) | 0.001* | 1.015 (1.006-1.025) | 0.048* | 1.022 (1.000-1.044) |
Statistical analysis
The data was processed and analyzed using IBM SPSS Statistics software version 20.0 (Armonk, NY: IBM Corp). Qualitative data were presented as frequencies and percentages, while the Shapiro-Wilk test was used to check the normality of data distribution. The results of parametric tests were presented as mean and standard deviation, while those of nonparametric tests were reported as median and interquartile range, as appropriate. Group comparisons for quantitative variables were conducted using the Student’s t-test and Mann-Whitney test, while the Chi-square (χ2) test, supplemented by Fisher’s exact test, was applied to qualitative variables.
Multivariate analysis was conducted using logistic regression for variables found to be significant in univariate analysis. Receiver operating characteristic (ROC) curve analysis was performed to identify the optimal cut-off value for predicting PVT. Statistical significance was defined as p < 0.05.
Discussion
The combination of a disrupted hemostatic balance and reduced blood flow in the portal vein contributes significantly to the development of PVT, particularly in cirrhosis [3, 11]. Recent studies have emphasized that platelet function is hyperactive in cirrhotic patients, particularly during the progression of PVT. This supports the notion that platelets play a crucial role in the pathogenesis of PVT in cirrhosis [12]. Additionally, endothelial damage specifically affecting the portal vasculature can compromise its antithrombotic properties, potentially acting as a major local risk factor in the development of PVT [13]. These interrelated factors highlight the complexity of PVT pathogenesis, necessitating a comprehensive approach to its understanding and management.
This study revealed that platelet aggregation was significantly reduced in cirrhotic patients (with and without PVT) compared to healthy subjects, and increased in cirrhotic patients developing PVT than whom without PVT. Similarly, Zhao et al. [14] demonstrated that platelet activation, as indicated by the upregulation of CD62p and CD63 expression and the formation of monocyte-platelet aggregates (MPAs) and neutrophil-platelet aggregates (NPAs), assessed via flow cytometry (FCM), is markedly increased during PVT progression.
Furthermore, evidence from Quan et al. [15] established that PVT correlates with increased platelet-fibrin clot strength, detected through thromboelastography (TEG), and elevated platelet activation in individuals with decompensated cirrhosis. These findings collectively reinforce the central role of platelet function and activation in the pathogenesis of PVT in cirrhosis.
According to a study conducted by Altahan et al. [16], it was concluded that diagnostic light transmission aggregometry (LTA) using low PRP (L-PRP) is feasible and informative, provided that the approach accounts for the severity of thrombocytopenia and adjusts for the expected maximal aggregation (MA) findings based on the platelet count in the L-PRP sample. The agonist-induced maximum platelet aggregation was normalized to each patient’s platelet count using a platelet aggregation-to-platelet count ratio (PLT ratio), calculated as: [maximum platelet aggregation%/platelet count × 103/ml]. Significantly higher PLT ratios were recorded in cirrhotic patients with PVT compared to those without PVT.
Notably, the PLT ratio (maximum ADP-induced aggregation/platelet count) demonstrated discriminative ability for predicting the development of PVT. A cutoff value of > 0.33 yielded a sensitivity of 86.7% and a specificity of 75%. Additionally, we evaluated the strength of the discriminative power based on AUC thresholds; the AUC value was 0.884, categorized as strong (≥ 0.80). Similarly, the PLT ratio (maximum ristocetin-induced aggregation/platelet count) with a cutoff of > 0.36 achieved 83.3% sensitivity, 62.5% specificity, and AUC 0.798, considered moderate (0.70-0.79). The vWF levels with a cutoff value of > 87.52 exhibited 70% sensitivity, 60% specificity, and AUC 0.728, considered moderate strength for identifying the risk of PVT development. Similarly, Zanetto et al. [12] highlighted the significance of the PLT ratio in predicting PVT development during follow-up.
The vWF-Ag levels were measured to explore their potential as predictive markers for PVT in patients with decompensated cirrhosis. Gaining a better understanding of thrombotic risk in this patient population could enhance the management of hemostasis and improve clinical outcomes. The vWF-Ag serum levels were significantly higher in cirrhotic patients with PVT compared to without, and both groups exhibited significantly elevated levels compared to healthy controls. Furthermore, the multivariate analysis, using a model adjusted for these parameters, identified vWF-Ag concentration as the sole independent risk factor and predictor for PVT pathogenesis in cirrhosis. These results align with previous studies [17, 18], which highlight the pivotal role of platelet function and vWF-Ag levels in the pathogenesis and progression of PVT.
In contrast, our findings regarding vWF levels are not in agreement with those of Zanetto et al. [12], who reported similar vWF levels between PVT and non-PVT groups (p = 0.2). This suggests that vWF did not offer significant additional value as a predictive marker for PVT in their study.
Finally, the understanding that PVT in liver diseases is driven not solely by coagulation abnormalities but also by significant hemodynamic changes, makes it essential to consider both factors when assessing and managing PVT risk in cirrhosis and related liver disorders. In patients with liver cirrhosis, dysregulation of platelet function is characterized by higher platelet aggregation compared to the baseline observed in the cirrhotic stage without thrombosis. Additionally, elevated vWF levels are independently associated with the development of PVT, irrespective of the severity of the underlying liver disease. These findings suggest that platelet function markers could serve as reliable predictors for assessing PVT risk.
Study limitations
Our study has several notable limitations. First, we focused solely on ADP- and ristocetin-induced platelet aggregation using light transmission aggregometry (LTA). Consequently, it remains uncertain whether similar results would be obtained using alternative devices or different agonists. Second, decompensated cirrhosis represents a dynamic clinical state; hence, serial assessments of the PLT ratio could offer more comprehensive insights into thrombotic risk. Additionally, reassessing the PLT ratio at the time of PVT development could further strengthen the argument for a connection between changes in platelet aggregation and the onset and pathophysiology of PVT. Third, we did not assess other components of primary hemostasis, such as ADAMTS-13, which could improve the identification of patients at elevated risk for thrombosis [19]. Including this evaluation may offer a more thorough assessment of thrombotic risk in cirrhotic patients. Furthermore, we did not measure portal blood flow velocity, a recognized risk factor for PVT in individuals with cirrhosis [5]. Including this parameter could offer valuable insights into the thrombotic risk in this patient group.
In conclusion, this study suggests that enhanced platelet aggregation is positively associated with an increased risk of PVT in cirrhotic patients, and elevated vWF-Ag serum level was identified as an independent risk factor and predictor for PVT in cirrhosis. Therefore, further research is warranted to explore the role of hemostasis and platelet function in the development of PVT. Such investigations could potentially identify novel therapeutic targets to prevent thrombosis and its related complications in cirrhotic patients.


