
Introduction
Renal cell carcinoma (RCC) accounts for 5% and 3% of all malignancies in men and women, respectively, representing the 7th most common cancer in men, and the 10th most common cancer in women [1]. Clear cell renal cell carcinoma (ccRCC) is the most common type of RCC (80% of cases). Computed tomography and magnetic resonance are modalities of choice in the evaluation of renal tumour masses, but they have low ability to discriminate the histopathological type [2]. Differentiation of malignant tumour mass – RCC, from oncocytoma or fat-poor AML (angiomyolipoma), which are benign lesions (not requiring surgery), is an important clinical challenge. Another significant clinical challenge is prediction of prognosis of patients diagnosed with RCC. Approximately 30% of patients diagnosed with RCC have metastases, and another 30% undergoing surgery for localised RCC will develop metastases during follow-up [3, 4]. Both in localised and metastatic stages of RCC, scientific societies recommend the use of nomograms, which take into account pathological and clinical data. The most frequently used are Leibovich, UISS, or SSIGN for localised stage, and MSKCC or IMDC for metastatic stage [5]. However, the above nomograms are not sufficiently sensitive and specific. In the era of personalised medicine, more precise diagnostic and prognostic tools are required. Intensive research is currently being carried out on the use of liquid biopsy in uro-oncology practice [6].
Liquid biopsy incorporates the isolation of the molecules secreted by the tumour from body fluids. Various variants of liquid biopsy are available based on the isolation of circulating tumour cells, circulating miRNA, and circulating free DNA (cfDNA), which are released to the bloodstream or other body fluids [7]. The first information confirming the presence of cfDNA in the bloodstream appeared in the 1940s [8]. Thirty years after this discovery, it was proven that the concentration of cfDNA in body fluids is significantly higher in cancer patients than in healthy individuals [9]. The results of several studies show that cfDNA may have diagnostic potential in cancer patients [10]. It has also been proven that the concentration of cfDNA in body fluids correlates with the stage of disease [11]. There are also studies comparing the concentration of cfDNA with the classical oncological markers. In metastatic breast cancer patients, changes of cfDNA concentration in plasma correlated better with changes in tumour burden than did the classical marker CA 15-3 [12]. Numerous studies have also attempted to use cfDNA concentration as a prognostic marker [13–18]. One meta-analysis showed that high cfDNA concentrations in blood were associated with worse cancer-specific survival in stage III and IV of non-small cell lung cancer patients [13]. Similar results were also obtained in studies conducted on other types of cancers [14, 15]. Several studies have shown that the cfDNA concentration changes dynamically depending on the course of the disease [17]. In the case of cancer progression, the cfDNA concentration increases, but during remission it decreases. In one study, it was found that cancer foci with populations of up to 44 million cells are undetectable in conventional imaging studies but may contribute to a significant increase of cfDNA concentration in body fluids [16]. The increase of cfDNA concentration may precede the appearance of a solid tumour before it is visible in imaging studies.
Qualitative analysis of cfDNA can be used in clinical practice as a predictive marker [18]. Specific DNA mutations determine the sensitivity or resistance to a given type of therapy [19]. It has been shown that the presence of mutations within the group of genes characteristic for RCC: PBRM1, BAP1, SETD2, KDM5C, and TP53, may play a predictive role for systemic therapy with the use of vascular endothelial growth factor receptor inhibitors [20]. An important limitation, however, is the method of tumour DNA sampling for the analysis. Taking into account the heterogeneity of RCC tumours, especially at the metastatic stage, performing a classical biopsy of the primary tumour alone may be suboptimal [21]. Moreover, tumour cells may become resistant, which would require repetitive biopsies [22]. Tumour biopsy is also an invasive procedure with possible complications and side effects [23]. Isolation of cfDNA from body fluids has the potential to enable comprehensive tracking and evaluation of specific mutations in a minimally invasive way [24].
Recent studies suggest that the technological advancements in cfDNA assessment allow for the use of cfDNA as a reliable biomarker of cancer diagnosis, potentially permitting an early identification and treatment of RCC [25–30].
The aim of the study was to assess the diagnostic and prognostic role of preoperative cfDNA concentration in the plasma samples of ccRCC patients.
Material and methods
Study population
The study included (n = 46) patients with ccRCC who were admitted to the Department of Urology and Urological Oncology of the Poznań University of Medical Sciences in the years 2018–2019. The study included also (n = 17) healthy individuals constituting the control group (Table 1). All patients and healthy controls provided written informed consent to participate in the study. The medical and clinical data were obtained by anxiety. The exclusion criteria were verified based on medical history and physical examination and included the following: poor general condition (Eastern Cooperative Oncology Group scale > 1), inflammatory disease, autoimmune disease, renal failure, and the presence of other types of cancer. The project was approved by the Regional Committee for Poznań University of Medical Sciences (Resolution No. 568/17).
Table 1
Clinical characteristics of study participants
Material preparation
Sample collection
Before surgery 9 ml of peripheral blood was collected from each patient into tubes containing EDTA. The blood samples were centrifuged at 400 g for 30 minutes at room temperature immediately after transporting to the laboratory to separate the plasma, which was then frozen at –80°C for further analyses.
Isolation of cell free DNA from plasma
Circulating free DNA was isolated from the plasma using the spin-column method with the QIAamp® Circulating Nucleic Acid Kit. Three millilitres of plasma after thawing was centrifuged (14,000 rpm, 10 minutes) at room temperature. AVE buffer in a volume of 25 µl was used to suspend the DNA. The isolated DNA was stored for further analysis at –20°C.
Determination of cell free DNA concentration
Circulating free DNA concentration was determined by real-time polymerase chain reaction (RT-PCR) with primers complementary to the L1PA2 transposon sequence, allowing the amplification of 90 bp fragments. Transposon L1PA2 is a subfamily of LINE sequences (long interspersed nuclear elements) that are located in genomic DNA of nuclear origin. The L1 family accounts for 17% of the human genome [31]. The L1PA2 sequence is interspersed within the genome, so its amplification in RT-PCR enables the measurement of the cfDNA concentration.
Real-time PCR was performed with SYBR green dye (VWR) on CFX96 connect RT-PCR Detection System (BioRad) in 48-well PCR plates (Cytogen). DNA-specific primers were designed by Primer 3 software [32]. The primer sequences of L1PA2 90 were as follows: forward 5'-TGCCGCAATAAACATACGTG-3' and reverse 5'-GACCCAGCCATCCC ATTAC-3'. The standard reaction volume was 10 µl, which consisted of primer mix 1.2 µl, SYBR – 5 µl, water – 1.3 µl, and DNA template – 2.5 µl. Real-time PCR reaction conditions are shown in Table 2.
Table 2
Real-time polymerase chain reaction conditions
| Stage | Number of cycles/stages | Time | Temperature (°C) |
|---|---|---|---|
| Polymerase activation | 1 | 10 min | 95 |
| Denaturation | 1 | 10 s | 95 |
| Annealing, extension | 40 | 60 s | 60 |
| Melt curve | Stage 1 | 15 s | 95 |
| Stage 2 | 15 s | 55 | |
| Stage 3 | 15 s | 95 |
The standard curve was prepared to calculate the concentration of cfDNA in plasma samples. The standard curve was prepared from a sample containing genomic DNA from healthy controls and was established at each RT-PCR in 2 replicates. The concentration of genomic DNA in the sample was determined using the spectrometric method (Nanodrop). A series of 4 dilutions of genomic DNA was prepared at fixed concentrations in the following ratios: 1 : 10, 1 : 100, 1 : 1000, and 1 : 10,000. Standard curve was established at each RT-PCR in 2 replicates. The cycle threshold (Ct) values were used for calculating the cfDNA concentration by absolute quantification through the standard curve.
Each of the plasma samples was analysed in 2 technical replicates. To validate the results, biological replicates were performed on 12 randomly selected patient samples (15% of the tested samples), including re-isolation of cfDNA from plasma and determination of DNA concentration by RT-PCR.
Statistical analysis
Clinicopathological patient data were compared with the χ2 test for categorical data, and with the independent-samples: Student’s t-test or Mann-Whitney U test for continuous data.
The receiver operating characteristic (ROC) analysis for diagnosis, staging, and prognostication of ccRCC by cfDNA concentration were performed. Receiver operating characteristic analysis determined the area under the curve (AUC), while optimal cut-off value, sensitivity, and specificity were calculated by Youden index.
Univariate and multivariate logistic regression analysis were performed to assess the relative contributions of various epidemiological risk factors of RCC (age, gender, body mass index, smoking status, diabetes mellitus status, hypertension status) and plasma cfDNA concentration for the diagnosis of ccRCC.
Survival analyses were performed with Kaplan-Meier method, the log-rank test, and Cox proportional hazards regression. The primary endpoint was cancer-specific survival (CSS).
A p-value < 0.05 was considered significant. SPSS© software (SPSS statistics 25) was used for statistical analysis.
Results
Diagnostic value of plasma cell free DNA concentration
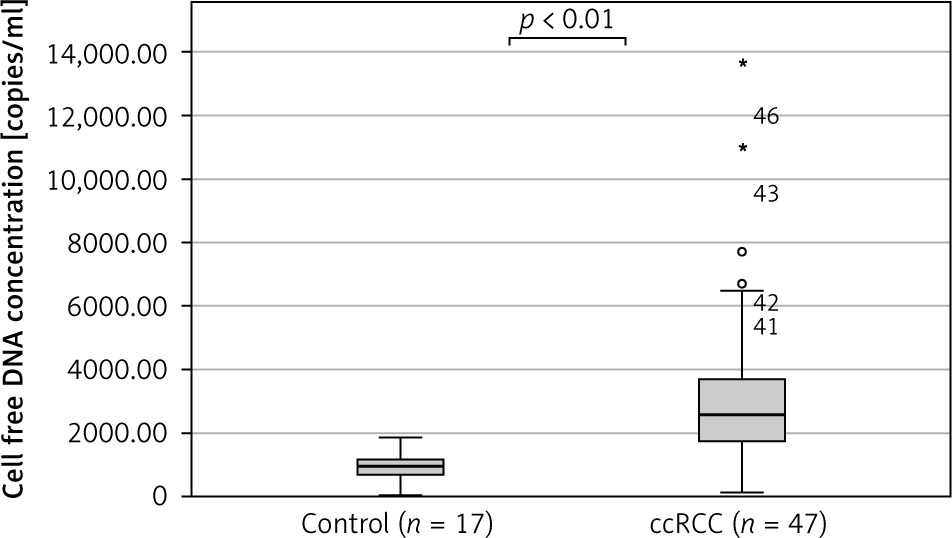
The median cfDNA concentration was significantly higher in ccRCC patients (n = 46) compared to the control group (n = 17) (2588 ±2554 copies/ml vs. 960 ±490 copies/ml, (p < 0.01, Student’s t-test) (Fig. 1). The clinical parameters did not show statistically significant differences between ccRCC patients and the control group (Table 1).
Fig. 1
Comparison of cell free DNA concentration between control group (n = 17) and clear cell renal cell carcinoma patients (n = 47)
ccRCC – clear cell renal cell carcinoma
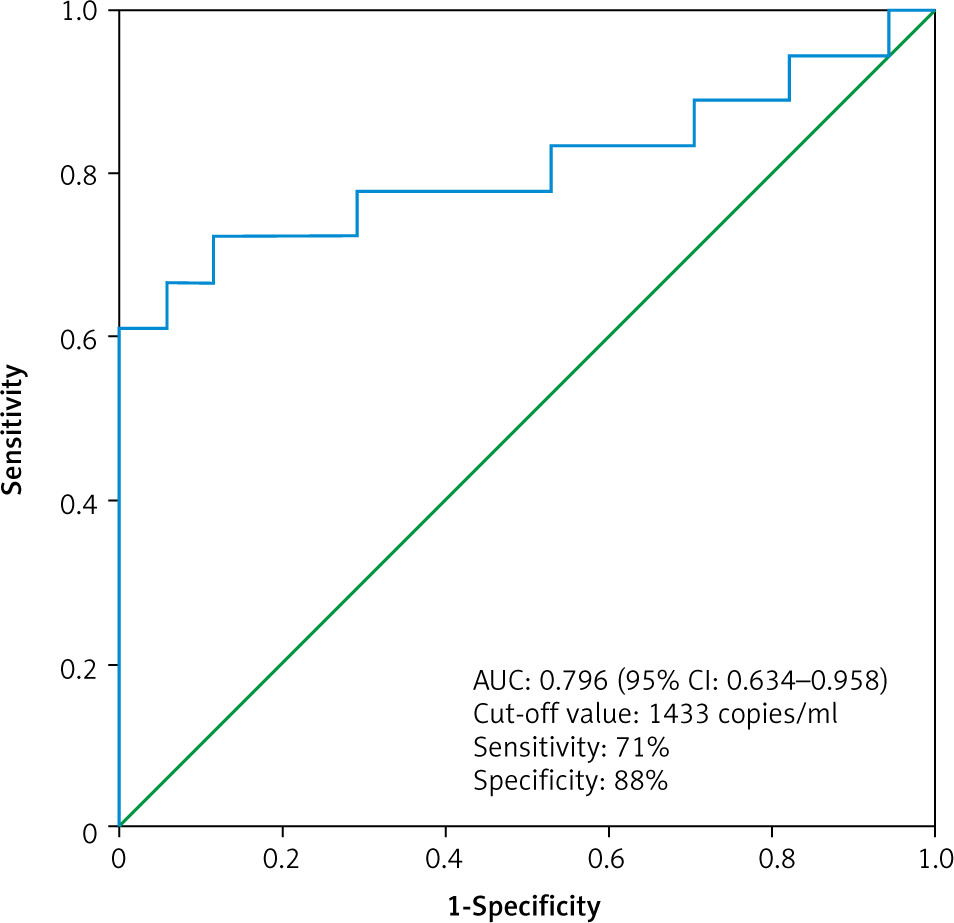
Moreover, we found that the median cfDNA plasma concentration was significantly higher even in patients with low clinical stage ccRCC cT1a (n = 17) compared to the control group (n = 17), (2473 ±1584 copies/ml vs. 960 ±490 copies/ml, p < 0.01 Mann-Whitney U test) (Fig. 2). The circulating free DNA concentration (cut-off value: 1433 copies/ml) was able to distinguish between control group (n = 17) and low clinical stage (cT1a) ccRCC (n = 17) with an estimated AUC of 0.796 (95% CI: 0.634–0.958) (Fig. 3).
Fig. 2
Comparison of cell free DNA concentration between the control group (n = 17) and patients with clear cell renal cell carcinoma clinical stage 1 (n = 17)
ccRCC – clear cell renal cell carcinoma
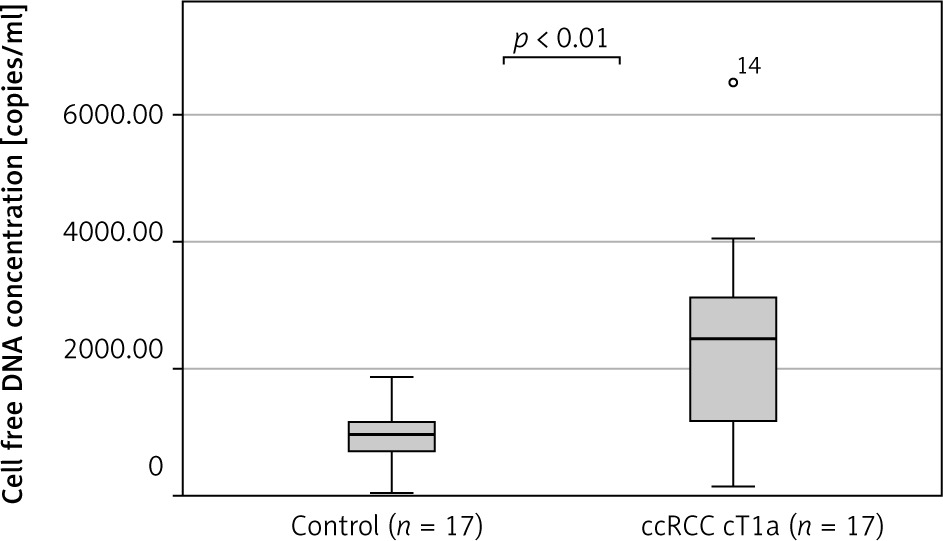
Fig. 3
The receiver operating characteristic curve for the diagnosis of clear cell renal cell carcinoma clinical stage T1a (n = 17) from control (n = 17) using cell free DNA concentration
In the univariate logistic regression model, cfDNA concentration (OR: 1.002; 95% CI: 1.001–1.004), age (OR: 1.061; 95% CI: 1.009–1.115), and body mass index (OR: 1.182; 95% CI: 1.006–1.389) were factors increasing the probability of detecting ccRCC. Multivariate analysis, taking into account only significant parameters from the univariate analysis, found that the preoperative plasma cfDNA concentration was a significant factor increasing the probability of ccRCC detection (OR: 1.003; 95% CI: 1.001–1.005) (Table 3).
Table 3
Univariate and multivariate logistic regression analysis for the detection of clear cell renal cell carcinoma
Impact of clear cell renal cell carcinoma stage and Fuhrman nuclear grade on preoperative cell free DNA concentration
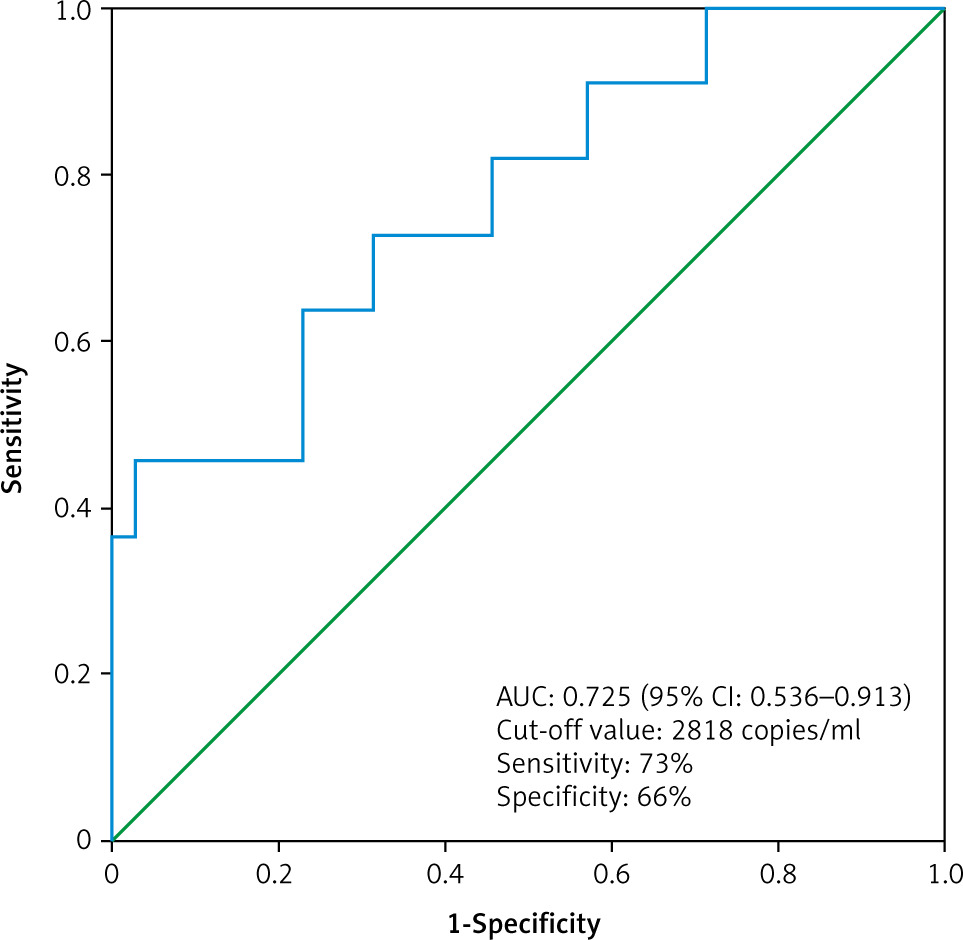
The median cfDNA concentration was significantly higher in metastatic ccRCC patients (n = 11) compared to non-metastatic ccRCC patients (n =35) (3619 ±4059 copies/ml vs. 2473 ±1378 copies/ml, p = 0.03, Mann-Whitney U test) (Fig. 4). The circulating free DNA concentration (cut-off value: 2818 copies/ml) was able to distinguish non-metastatic ccRCC patients (n = 35) from metastatic ccRCC patients (n = 11) with an estimated AUC of 0.725 (95% CI: 0.536–0.913) (Fig. 5).
Fig. 4
Comparison of cell free DNA concentration between nonmetastatic clear cell renal cell carcinoma patients (ccRCC M0, n = 35) and metastatic clear cell renal cell carcinoma patients (ccRCC M1, n = 11)
ccRCC – clear cell renal cell carcinoma
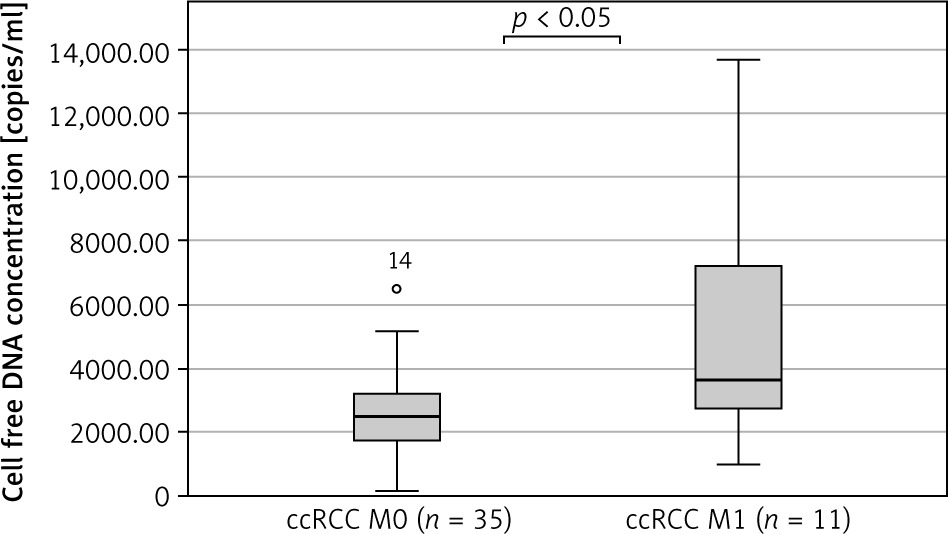
Fig. 5
The receiver operating characteristic curve for the diagnosis of clear cell renal cell carcinoma patient with distant metastases (n = 11) from clear cell renal cell carcinoma patient without distant metastases (n = 35) using cell free DNA concentration
The median cfDNA concentration was higher in ccRCC Fuhrman nuclear grade 3 + 4 patients (n = 18) in comparison to ccRCC Fuhrman nuclear grade 1 + 2 patients (n = 8), (ccRCC metastatic patients excluded) – 2538 ±1137 copies/ml and 1913 ±1653 copies/ml respectively, but the difference was not significant (p = 0.272, Mann-Whitney U test).
Prognostic impact of preoperative plasma cell free DNA concentration on cancer-specific survival
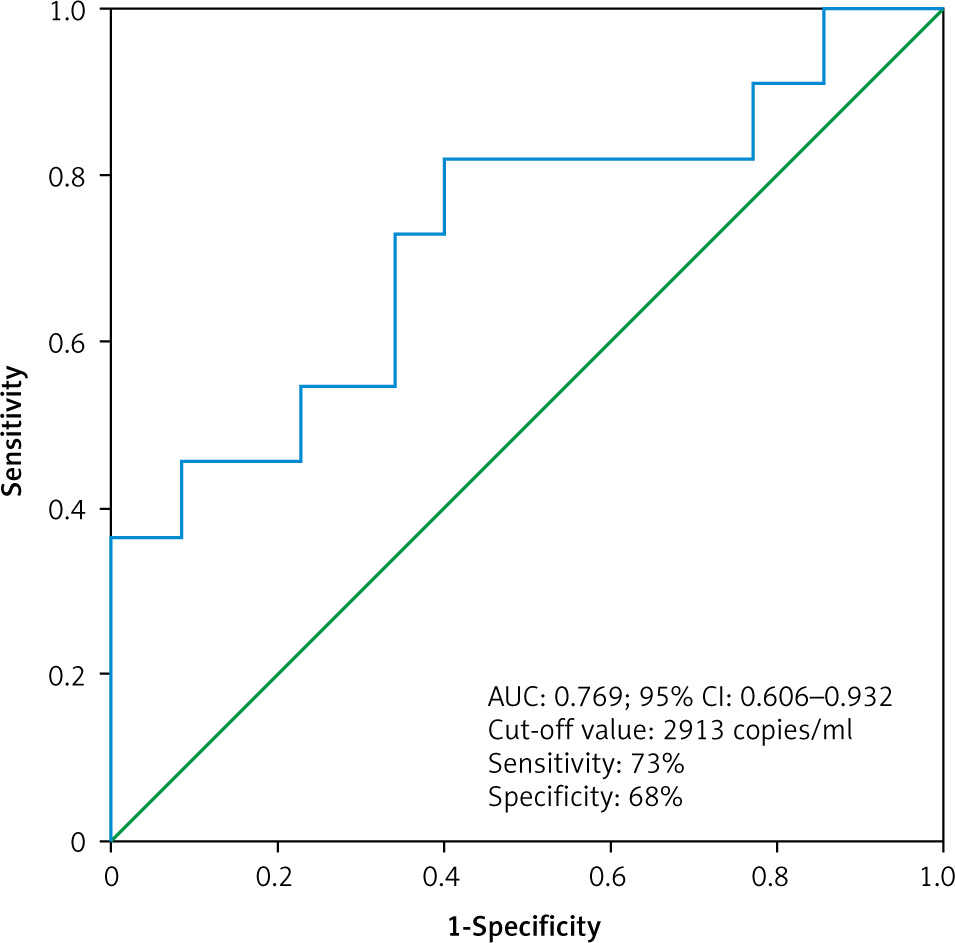
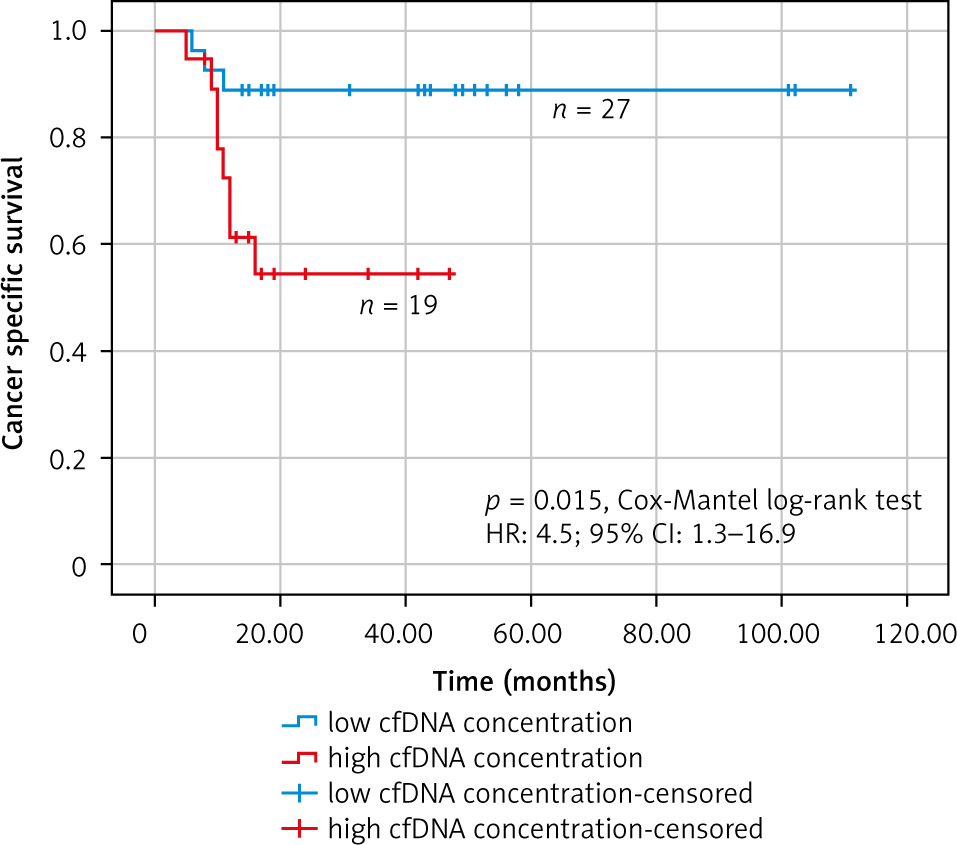
Receiver operating characteristic analysis was used to establish the best cut-off value of the cfDNA concentration that was considered elevated or within the norm in the Kaplan-Meier survival analysis (Fig. 6). The receiver operating characteristic analysis found the best cut-off value of 2913 copies/ml (AUC: 0.769; 95% CI: 0.606–0.932). In the group of patients with high concentration of cfDNA (> 2913 copies/ml) (n = 19), there were 8 deaths (mean follow-up – 30.5 months, 95% CI: 22–39 months), while in the group of patients with low concentration of cfDNA (≤ 2913 copies/ml) (n = 27) there were 3 deaths (mean follow-up – 99.6 months, 95% CI: 87–112 months). The Kaplan-Meier survival analysis found that patients with high cfDNA values (> 2913 copies/ml) had significantly worse cancer-specific survival (HR: 4.5; 95% CI: 1.3–16.9, p = 0.015, Cox-Mantel log-rank test) (Fig. 7).
Discussion
In the current study the plasma cfDNA concentration was evaluated for the following main clinical goals: differentiation between ccRCC patients and healthy individuals, and prediction of prognosis in ccRCC. Our results indicate that the preoperative plasma cfDNA concentration in the ccRCC group was significantly higher in comparison to cfDNA concentration in the healthy group. Moreover, we found that the cfDNA concentration was dependent on the stage of ccRCC (metastatic ccRCC vs. non-metastatic ccRCC). These results are in line with previously published studies [25–30].
Yamamoto et al. assessed the cfDNA concentrations in blood samples before surgery in 92 patients with RCC and in a control group of 41 healthy individuals [25]. The circulating free DNA concentration was significantly higher in the RCC group in comparison to the control group. The sensitivity and specificity of cfDNA concentration to differentiate RCC patients from healthy controls were 63% and 78%, respectively. Between healthy controls and cT1a RCC patients, the sensitivity and specificity of cfDNA concentration was 78% and 58%, respectively. In our study the area under the ROC for cT1a ccRCC was 0.79, while the sensitivity and specificity were 71% and 88%, respectively. These results are consistent with our results and show that the cfDNA concentration is elevated in RCC patients, even at low clinical stages. Similarly, multivariate regression analysis (taking into account the epidemiological factors increasing the risk of RCC) conducted by the authors found that an increasing cfDNA concentration was an independent factor of higher probability of RCC diagnosis.
In study by Wan et al. the cfDNA concentration was assessed in the blood samples of 92 patients with ccRCC before surgery [26]. A significant correlation between cfDNA concentration and TNM stage and Fuhrman nuclear grade was confirmed. In addition, this study found that the cfDNA concentration decreased after surgery, which may indicate that periodic measurement of cfDNA can be used to monitor for disease recurrence.
In study by Feng et al. plasma cfDNA concentration was analysed in 18 patients with metastatic ccRCC during sorafenib therapy [27]. The circulating free DNA concentration before treatment initiation was significantly higher than in the control group of 10 healthy individuals. Significant correlation between cfDNA concentration and TNM stage and Fuhrman nuclear grade was also found. Periodic measurements of cfDNA concentrations were carried out at 6 time points: one week before the beginning of therapy and then on weeks 4, 8, 12, 16, and 24 after its initiation. Circulating free DNA concentration changes were correlated with tumour burden changes (by assessing enhanced computer tomography scans using the RECIST 1.1 criteria), indicating that cfDNA concentration may be used as a biomarker to monitor the real-time response of systemic therapy in metastatic RCC.
In study by Perego et al. the cfDNA concentrations in blood samples was assessed along with the detection of LOH in 54 RCC patients before surgery [28]. This study showed that cfDNA concentration was significantly higher in the RCC group compared to a control group of 41 healthy individuals, but there was no correlation between cfDNA concentration and TNM stage and Fuhrman nuclear grade.
In study by de Martino et al. the cfDNA concentrations in preoperative blood samples from 200 patients undergoing radical nephrectomy were measured [29]. This is the only study in which the control group consisted of 43 patients with benign renal tumours. Moreover, in this study the assessment of the methylation of several genes that are key for carcinogenesis of RCC (RASSF1A, PTGS2, P16, and VHL) was also performed. This study found a significant increase in cfDNA concentration as well as in the methylation of the island region of genes RASSF1A and VHL in the group of RCC patients. Area under curve for cfDNA concentration was 0.755, for methylation of the RASSF1A gene it was 0.705, and for the methylation of VHL gene it was 0.694. The circulating free DNA concentration was also significantly higher in metastatic RCC patients compared to non-metastatic RCC patients.
In study by Skrypkina et al. the cfDNA concentrations were analysed in blood and urine samples collected from 27 RCC patients before surgery and from 15 healthy individuals [30]. This study showed that the cfDNA concentrations were significantly higher in the RCC group compared to the control group. The methylation frequency of the following genes: RASSF1, FHIT, APC, LRRC3B, VHL, ITGA9 was also assessed to obtain the ability to discriminate RCC from healthy individuals. When analysing the methylation of at least 3 genes together, the ability to differentiate RCC patients from healthy individuals reflects the sensitivity of 77.9–92.3%, with specificity ranging 93.3–100%. However, in the performed study the cfDNA concentration was not dependent on TNM stage and Fuhrman nuclear grade.
Few studies have assessed size variations of cfDNA as a potential biomarker in cancer patients [33]. CfDNA released from apoptotic cells is highly fragmented and has a uniform size distribution of 185 to 200 bp because of programmed enzymatic cleavage of DNA. CfDNA released as a result of tumour necrosis circulates in blood in a form of variable and longer fragments (compared to apoptotic cfDNA) due to accidental and incomplete digestion of genomic DNA by various deoxyribonucleases [34]. The cfDNA integrity is the ratio of concentration of longer cfDNA fragments to shorter cfDNA fragments. Three studies found that cfDNA integrity may have diagnostic potential in RCC patients [35–37]. Moreover, the results of these studies indicate that cfDNA in RCC is mainly derived by necrosis.
The above studies indicate that the cfDNA concentration may have diagnostic potential and may differentiate ccRCC/RCC patients from healthy individuals. In our study and in some of the cited studies a relationship between cfDNA concentration and the status of the following parameters: TNM stage and Fuhrman nuclear grade, was also demonstrated. These parameters play an important prognostic role in ccRCC and indicate that cfDNA concentration may also have prognostic application. To verify this hypothesis, we performed a Kaplan- Meier survival analysis, which confirmed that high values of cfDNA concentration (> 2913 copies/ml) have an impact on cancer-specific survival. The prognostic significance of cfDNA concentration was verified by researchers in individual studies [26, 29]. In the previously cited study by de Martino et al. [29] it was shown that high values of cfDNA concentration (> 2400 copies/ml) before surgery had a negative effect on cancer-specific survival (HR: 5.68, p = 0.028). In another cited study by Wan et al. [26] it was demonstrated that high values of cfDNA concentration before surgery and 2 months after surgery had a significant impact on the time to cancer recurrence in localised RCC. In a study by Perego et al. a significant decrease in cfDNA concentration after nephrectomy was demonstra- ted, but finally it did not correlate with the oncological results, i.e. time to radiological recurrence and overall survival [28]. Summarizing, all these results require verification in larger groups of patients and longer follow-up period.
Despite the fact that our study as well as the studies cited in the discussion indicate that cfDNA concentration might be a useful biomarker in RCC patients for various purposes (diagnostic, prognostic, or for monitoring the course of the disease), there are a number of limitations that require comment. RCC is characterised by rich vascularisation, thats why it was assumed that the blood collected from patients would be the best source of cfDNA. Various studies have shown that the process of blood sample processing is crucial [38]. One of the key stages influencing the quality of the material and cfDNA is the pre-analysis phase, related to, among others, collecting the material for testing, storage conditions (temperature, time), and then the preliminary preparation parameters [39–42]. Once the biological material is prepared, the next step is isolation of cfDNA. Plasma, more than serum, is the preferred material because some of the DNA in serum comes from the lysis of white blood cells, which can falsely increase the concentration of cfDNA [43]. Different cfDNA isolation technologies are also available. The most common method is the spin- column method [44]. The choice of the method used to measure cfDNA concentration is also important – in the cited studies it was RT-PCR. It should be also emphasised that this method is imperfect because it measures the total amount of cfDNA in body fluids, i.e. fractions derived from both healthy cells and cancer cells. The selection of a gene for PCR also differs among studies. Another limitation is the fact that the cfDNA concentration may be increased in groups of non-oncological patients with other comorbidities [45]. These include patients after heart attack, after a physical injury, or with systemic diseases [46–48]. The above limitations were considered in the adopted exclusion criteria of our study. However, it should be emphasised that there are several other clinical factors that may still affect the cfDNA concentration, so the reliability and practicality of the test may be significantly reduced.
Conclusions
Patients with ccRCC have significantly higher plasma cfDNA concentrations compared to healthy individuals.
Plasma cfDNA concentrations allow the discrimination of patients with metastatic stage of ccRCC from patients with localised stage of ccRCC.
Increased plasma cfDNA concentrations have a negative impact on cancer-specific survival in ccRCC.


