
Introduction
Hodgkin lymphoma (HL) is an uncommon malignancy involving lymph nodes and the lymphatic system; it represents about 15% of all lymphomas. The diagnosis of HL mostly has 2 peaks: the first peak is between the age of 15 and 30 years; the other peak occurs in adults aged 55 years or older [1]. There are 2 major types of HL: classic HL (CHL) and nodular lymphocyte- predominant HL (NLPHL). Classic HL accounts for 95% while NLPHL accounts for 5% of all HL cases [2].
There is a need to develop a new prognostic factor for HL because about 30% of patients relapse or progress after standard chemotherapy with adria-mycin, bleomycin, vinblastine, and dacarbazine (ABVD). Lymphocytopaenia is a well-known feature of HL, especially in advanced disease. Low absolute lymphocyte count (ALC) is associated with worse outcomes by using different cut-offs. Severe lymphocytopaenia is defined as an ALC of 0.63 109/l, which is one of the 7 independent factors of IPS (International Prognostic Score) for advanced HL [3–5].
The aim of our study is to evaluate the use of the lymphocyte-to-monocyte ratio (LMR) as a predictor of patient outcome and survival, so we can include it as a prognostic value for risk stratification for patients with classical Hodgkin lymphoma.
Material and methods
This prospective cohort study was performed at Medical Oncology Department, Clinical Oncology and Nuclear Medicine Department, Clinical Pathology Department, and Internal Medicine Department, Zagazig University, Egypt. The study was approved by the Ethics Committee from April 2017 to April 2020 (Ethics code: 6717).
Patient selection
We included 92 patients who were diagnosed as Hodgkin lymphoma; all patients were aged 18 years or above with histologically proven HL classic type. Patients were clinically staged according to the Ann Arbor Staging System (stage I and II were defined as early stage, while stage III and IV were defined as advanced stage) [6, 7]. Patients who received any line of chemotherapy before were excluded.
Diagnosis carried out either by Tru-Cut biopsy or excisional biopsy from the suspected lymph node. The lymphocyte-to-monocyte ratio was calculated using automated complete blood cell count (CBC) data obtained before and after 2 cycles of chemotherapy and after completion of first-line chemotherapy by dividing the lymphocyte-to-monocyte count. A Sysmex XN 2000 analyser machine was used for automated CBC. Manual blood film was done regularly for all patients with every visit as an internal regulation in our institute, especially for haematological malignancy patients.
Treatment strategies and follow-up
Patients with early-stage disease received combined modality in the form of chemotherapy and involved field radiotherapy (RT) [8]. Most patients with advanced stage received chemotherapy only. Chemotherapy regimens were in the form of ABVD regimen (doxorubicin, bleomycin, vinblastine, and dacarbazine [9]) or escalated BEACOPP (bleomycin, etoposide, doxorubicin, cyclophosphamide, vincristine, procarbazine, and prednisone) after 2 cycles of ABVD [10]. The radiographic response was assessed according to the response evaluation criteria in solid tumours (RECIST 1.1) [11, 12].
History and physical examination were done every 4 months for the first 2 years then every 6 months until the end of third year. Complete blood cell count, lactate dehydrogenase (LDH), erythrocytic sedimentation rate (ESR), and chemistry profile were done as clinically indicated. Thyroid-stimulating hormone was measured at least one time annually if RT was directed to the neck. Computed tomography (CT) scan of chest, abdomen, and pelvis were done every 4 months for the first 2 years then biannually for the third year [11].
Statistical analysis
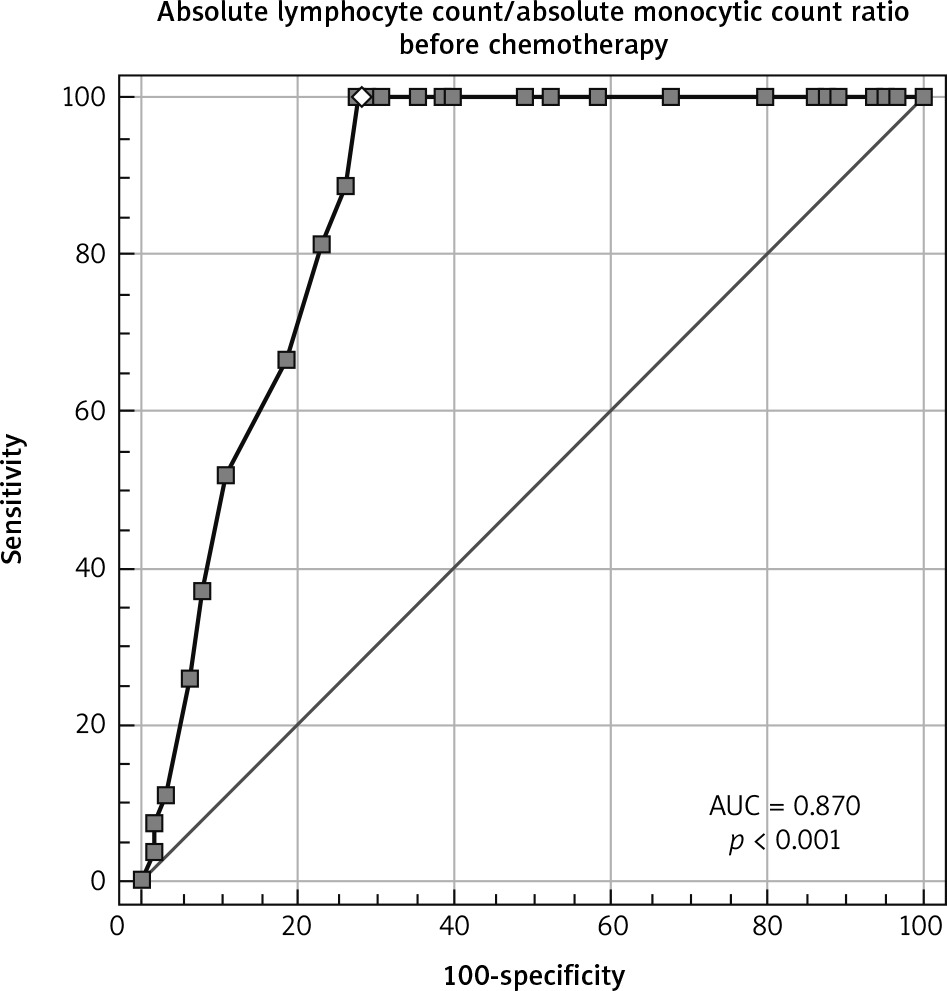
The aim of the study was to determine the influence of the initial LMR on the clinical outcome of HL patients; thus, a receiver operating characteristic curve was constructed to determine the cut-off point of LMR for survival (death/survived) outcome of HL patients. Data were tested for normal distribution using the Shapiro-Wilk test. Categorical covariates were compared using the χ2 or Fisher’s exact test. U Mann-Whitney test was used to calculate the differences between quantitative variables in the 2 groups. The overall survival (OS) was calculated from the time of diagnosis to death or the last follow-up visit (censored); meanwhile, progression-free survival (PFS) was calculated from time of treatment to progression or the most recent follow-up in which patients were progression-free. Overall survival and PFS were calculated by the Kaplan-Meier method; survival curves were compared using the log-rank test. The Cox proportional hazards model was used for univariate analysis. Variables that were statistically significant in the univariate analysis were included in the multivariate Cox proportional hazards model. All tests were two-sided, and a p-value ≤ 0.05 was considered statistically significant. All statistical analyses were performed using Statistical Package for Social Sciences (SPSS 24 Inc., Chicago, IL, USA).
Results
Patients’ characteristics
Patients’ characteristics in relation to LMR at diagnosis after 2 cycles and at the end of chemotherapy are shown in Table 1.
Table 1
Patients’ characteristics at diagnosis and outcomes, correlation with lymphocyte-to-monocyte ratio at baseline, after 2 cycles, and at end of therapy
[i] ABVD – adriamycin, bleomycin, vinblastine, dacarbazine, BEACOPP – bleomycin, etoposide, adriamycin, cyclophosphamide, oncovin, procarbazine, prednisone), CR – complete response, EOT – end of therapy, ESR – erythrocytic sedimentation rate, LDH – lactate dehydrogenase, LMR – lymphocytic monocytic ratio, PD – progressive disease, PR – partial response, SD – stable disease, UNL – upper normal level Significant p-value ≤ 0.05.
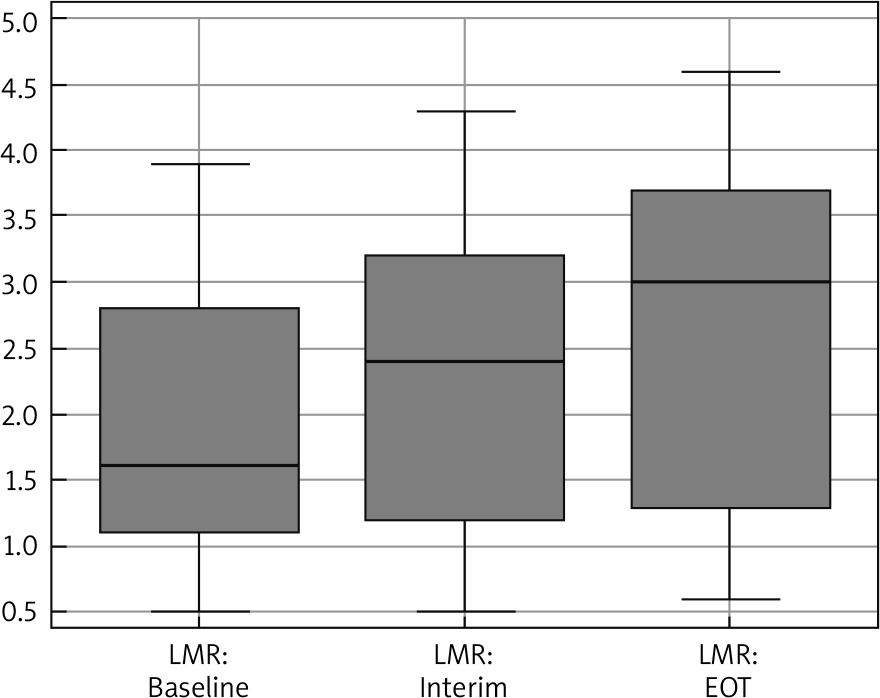
The median age was 31 years (18–63), and 56.5% were males and 43.5% were females. Median range of LMR at diagnosis, after 2 cycles, and at the end of chemotherapy was 1.6 (0.5–3.9), 2.4 (0.5–4.3), and 3 (0.6–4.6), respectively (Fig. 1). Baseline LMR at cut-off ≤ 1.4 had an AUC of 0.87 (95% CI: 0.783–0.931) with a sensitivity of 100% (95% CI: 87.2–100.0%) and specificity of 72.31% (95% CI: 59.8–82.7%) (Fig. 2).
Fig. 1
Box-plot diagram represents the median and range of lymphocyte-to-monocyte (LMR) ratio
Interim – after 2 cycles, EOT – end of therapy
At the time of diagnosis, low LMR < 1.4 was associated with poor prognostic factors: presence of B-symptoms, high LDH, elevated ESR, advanced stage, and poor response to chemotherapy. Moreover, the percentage of deaths was increased in the low-LMR group < 1.4 (60%) in comparison to the high-LMR group > 1.4 (40%); these percentages reflect the relationship between aggressiveness of the disease and low LMR.
We also noted that patients who experienced low LMR < 1.4 after finishing 2 cycles and at the end of chemo-therapy still had poor prognostic factors including presence of B-symptoms, high LDH, elevated ESR, advanced stage, poor response to chemotherapy, and high mortality rate in both groups that had LMR < 1.4 (83.9% and 83.3%, respectively).
Conversion of LMR from low level at diagnosis to high level and its relationship with patients’ characteristics and outcomes are presented in Table 2.
Table 2
Patients’ characteristics at diagnosis and outcomes, correlation with lymphocyte-to-monocyte ratio at baseline, after 2 cycles, and at end of therapy in patients with low baseline lymphocytic monocytic ratio (n = 31)
[i] ABVD – adriamycin, bleomycin, vinblastine, dacarbazine, BEACOPP – bleomycin, etoposide, adriamycin, cyclophosphamide, oncovin, procarbazine, prednisone, CR – complete response, EOT – end of therapy, ESR – erythrocytic sedimentation rate, LDH – lactate dehydrogenase, LMR – lymphocytic monocytic ratio, PD – progressive disease, PR – partial response, SD – stable disease, Sig. – significant, UNL – upper normal level
A total of 31 out of 92 patients still had low baseline LMR < 1.4 after the first 2 cycles and upon completion of chemotherapy, which correlated with poor response to chemotherapy, and high mortality rate; conversely, patients converted from low LMR < 1.4 to higher LMR > 1.4 had better response to treatment and lower mortality rate (p-value < 0.001) for both values.
Patients with LMR < 1.4 at diagnosis had significantly lower PFS and OS than those with LMR > 1.4 (Table 3, Fig. 3 A, B). After completion of 2 cycles of treatment, patients who had LMR < 1.4 had lower PFS and OS in comparison to patients who had LMR > 1.4 (Table 3, Fig. 3 C, D). Furthermore, patients with LMR < 1.4 at the end of chemotherapy cycles had lower PFS and OS than those with LMR > 1.4 (Table 3, Fig. 3 E, F). Consequently, we realized that patients who still had low LMR < 1.4 after the completion of the first 2 cycles of chemotherapy showed lower PFS and OS compared to those who experienced higher LMR > 1.4. After completion of chemotherapy, patients who still presented with LMR < 1.4 had inferior PFS and OS in contrast to patients who gained higher LMR > 1.4 (Table 3, Fig. 4).
Fig. 3
Kaplan-Meier survival curves showed: progression-free survival (PFS) (A), overall survival (OS) at baseline (B), PFS (C), OS after 2 cycles (interim) of chemotherapy (D), PFS (E), OS at the end of chemotherapy (EOT) in relation to lymphocyte-to-monocyte (LMR) ratio (F)
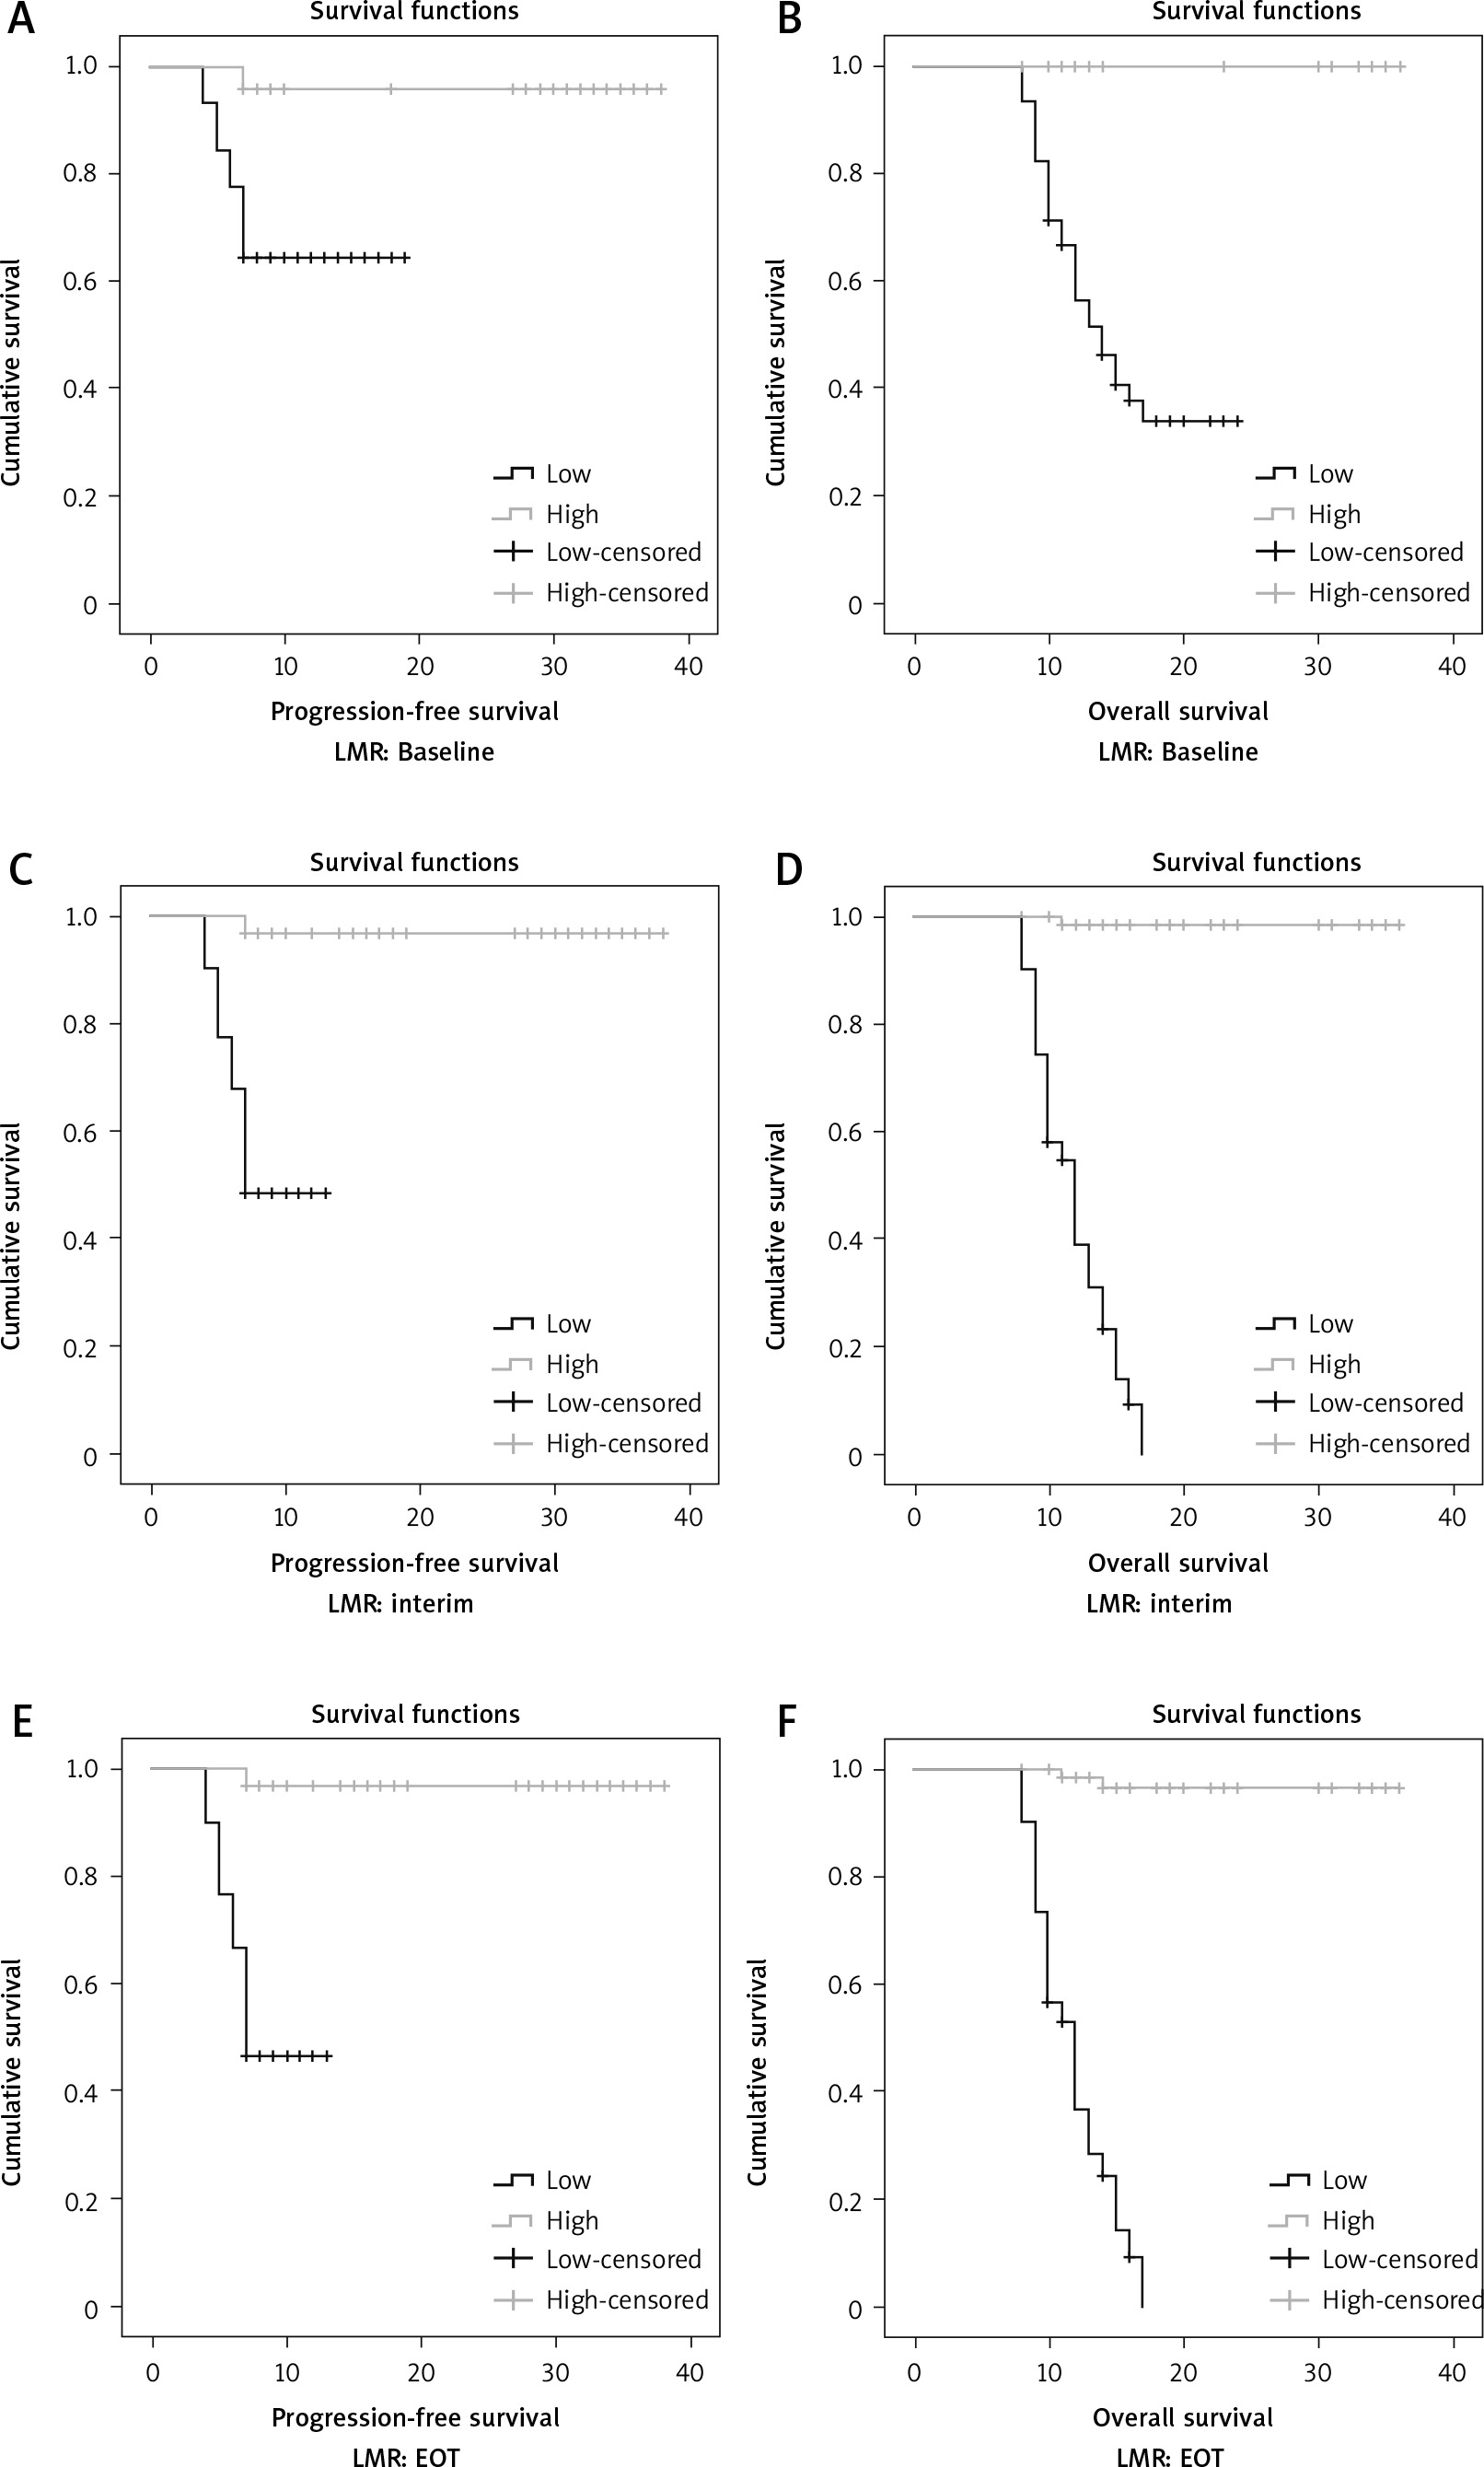
Fig. 4
Kaplan-Meier survival curve showed: comparison of lymphocyte-to-monocyte ratio (LMR) changes after two cycles of chemotherapy in relation to LMR: progression free survival (PFS) (A) and overall survival (OS) (B). Changes at the end of chemotherapy in relation to LMR: PFS (C) and OS (D)
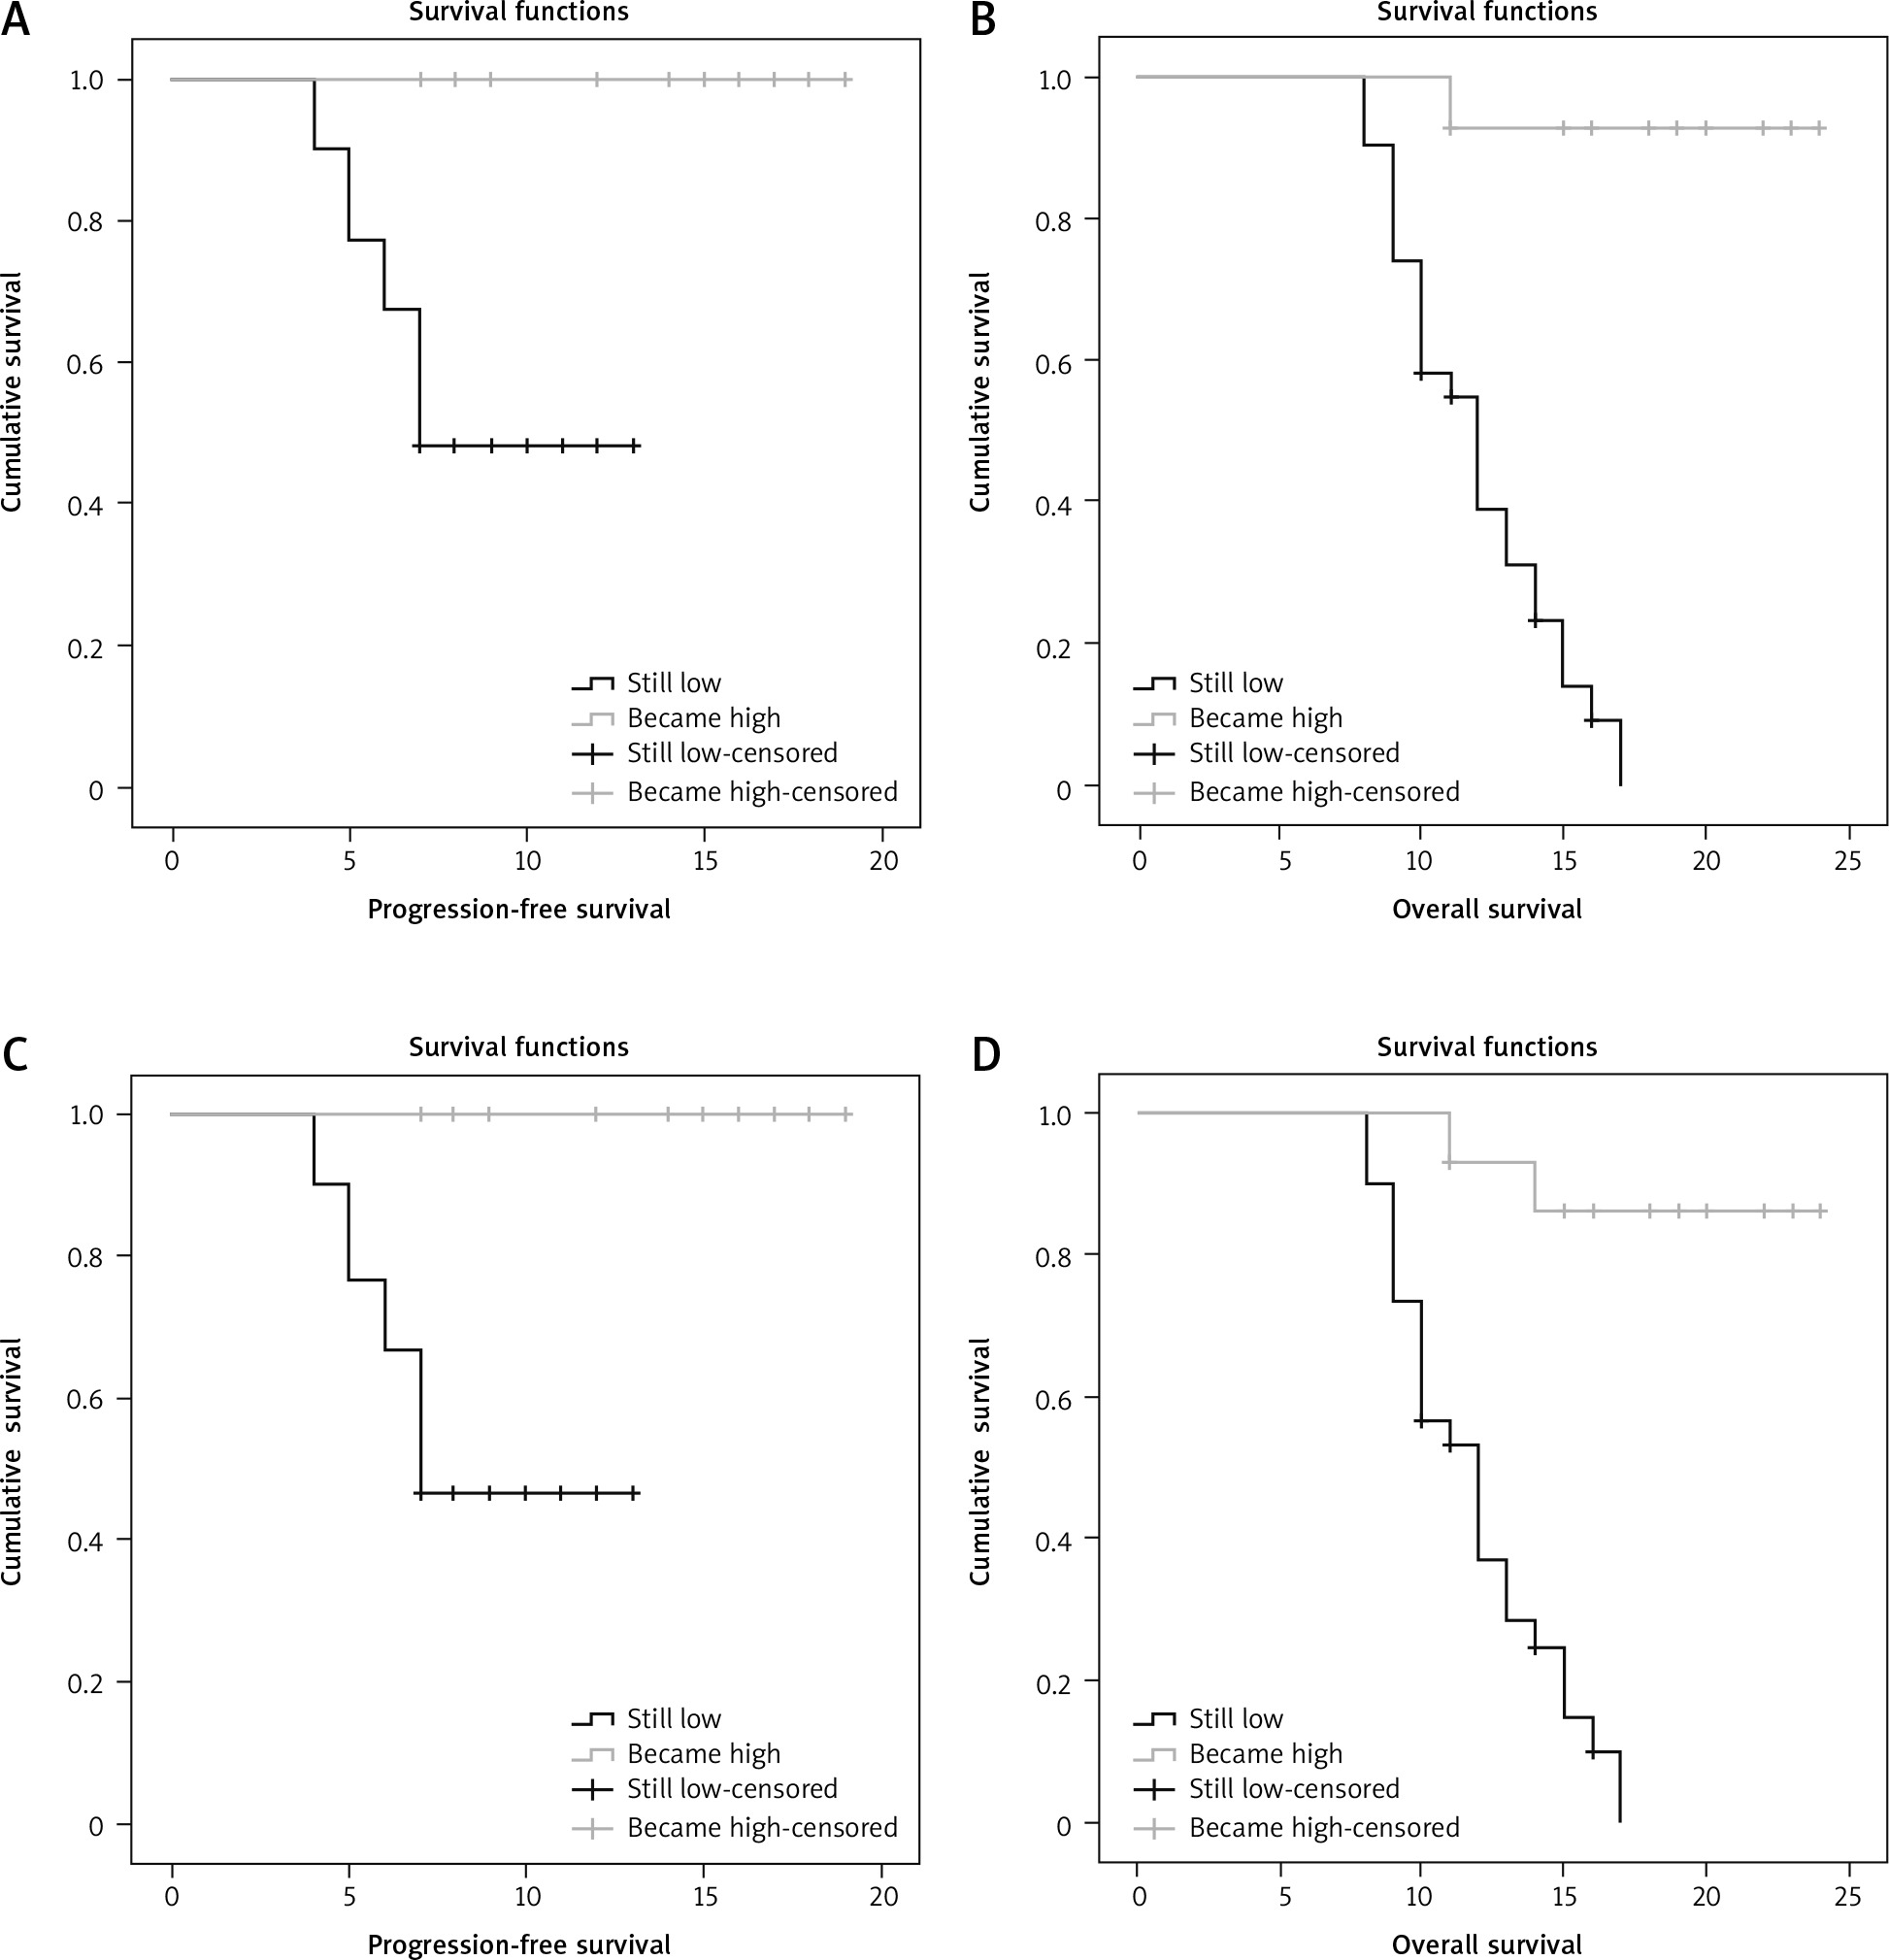
Table 3
Progression-free survival and overall survival in relation to baseline of lymphocytic monocytic ratio at cut-off 1.4
Univariate and multivariate analyses
The impact of the patients’ characteristics, other variables, and low LMR < 1.4 on PFS and OS was evaluated in 92 patients. B-symptoms, LDH, and elevated ESR were associated with poor OS (Tables 4 and 5). Advanced stage, baseline LMR, LMR after 2 cycles of chemotherapy, and LMR at the end of chemotherapy were significantly associated with poor PFS and poor OS in univariate cox regression analysis (Tables 4 and 5).
Table 4
Univariate and multivariate Cox-regression analysis for overall survival in the whole group
[i] ABVD – adriamycin, bleomycin, vinblastine, dacarbazine, BEACOPP – bleomycin, etoposide, adriamycin, cyclophosphamide, oncovin, procarbazine, prednisone, EOT – end of therapy, ESR – erythrocytic sedimentation rate, HR – hazard ratio, LDH – lactate dehydrogenase, LMR – lymphocytic monocytic ratio, NS – not significant, OS – overall survival, Sig. – significance
Table 5
Univariate and multivariate Cox-regression analysis for progression-free survival in the whole group
[i] ABVD – adriamycin, bleomycin, vinblastine, dacarbazine, BEACOPP – bleomycin, etoposide, adriamycin, cyclophosphamide, oncovin, procarbazine, prednisone, ESR – erythrocytic sedimentation rate, EOT – end of therapy, LDH – lactate dehydrogenase, LMR – lymphocytic monocytic ratio, HR – hazard ratio, NS – not significant, PFS – progression-free survival, Sig. – significance
In multivariate analysis of the 92 patients who still had low-baseline, LMR < 1.4 after the first 2 cycles of chemotherapy was an independent prognostic factor for OS; meanwhile, LMR < 1.4 in the 92 patients was an independent prognostic factor for poor PFS after completion of chemotherapy (Tables 4 and 5).
Discussion
The relationship between LMR, patient’s immunity, and tumour microenvironment may reflect the strong association between its prognostic value and the survival outcomes. At the time of diagnosis, low LMR may indicate aggressiveness of the disease and poor response to chemotherapy. Low LMR can result from low lymphocytic count and high monocytic count; lymphopaenia is defined as a lymphocytic count less than 0.6 × 10⁹/l and is known to be prognostic factor for HL [3, 13].
The main aim of our study is to prove the prognostic significance of LMR in patients with classical HL before the start of chemotherapy, after 2 cycles, and at the end of chemotherapy with optimal cut-off value. To our knowledge, this is the first study to assess the response to chemotherapy at the baseline, after 2 cycles, and at the end of treatment, in relation to OS and PFS.
We found that patients with low LMR at diagnosis had significantly lower PFS and OS than those with higher LMR. Interestingly, after completion of 2 cycles of treatment, we found that patients who attained higher LMR had improved PFS and OS in comparison to patients who still had low LMR. Nevertheless, the same findings were observed in the group of patients who achieved high LMR at the end of chemotherapy compared to low level at either baseline or after 2 cycles with an LMR cut-off value of 1.4.
Our results are consistent with the results of Porrata et al., who mentioned that patients with an ALC/AMC (absolute monocytic count) ratio ≥ 1.1 during the treatment at any cycle had better OS and PFS compared to patients with ALC/AMC ratio < 1.1 during all cycles of chemotherapy [14]. Also, they agree with the results of the previous studies that reported that patients in whom ALC recovered during and after treatment of acute lymphoblastic leukaemia [15], acute myelogenous leukaemia [16], and NHL [17] had better prognosis and survival, which denotes that the host immune status might be the incorporated factor that has a direct effect on the survival and prognosis of patients.
In our study, lower LMR < 1.4 at diagnosis was associated with poorer prognostic factors including presence of B-symptoms, high LDH, elevated ESR, advanced stage, and poor response to chemotherapy. This is in accordance with the result of Porrata et al., who informed that ALC/AMC has predictive and prognostic value for high-risk and advanced-stage patients [18].
Several studies were carried out with different cut-off values of LMR to predict the outcome in patients with NHL as mentioned by Tadmor et al. with a cut-off value 2.1 and Li et al. with a cut-off value 3.8 [19, 20], as well as in HL patients with ALC/AMC 1.5 in the Italian study by Sacchi et al. and 2.9 by Koh et al. [21, 22]. Accordingly, to overcome this conflict and the varieties in the cut-off values by different researchers, we compared LMR at diagnosis, after 2 cycles, and at the end of chemotherapy with patients’ outcome and survival instead of a fixed cut-off value. Further research should be done to find a unified cut-off value for the ratio between lymphocyte and monocyte to be engaged in the prognostic factors of HL.
As mentioned in our study, the failure to recover from low LMR after interim chemotherapy and at the end of cycles was associated with inferior outcome and poorer survival. Consequently, further and frequent evaluation of these patients may be required to introduce a more effective treatment to achieve the best response, especially in patients with advanced stages who had a poor response to standard chemotherapy.
A limitation of our study was the small number size of our patients; all patients were allocated from only one centre. Also, PET-CT was not involved as a baseline staging or during the evaluation after chemotherapy cycles.
The novelty and strength of our study is its design as a prospective cohort study, while most other studies are retrospective [18, 23, 24], and it is the first study to assess the relationship between LMR at baseline and the response to chemotherapy after 2 cycles, at the end of treatment, and OS and PFS.
Conclusions
Our cohort prospective study indicates the clinical value of LMR as a prognostic factor for HL. Low LMR at diagnosis and failure of recovery after chemotherapy were associated with poor PFS and OS, especially in patients with advanced stages. The lymphocyte-to-monocyte ratio is an easily accessible biomarker obtained from a routine and low-cost, simple blood test: CBC, which can be included as a part of prognostic score that can be used by clinicians in combination with IPS to predict prognosis and patient outcome.


