
Introduction
Fibroblast growth factor (FGF) receptor (FGFR)-mediated interactions between tumour microenvironment (TME) and breast cancer (BC) cells are well documented in disease progression and response to therapy. In particular, a link between FGFR2 and hormone receptors, first indicated by genome-wide association analysis, was substantiated by a number of mechanistic studies of luminal invasive ductal carcinoma (IDC), whereby FGFR2 activation counteracted ER-dependent signalling and promoted progression towards ER-negative IDC [1]. Despite compelling evidence identifying the molecular mechanism underlying development of resistance to endocrine therapy, cli-nical studies have failed to provide support for the postulated role of FGFR2 in luminal IDC [2, 3]. One of the possible reasons for this discordance is an inability of in vitro models to truly represent the in vivo setting and biolo-gical complexity of the TME. As FGFR signalling is tightly regulated by TME-derived stimuli, it may be that the role of FGFR2, and hence its clinical value in luminal IDC, ought to be analysed in the context of tumour stroma that has the potential to activate or repress FGFR2 function [4]. Increasing evidence indicates that the molecular profile of the stroma in BC has prognostic and predictive value, complementary to the phenotypic markers of the tumour epithelial compartment [5, 6].
FGFR2-mediated signalling is capable of bypassing oestrogen receptor (ER) signal transduction. Consequently, alterations in FGFR2 can significantly diminish the effectiveness of anti-ER treatment [2, 3, 7, 8]. Activation of FGFRs, including FGFR2, is modulated by TME either ‘directly’ by the stroma- derived cognate ligands or ‘indirectly’ by factors that induce paracrine activity of stromal components, primarily the cancer-associated fibroblasts (CAFs), towards FGFR [6, 9–14]. Following a comprehensive review of the lite-rature and differential expression analysis using publicly available data, we have identified a panel of factors characterizing stromal components, predominantly CAFs, with traits indicative of their regulatory effect on FGFR activity, called the “FGFR-related profile of the stroma” [15]. Here, using an in silico analysis, we evaluated the association between such a designed profile of the stroma with prognostic value of FGFR2 in luminal IDC.
Material and methods
Selection of genes interacting with FGFR2 signalling
A detailed literature search for the factors of predomi-nantly stromal origin known to affect FGFR signalling was conducted. An integrative review was performed and PubMed and Medline databases were systematically searched for literature related to FGFR activation. This led to the selection of a panel of 37 factors belonging to six categories: 1) FGFR ligands – FGFs (excluding FGF12, FGF13 and FGF15 due to the lack of sufficient online data) [9], 2) co-factors for FGFR signalling – HSPG2, COL28A1, FBFBP1, AGRN [16, 17], 3) phenotypic markers of CAFs – MCAM, S100A4, PDGFRA [18], 4) factors “indirectly” activating FGFR through either activation of resident fibroblasts or stimulation of transformation of precursor cells into CAFs – CXCL12, CCL2, CCL5, TNFSF11, TGFB1, EGF, PDGFA, PDGFB, HDGF, IL1B, IL6, FAP [19–21], 5) proteinases – ADAM12, MMP14, MMP9 [22–24], and 6) non-canonical stromal factors affecting FGFR signalling – FN-1, COL1A1, COL3A1 [25, 26] (Table 1).
Table 1
List of selected FGFR-related genes, a subset of which, characterised by significantly higher expression (*) in the stroma, was ultimately included in the “FGFR-related profile of the stroma” – marked in red (Supplementary Figure 2)
Differential expression analysis of stromal vs. epithelial tumour compartment
Differential expression (DE) analysis of selected genes was performed using data from Gene Expression Omnibus (GEO) set GSE148398, where laser-capture microdissection (LCM) was used to separate tumour epithelium from stroma in 23 BC samples [27]. Unpaired DE analysis was performed using lima, with p < 0.05 considered signi-ficant (Table 1). Since DE was performed on a selected list of genes, multiple comparisons adjustment was not used. Violin plots were used for visualization (Supplementary Figure 1).
Data collection
RNA sequencing data of BC and the corresponding patient characteristics were obtained from The Cancer Genome Atlas (TCGA, https://portal.gdc.cancer.gov/). RNA sequencing data were downloaded from cBioPortal (https://www.cbioportal.org/) as mRNA expression z-scores relative to all samples (log RNA Seq V2 RSEM) [28]. Clinical and survival data were obtained from a standardized dataset (TCGA Pan-Cancer Clinical Data Resource). All patients included in this study were female and had complete information on PAM50 classification and gene expression [29]. Only ER+ IDC cases, as defined by routine diagnostic immunohistochemical criteria, were included (Table 2, Supplementary Figure 3). To minimize the impact of genomic alterations, cases with documented FGFR amplifications were excluded. The patient selection flowchart is shown in Supplementary Figure 3.
Table 2
Clinicopathological characteristics of the study group. Nominal variables are presented as raw values, and continuous variables are presented as means and percent/standard deviation in parentheses
K-means clustering and hierarchical clustering
K-means clustering was performed based on the standardized expression of genes from the “FGFR-related profile of the stroma” using the function ‘Means’ from scikit-learn version 1.4.1. The optimal number of clusters (k) was determined using the elbow method (Supplementary Figure 4). For visualization, heatmaps with hierarchical clustering were generated using the open source web tool ClustVis.
Statistical analysis
Patients’ characteristics are summarized using the mean and standard deviation (SD) for continuous variables. Nomi-nal variables are presented as numbers with appropriate percentages. The distribution of clinical characteristics was compared between clusters with the χ2 test for categorical variables and with the t-test for continuous variables. A univariable and multivariable analysis of association of expression of FGFR and “FGFR-related profile of the stroma” with OS and DFS were performed using Cox proportional hazards regression models. The assumption of proportional hazards was inspected based on scaled Schoenfeld residuals plots. The prognostic value of the developed signature was evaluated by calculating the Akaike information criterion (AIC) of survival models with or without the signature. P-values < 0.05 were considered statistically significant and all tests were two-sided. The statistical analysis was conducted using R, Statistica 13.3 software by StatSoft (TIBCO Software, Palo Alto, CA, USA).
Results
Design of the FGFR-related profile of the stroma in breast cancer
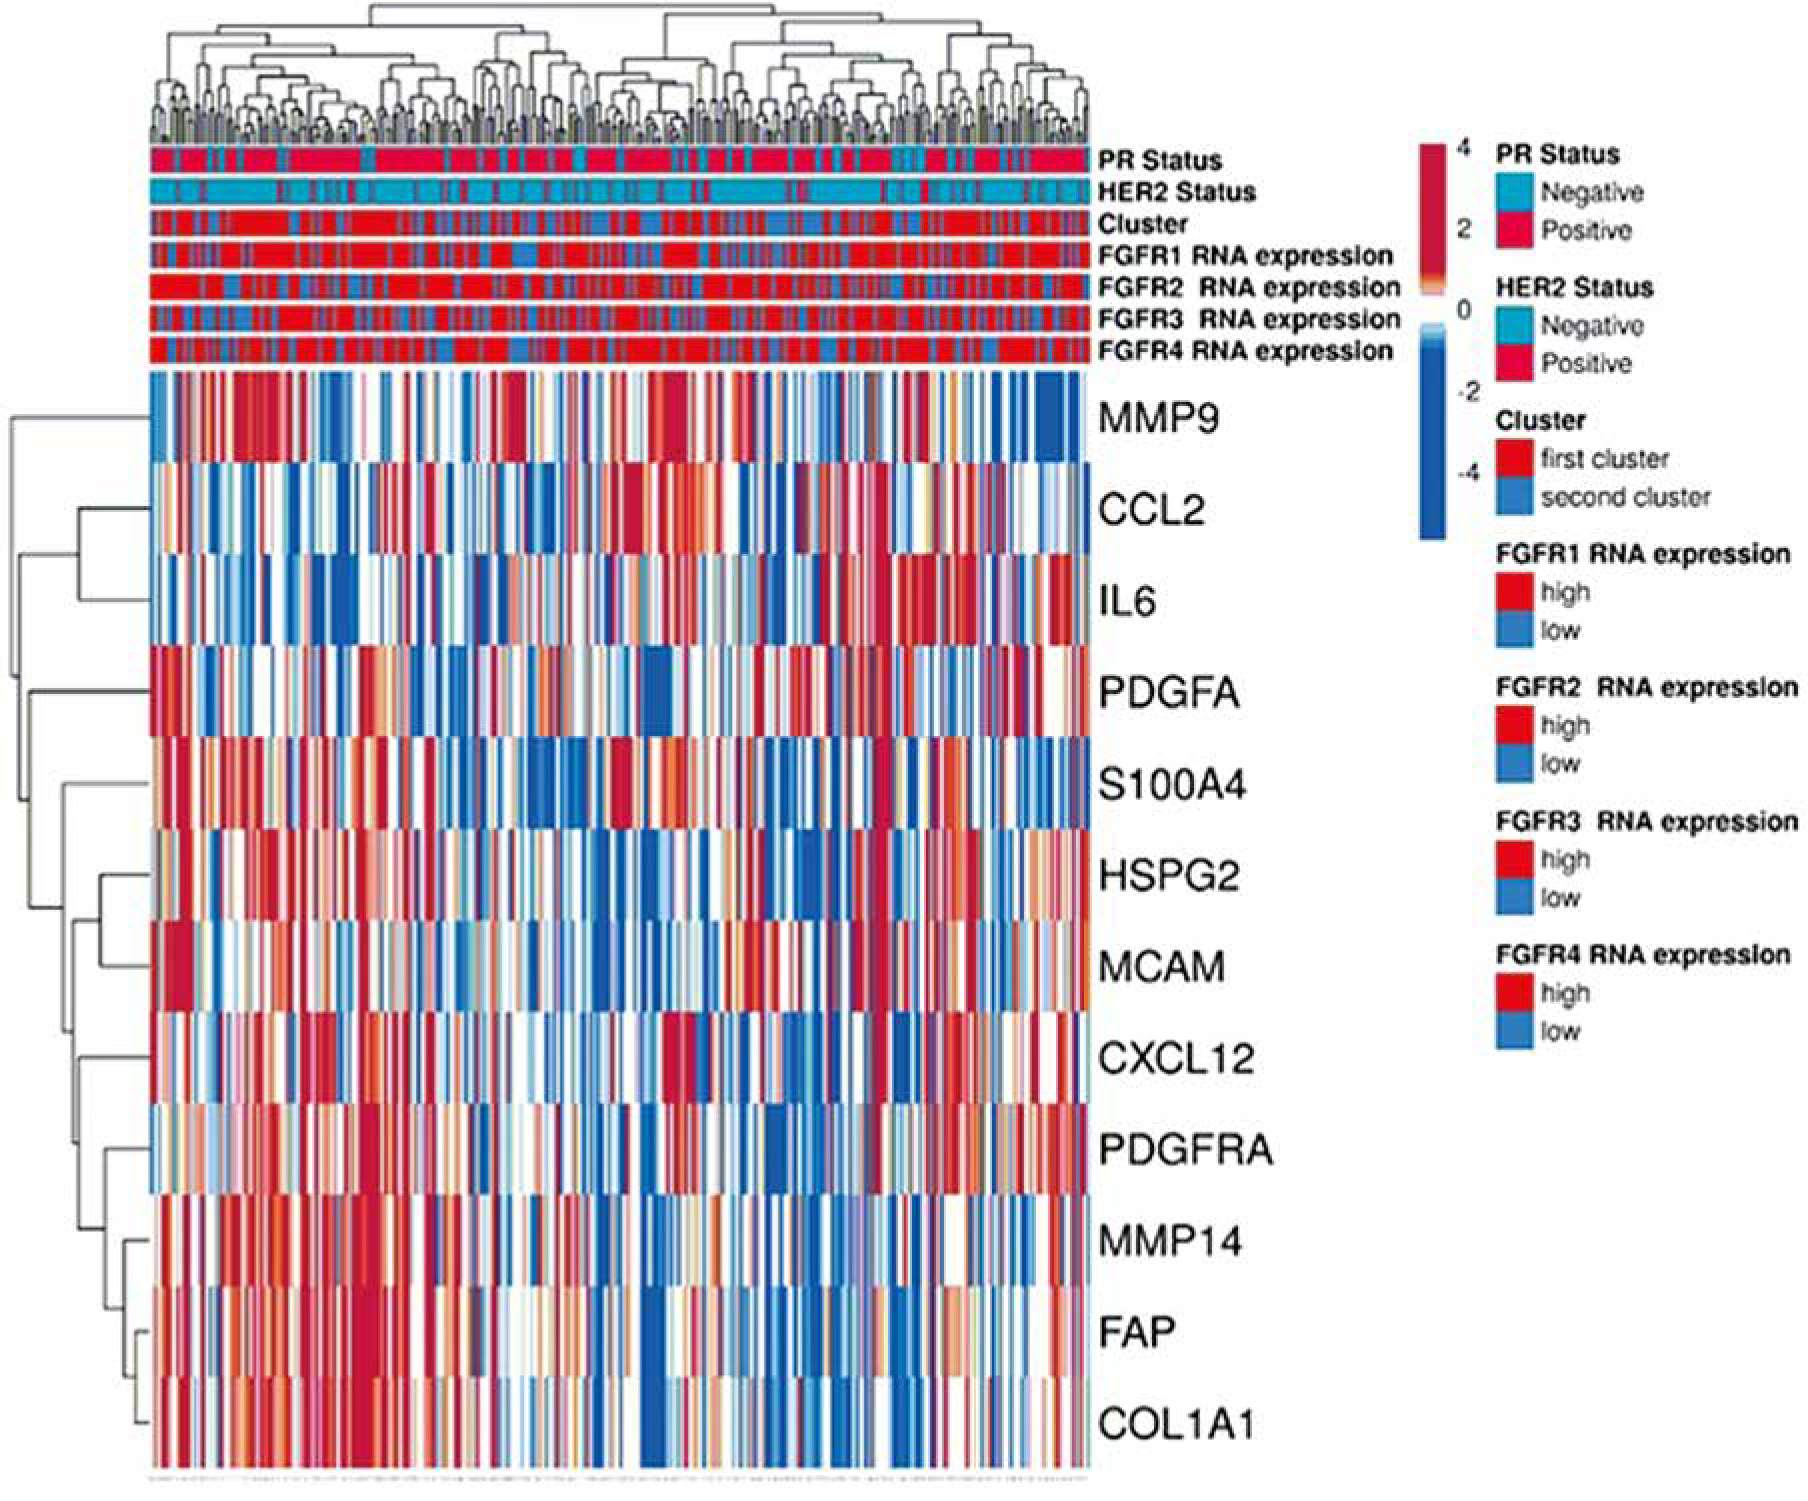
As the TCGA database typically collects gene expression from whole tissue slides including both epithelial and stromal tumour compartments, a differential expression ana-lysis of publicly available data was conducted on a panel of 37 initially selected FGFR-related genes. This enabled identification of those of predominantly stromal origin, thus justifying the interpretation of the in silico findings as a true reflection of the stromal influence on FGFR clinical significance. The analysis of mRNA levels revealed that out of 37 genes, twelve were significantly differently expressed in the stroma than in the tumour epithelial compartment. These included: FAP, CXCL12, PDGFRA, COL1A1, HSPG2, CCL2, MMP14, S100A4, MMP9, PDGFA, MCAM, and IL6 (Table 1, Supplementary Figure 1), collectively called an “FGFR-related profile of the stroma”, which was employed in further analyses. A flow chart presenting selection of the factors adopted for the “FGFR-related profile of the stroma” is presented in Supplementary Figure 2.
Clustering ER+ IDC samples from the TCGA database based on the FGFR-related profile of the stroma
Two hundred fifty-seven BC patients out of 1084 included in the TCGA PanCancer cohort met the inclusion criteria and were included in the study (Supplementary Figure 3). Genes’ mRNA levels of the FGFR-related profile of the stroma were clustered using the k-means clustering method. Based on the elbow method analysis and the provided graph (Supplementary Figure 4), the optimal number of clusters for the given dataset was determined to be two. Expression of all selected genes in the “FGFR-related profile of the stroma” – FAP, CXCL12, PDGFRA, COL1A1, HSPG2, CCL2, MMP14, S100A4, MMP9, PDGFA, MCAM, IL6 – had higher expression in Cluster I compared to Cluster II (p < 0.001 in all cases, Table 2). As a result, 148 cases were assigned to Cluster 1 and 109 to Cluster 2 (Table 2, Figure 1). Both clusters contained a similar percentage of cases positive for HER2 or PR (p = 0.803 and p = 0.669, respectively, Table 2). Cluster I was characterised by a higher frequency of luminal A BC and lower frequency of luminal B, compared to Cluster II (64.9% in Cluster I, 37.6% in Cluster II, p < 0.001; and 19.6% in Cluster I, 50.5% in Cluster II, p < 0.001) (Table 2). Samples from Cluster 1 had significantly higher expression of FGFR1 (p < 0.001), while expression of FGFR2-4 did not significantly differ between the clusters (Table 2, Supplementary Figure 5).
Figure 1
“FGFR-related profile of the stroma” generated using the open source web tool ClustVis. Gene expression was obtained from TCGA from 257 patients with ER-positive IDC. Patients were categorized based on their FGFR1-4 expression status (high-low by tercile), and this categorization was represented in a bar above the heatmap. The heatmap includes the expression levels of the genes selected for the signature
Relationship between cluster assignment and FGFR mRNA prognostic value
A significant interaction was observed only between FGFR2 expression and cluster allocation in multivariable analysis accounting for patient age, cancer stage and tumour PR expression. FGFR2 expression prognostic value was significantly modulated by cluster allocation: in Cluster I, high FGFR2 expression correlated with poor overall survival (OS), whereas in Cluster II, it was associated with favourable OS (p = 0.040, HR (95% CI) 0.39 (0.16–0.96) Figure 2B, Table 3). In univariable analyses FGFR2 mRNA levels did not show any statistically significant effect on either disease-specific survival (DSS) or OS (Supplementary Table 1 and Supplementary Table 2). Moreover, in multivariable analyses, FGFR2 expression was not significantly associated with DSS, when assessed using Cox proportional hazards regression models (Supplementary Table 3).
Table 3
Multivariable Cox proportional hazards model for overall survival (OS) including interactions between FGFR1-4 expression and cluster affiliation
Figure 2
Estimated survival curves showing the prognostic value of FGFR expression in ER-positive breast cancer patients according to patients’ allocation to specific clusters from hierarchical analysis estimated for stage II and PR-positive patients in the Cox regression model. A) Value of FGFR1 expression according to the cluster allocation. B) Value of FGFR2 expression according to the cluster allocation. C) Value of FGFR3 expression according to the cluster allocation. D) Value of FGFR4 expression according to the cluster allocation
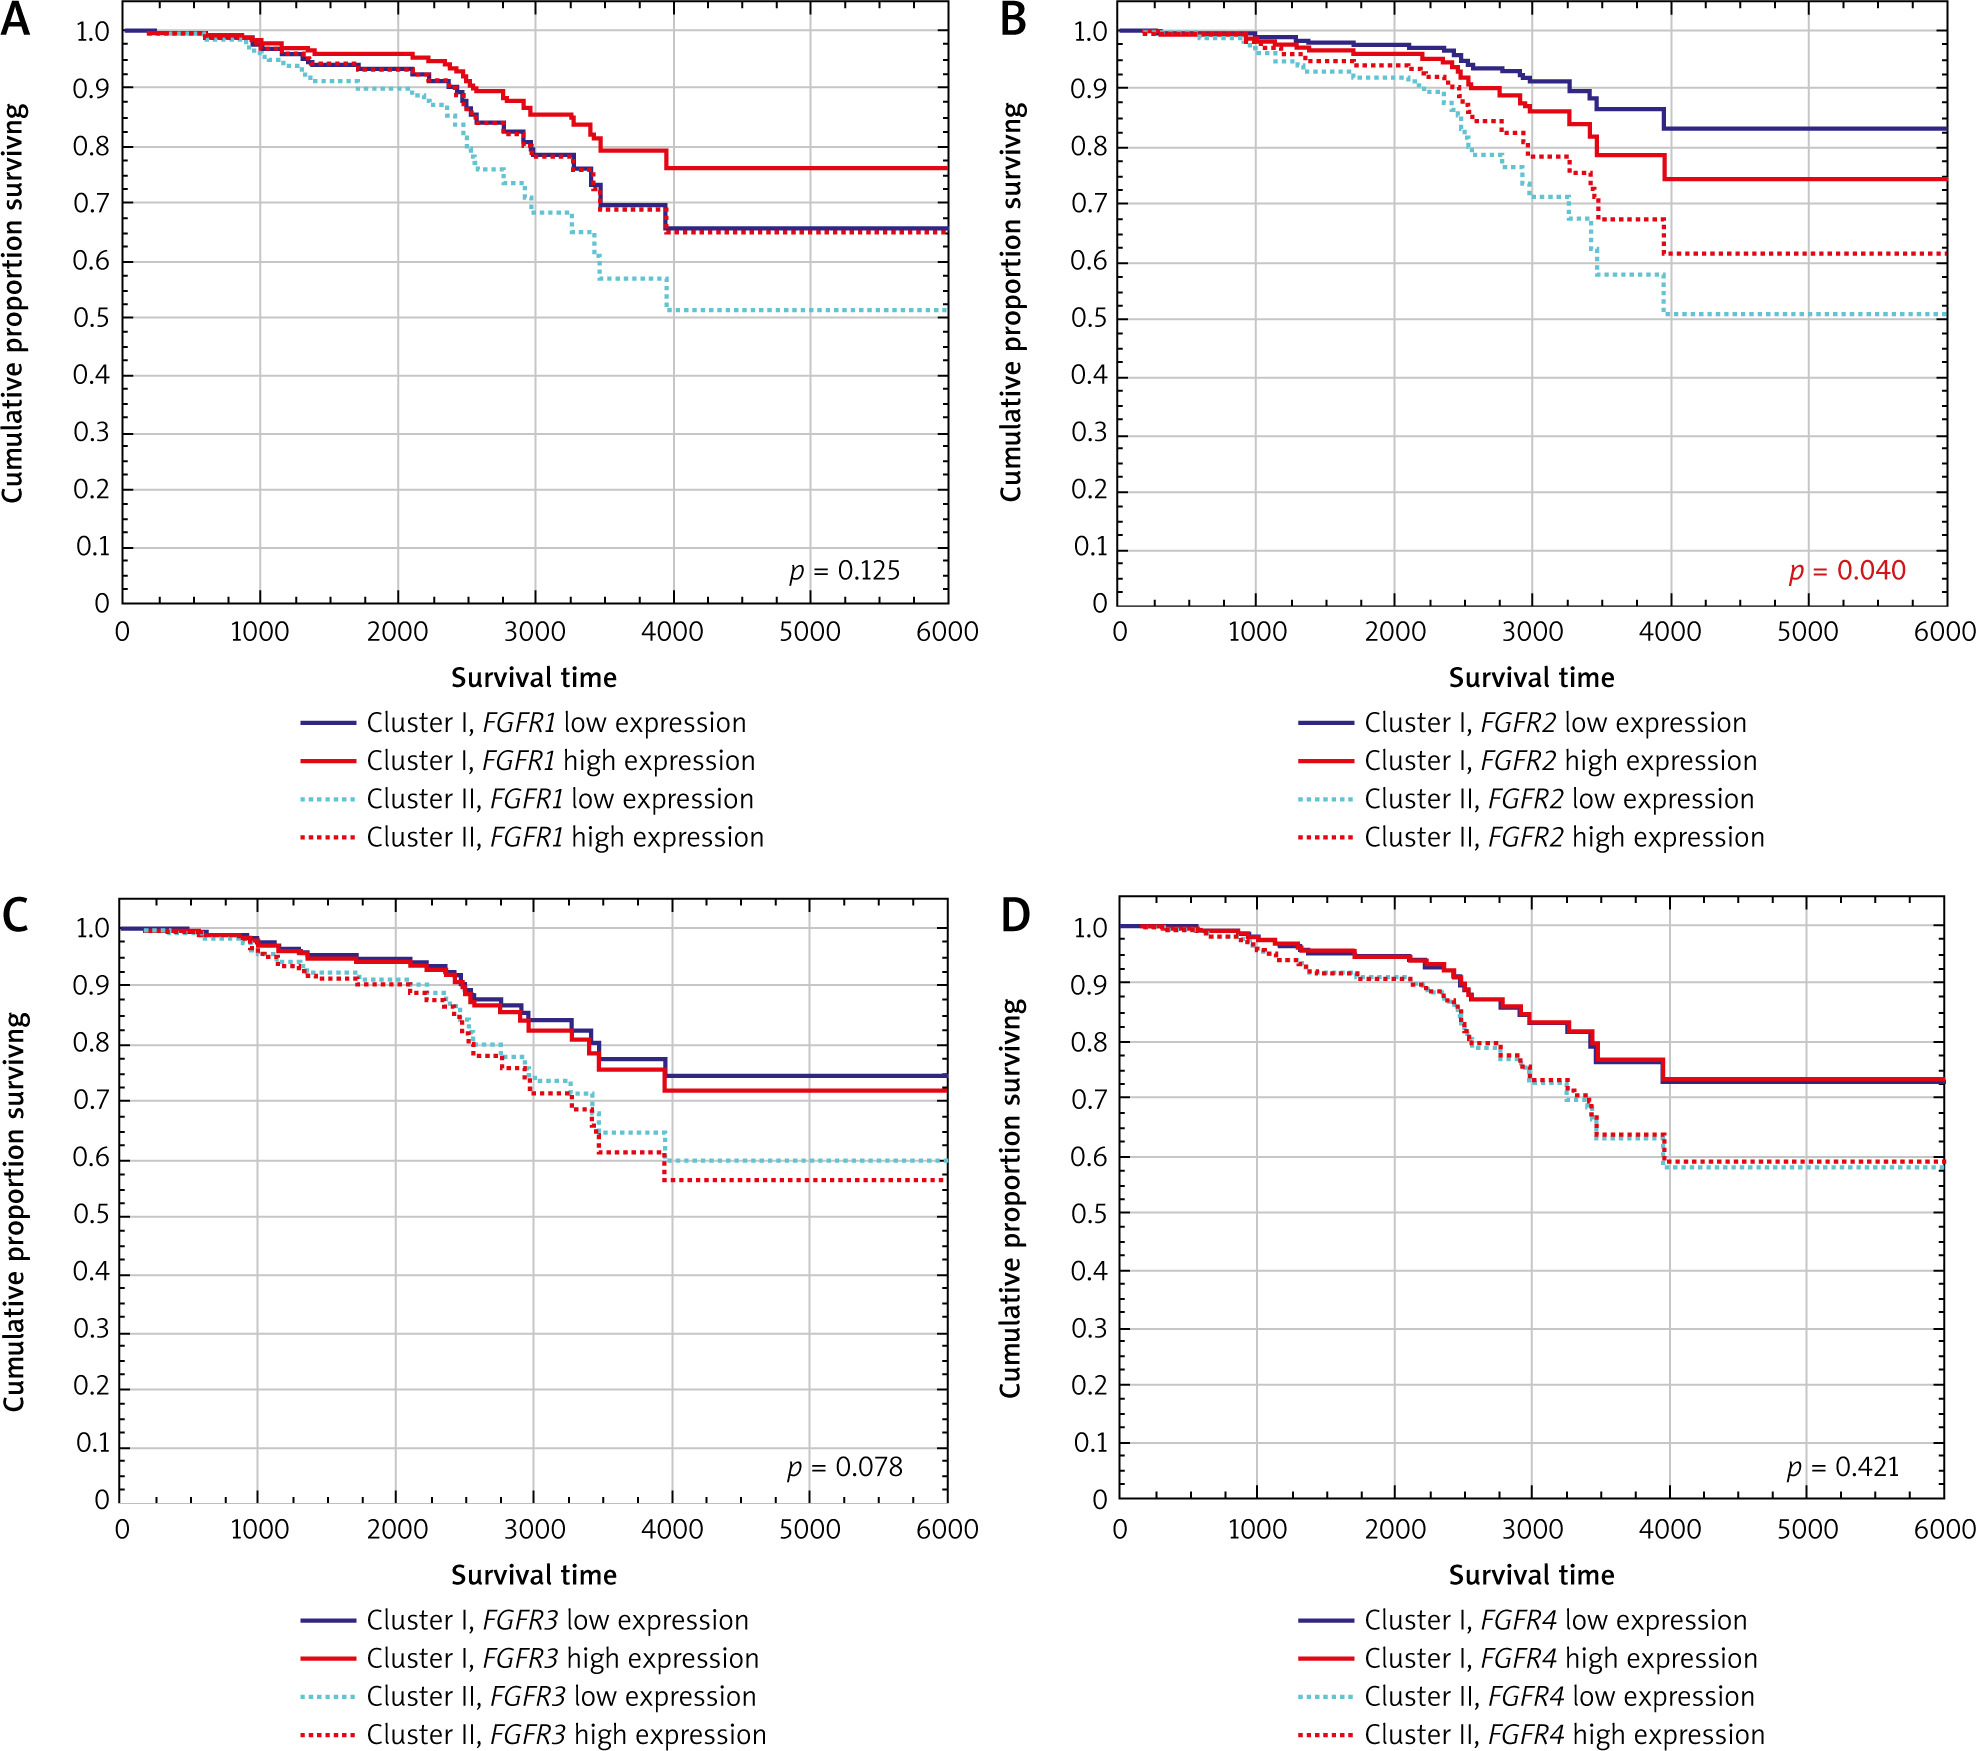
Because of the documented functional redundancy of FGFRs, the relationship between cluster assignment and FGFR1/3/4 was also investigated [30]. The data showed no significant association between FGFR1, FGFR3, and FGFR4 expression and overall survival, either in univariable or in multivariable analyses (after accounting for cluster assignment and clinical variables) (Table 3, Figure 2A, C, D). Univariable analyses also showed that FGFR1/3/4 mRNA levels were of no prognostic value for both DSS and OS (Supplementary Table 1 and Supplementary Table 2). Also, FGFR1/3/4 expression in multivariate analyses were not significantly associated with DSS when assessed using Cox proportional hazards regression models (Supplementary Table 3).
Discussion
In this study, based on literature and in silico analysis, an “FGFR-related profile of the stroma” was proposed, and a significant interaction between cluster allocation and the prognostic value of FGFR2 expression in ER-positive breast carcinoma was observed. In Cluster I, characterized by high expression of all the profile’s genes, high FGFR2 mRNA level was associated with poor prognosis. Conversely, in Cluster II, represented by low expression of those genes, high FGFR2 mRNA was an indicator of favourable prognosis. These findings provide a potential explanation for discrepancies in the prognostic value of FGFR2 in luminal breast cancer demonstrated by previous studies [1, 2, 7, 31, 32].
FGF-FGFR2 signalling is an essential regulator of ER activity, and several non-canonical mechanisms producing different biological outcomes in hormone-dependent BC have already been identified. For example, FGF7-FGFR2- induced activation of MAPK and PI3K (phosphatidylinositol-3-kinase)/AKT leads to ER-Ser167 phosphorylation, which triggers development of resistance to tamoxifen (Figure 3A) [1, 7, 33]. FGFR2 also significantly affects ‘canonical’ interactions of ER with PR [3, 34], whereby, in the presence of both oestradiol and progesterone, PR recruits ER away from the classical ER-binding sites, resulting in activation of a set of genes associated with a good clinical outcome (Figure 3A) [35, 36]. Activation of FGFR2 signalling causes an increase of ER-PR complexes and the recruitment of additional coactivators/transcription factors, such as JunB, affecting ER transcriptional activity and resulting in development of a steroid hormone-independent phenotype (Figure 3B) [1, 34, 37]. Via the non-canonical pathway FGFR2 also affects PR, leading to its phosphorylation and transcriptional activation, independently of progesterone binding [38].
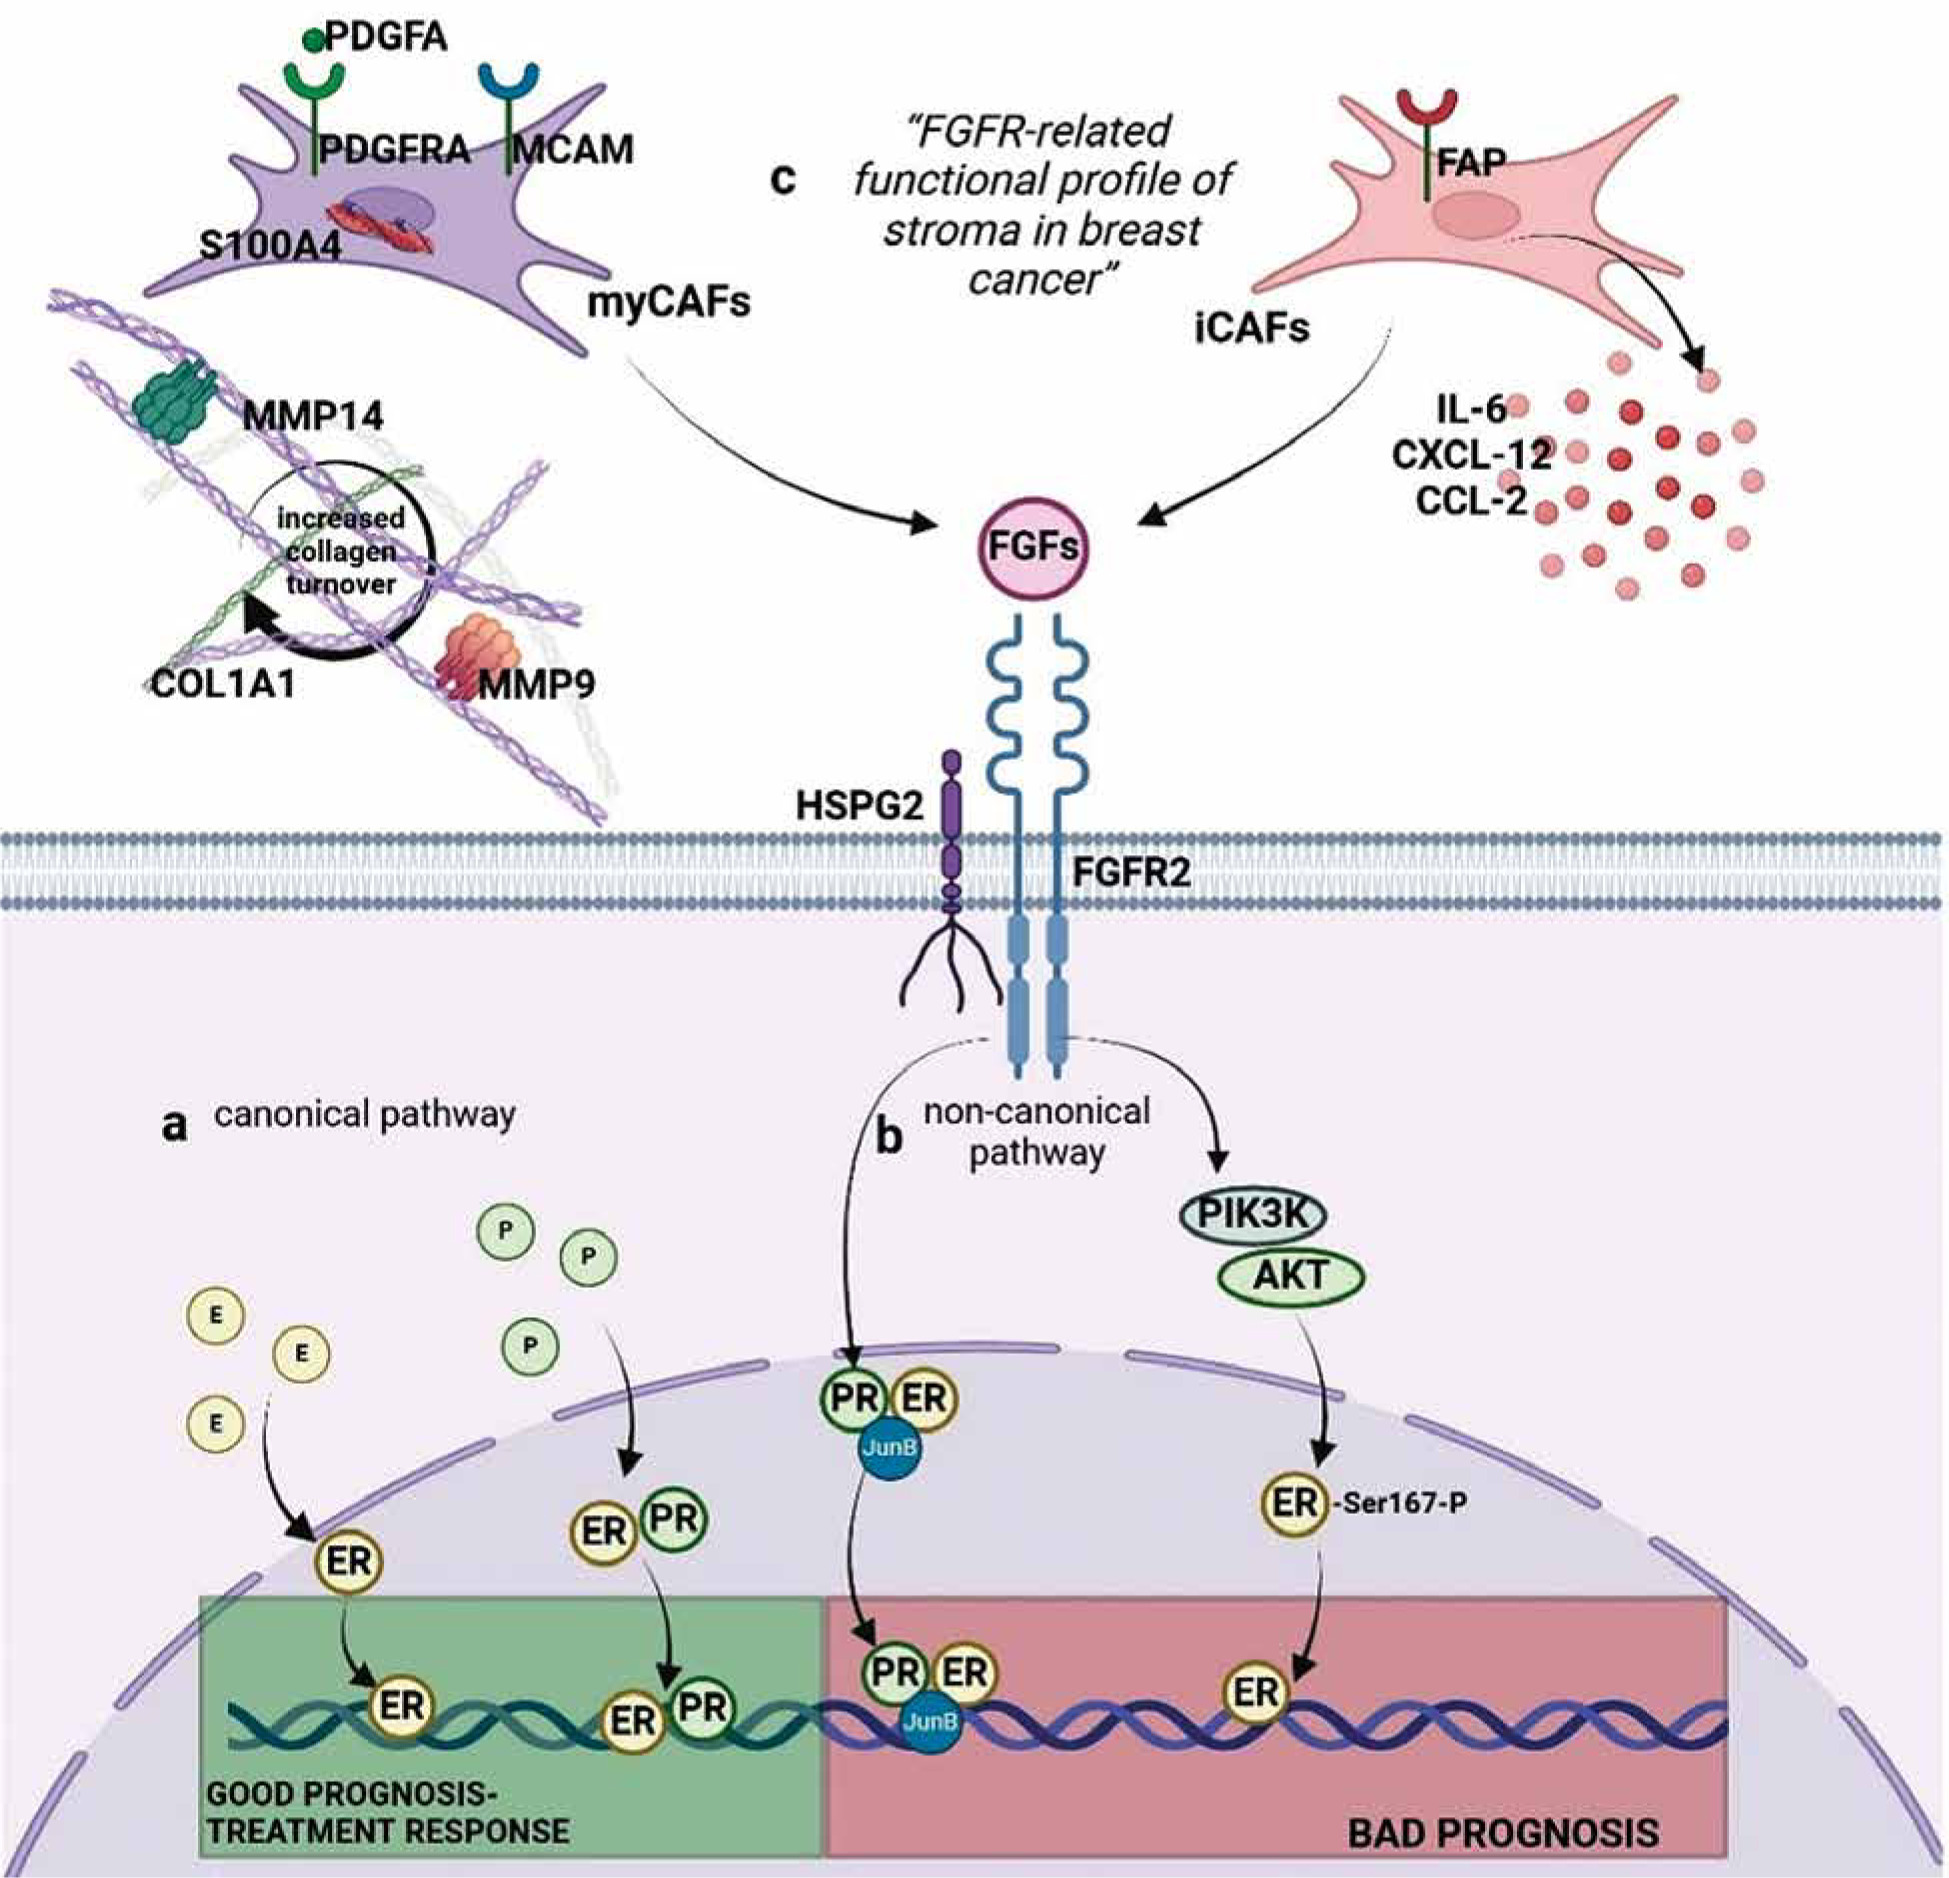
Figure 3
Proposed interaction between factors of the “FGFR-related profile of the stroma” and FGFR2. A) Canonical activation of ER and PR. PR induces PR/ER dimerization and recruits ER away from the classical ER-binding sites associated with good response to treatment. B) Non-canonical activation of ER/PR: FGFR triggers a shift in binding to DNA (through ER/PR/JunB complexes; FGFR stimulates PI3K/AKT activation and induces ER activation. C) Non-canonical activation of ER/PR through FGFR-related profile of the stroma in breast cancer. High expression of markers of iCAFs (FAP, CXCL12, CCL2, IL-6) and markers of myCAFs (PDGFRA, PDGFA, S100A4, MCAM, MMP14, MMP9, COL1A1) as well as presence of cofactor HSPG2 provides favourable conditions for FGFR2 stimulation and non-canonical stimulation of ER/PR. Figure created using biorender.com based on Piasecka et al. 2019 [3]
Despite compelling preclinical evidence of the contribution of FGFR2 signalling to tumour progression and acquisition of tamoxifen resistance, the results of clinical trials with FGFR inhibitors in IDC have been disappointing [39, 40]. Furthermore, analyses of clinical material, including our recent study, demonstrated that, surprisingly, low, not high, expression of FGFR2 was associated with poor prognosis, particularly in ER+PR+ IDC patients [41]. This suggests that the role of FGFR2 is context-dependent and might be affected by various factors, including those stemming from the paracrine activity of the stroma.
In this study, a custom designed “FGFR-related profile of the stroma”, composed of twelve stroma-specific FGFR- related genes, i.e. FAP, CXCL12, PDGFRA, COL1A1, HSPG2, CCL2, MMP14, S100A4, MMP9, PDGFA, MCAM, IL6, made it possible to categorize luminal IDC cases by the prognostic value of FGFR2 into ‘Hot’ (Cluster I) and ‘cold’ IDCs (Cluster II), with high and low expression, respectively, of all the profile’s genes. Besides their regulatory effect on the FGF/FGFR axis, the selected factors play a significant role in shaping biological activity of the stroma. FAP, IL-6, CCL2 and CXCL-2 characterize the inflammatory CAFs (iCAFs), which promote polarization of the microenvironment into the immunosuppressive TME [42–44] (Figure 3C). S100A4, MCAM, PDGFRA, PDGFA are expressed by myo-fibroblast CAFs (myCAFs), which secrete collagen and other extracellular matrix proteins, leading to the formation of a dense stroma, a physical barrier to immune infiltration and immune exclusion [44–46]. A contribution of myCAFs to remodelling of the stroma into a collagen-rich microenvironment is consistent with our finding in Cluster I of high expression of collagen type I alpha 1 chain (COL1A1) and metalloproteinases 9 and 14 (MMP9 and MMP14), known to facilitate FGFR dimerization and its subsequent activation [47] (Figure 3C). Altogether, the association of the designed “FGFR-related profile of the stroma” with specific features of the microenvironment (rich in iCAFs, myCAFs, and cofactor perlecan) may signify that, indeed, as postulated, TME determines biological consequences of FGFR2 activity in ER-positive IDC and may contribute to the the-rapy resistance. This proposed hypothetical molecular scenario is illustrated in Figure 3. Furthermore, the finding that a differential effect on prognostic value between ‘hot’ and ‘cold’ clusters could be demonstrated only for FGFR2 emphasises its unique, among the FGFR family, role in the biology of luminal IDC. This also serves as a possible explanation for conflicting results of the studies assessing the prognostic role of FGFR2 in ER-positive IDC, further implying that poor prognostic value of low expression of FGFR2 mRNA, as recently demonstrated by our group, might refer to a subset of patients with a specific molecular profile of stroma [2].
The results of our study indicate the importance of integrating stromal molecular profiling into clinical practice and indicate the starting point for the experimental studies. Analysis of the stromal molecular profile focused on FGFR-related features may provide new and more reliable criteria for patients who might benefit from the FGFR- targeted therapy. Moreover, in line with current studies, it provides the potential for the development of therapeutic strategies that target both tumour cells and the surrounding environment [48].
However, our study has some limitations. The investigation was based on solely ER+ cases; however, nine of them were classified as basal-like in the PAM50 classification. Such discrepancies between immunohistochemical and PAM50 classification are well described in the literature [49]. The current study relied on IHC-based classification, as it is routinely applied in everyday diagnostics [50]. It is based on in silico analysis; therefore, experimental studies evaluating the protein level of the components of the “FGFR- related profile of the stroma” are required. Moreover, experimental studies in cell lines and animal models are necessary in order to reveal molecular mechanisms underlying the impact of specific stromal components on FGFR2’s function and hence its prognostic value in BC. Additionally, as the quality of public datasets pertaining to the stromal gene expression is limited, further analyses are needed to confirm the specific spatial locations of the selected stromal genes. Nevertheless, our study still provides an important novel reference value for elucidating the specific role of the molecular profile of stroma in breast cancer. The results point to the need for prospective clinical studies to validate the prognostic significance of FGFR2 in different stromal contexts and its applicability in diverse patient populations.
Conclusions
The study demonstrated that stromal molecular profiles may significantly modulate the prognostic value of FGFR2 in breast carcinoma. It highlights the need for comprehensive profiling of the tumour microenvironment to enhance the accuracy of prognostic assessments, a factor that has been ignored in the trials carried out so far worldwide. Additionally, it contributes to resolving previous inconsistencies among FGFR2 prognostic studies and supports the advancement of personalized medicine in breast cancer.


