
Introduction
Life expectancy is increasing all over the world. The population of adults aged 65 and over is growing faster than any other. The incidence of renal cell carcinoma (RCC) increases with age, and the average age at its presentation is about 65 years [1]. In addition, up to 30% of patients present with metastatic disease at the time of initial diagnosis [2], and approximately 20% of patients diagnosed with localized disease will develop metastases [3]. At the beginning of the century, the prognosis of these patients was poor and the average overall survival (OS) was just a few months [4]. Nowadays, thanks to new treatment options such as VEGF-R antagonists, tyrosine kinase inhibitors (TKIs), or checkpoint inhibitors (CPI), the prognosis of metastatic renal cell carcinoma (mRCC) has improved [5].
TKIs are multitargeted inhibitors of receptors for vascular endothelial growth factor, platelet-derived growth factor, and other tyrosine kinases. Currently, TKIs are often combined with CPI to improve the efficiency of treatment. However, detailed analyses showed no significant advantage of combined therapy over sunitinib in the favorable risk group. It should be noted that therapy with TKIs is associated with a lower frequency and severity of adverse events than combined therapy, and it remains the first line treatment when there are contraindications to use CPIs. All these aspects are particularly important in the geriatric population.
Many studies show that age alone does not appreciably affect the efficacy of TKIs or CPI [6, 7]. However, patients over 65 represent approximately 30% of study populations in most pivotal phase 3 trials [8, 9], and there is insufficient research relating toxic effects to patient age [8]. Therefore, it is necessary to study the toxicity in the elderly. A major problem in those patients is the presence of comorbidities and the associated polypharmacy, as only 25% of patients over 65 have no comorbidities [10].
Changes associated with aging are inevitable. The end result is a continuous decline in functional reserve and muscle mass. Drug metabolism in the liver and excretion by the kidneys are also affected [11, 12]. All of these factors may contribute to reduced treatment tolerance and impaired response to the treatment, and may also make patients more susceptible to toxicity.
In order to achieve the most optimal treatment in the geriatric population, it is necessary not only to assess the performance status of patients but also to make a more detailed evaluation of their health condition [13]. The recommendations indicate comprehensive geriatric assessment (CGA) as a tool to help choose the right way to manage geriatric patients, but it is hard to implement it in everyday practice [13]. According to the literature, the G8 geriatric screening tool seems to be a good, quick, and cost-free screening tool that will identify patients who require special supervision [13].
Researchers continue to look for a better scale that could help clinicians predict the prognosis and response to treatment in various cancers [14]. Complex correlations between the immunity of the host and the inflammatory process caused by the tumor play a crucial role in the prognosis of the patient [15]. There are many different types of scales based on immunity cells [14–18]. They are easy to calculate from the complete blood count (CBC), they can be assessed as many times as needed, they are nearly cost-free, and, what is most important, they have the potential to predict the way cancer will progress better than tissue markers, as they take into account not only the immunity of the tumor but also that of the host [16].
The neutrophil-to-lymphocyte ratio (NLR) and the platelet-to-lymphocyte ratio (PLR) are markers that have already been studied in several cancers [14–18], including RCC [18]. Nevertheless, considering only two types of cells is considered insufficient for a deeper evaluation of inflammation and immunity status [18]. Therefore, it was proposed by Fucà et al. to calculate a new prognostic ratio – the pan-immune-inflammation value (PIV) [17] – which, by taking into account four different types of cells [14, 18], broadens the assessment and can lead to more relevant results [14]. The PIV became a new ratio evaluated in survival, progression, or recurrence function in several cancers [14–19], including mRCC [17].
A high body mass index (BMI) is considered a risk factor for developing RCC [20–22], but previous studies have shown that it is also a favorable prognostic factor [23, 24]. In the literature, this situation is described as the “obesity paradox”. While BMI correlates with the amount of adipose tissue, it also correlates with the concentration of anti-angiogenic factors that can inhibit the progression of RCC [25, 26].
In this study, we assessed retrospectively the correlation between the number of points in the G8 screening tool, BMI, PIV, and OS and progression-free survival (PFS) in patients with mRCC treated with TKIs as a first line treatment.
Material and methods
Patient collection
The retrospective analysis included geriatric patients with biopsy-proven metastatic renal clear cell carcinoma undergoing first line treatment at the Department of Genitourinary Oncology of the Maria Skłodowska-Curie Na- tional Research Institute of Oncology in Warsaw. The database contained data of patients with mRCC treated at the department from June 2011 to June 2022. This study was performed in line with the principles of the Declaration of Helsinki. Permission to conduct this study was granted by the Maria Skłodowska-Curie National Research Institute of Oncology Bioethics Committee (permission number 38/2018). The database contained detailed information on age, gender, clinicopathological facts, laboratory results, comorbidities, adverse events, and outcome data associated with individual patients. Clinical data were extracted from medical files and mortality data from the national database.
Inclusion criteria
The study included patients over 65 years of age who were treated with TKIs such as pazopanib or sunitinib. Geriatric patients were eligible for systemic treatment with biopsy-proven metastatic clear cell renal cell carcinoma. The collected data enabled the prediction of risk scores for each individual based on the guidelines of the Interna- tional Metastatic RCC Database Consortium (IMDC) and Memorial Sloan-Kettering Cancer Center [27]. The model classified the patients into three groups: favorable, intermediate, and poor risk. Only patients with favorable and intermediate risk were included in this study, according to the guidelines. However, 3 patients from the poor risk group were included, because they had already exhausted standard treatment options and could benefit from such treatment. Patients with a previous history of cancer or with another additional cancer were not excluded from the study.
Initial dosing was the same for all patients: 800 mg for pazopanib or 50 mg for sunitinib. Dose modifications were based on the Summary of Product Characteristics. Adverse events were assessed in accordance with the Common Terminology Criteria for Adverse Events (CTCAE v4). Data encompassed the date of treatment initiation, administered drug type, drug dose, date of discontinuation of therapy, and the reason for discontinuation.
Data collection
Patients were assessed using the G8 Geriatric Scre- ening Tool, in accordance with its criteria which include: age, food intake and weight loss in the last three months, mobility, neuropsychological condition, BMI, drug intake, and comparison with other people at the same age. The score that every patient could obtain ranged 0–17 points, where the maximum score of 17 points means no impairment. The cut-off value in the G8 geriatric screening tool is 14 [28]. All patients were assessed in a retrospective analysis, which limits the accuracy of classification.
Our data set consisted of patient demographics, laboratory test results (including CBC, corrected calcium, lactate dehydrogenase), treatment delays, treatment duration, and treatment outcomes. The complete blood count was evaluated before starting the course of treatment. Hematology parameters were measured using a Sysmex XN-1000 analyzer. Laboratory tests were carried out by the Diagnostic Department of the National Research Institute of Oncology.
The PIV was calculated with the formula: [neutrophil count × platelet count × monocyte count]/lymphocyte count. Counts of inflammatory cells were taken from laboratory results obtained immediately prior to treatment initiation. The final day of data collection was the 10th of August 2022.
Statistical analysis
Standard tools of descriptive statistics were used to describe the material. OS and PFS were used as the criteria for assessing the effectiveness of treatment. The day of treatment initiation was taken as the start of observation. The date of death or last information that the patient was alive was the end of observation for OS. For PFS, the end of observation was the date of disease progression or, in the absence of progression, the date of the last clinical examination or the date of death. For the analysis of prognostic factors, we used the Cox proportional hazards model, in which, apart from the studied factors – BMI, age, PIV, and G8 geriatric screening tool – the IMDC prognostic index was also taken into account. All variables were analyzed as categorical variables. The IMDC index was divided into two categories (IMDC = 0 and IMDC > 0), the G8 geriatric screening tool into three categories (< 14, 14–15 and > 15), BMI into three categories (in accordance with the WHO classification: normal, overweight, obese), and PIV, to maximize the power of tests, into three equinumerous categories (low-PIV group: £ 269, medium-PIV group: 269–548 and high-PIV group: > 548). The PIV is a new, non-standardized prognostic factor. Therefore studies involving thousands of patients are needed before it can be successfully introduced into risk stratification in clinical practice. To obtain the cutoff values for this study, patients were divided into three equal groups according to their PIV values – low, medium, and high. The cutoff values are the maximum and minimum values of the group with medium PIV. However, the analysis found that patients in the low and medium PIV groups achieved very similar PFS and OS values. In the Kaplan-Meier curves, we presented only two significant groups – low-PIV (low and medium) and high-PIV – so that the range of values is wider and the curves are more readable. In the modeling process, the stepwise backward selection method with inclusion/exclusion levels £ 0.05/> 0.1 was used. The statistical significance level of 0.05 was applied in all tests.
Results
Patients’ characteristics
From June 2011 to June 2022, 138 geriatric patients with mRCC received first line treatment with sunitinib or pazopanib in a routine clinical setting at the Department of Genitourinary Oncology of the Maria Skłodowska- Curie National Research Institute of Oncology in Warsaw. Of these, 45 (33%) were 75 years or older, and 93 (67%) were in the age range 65–75. All of the patients had clear cell histology. The first line treatments were TKIs (sunitinib, pazopanib). The choice of treatment was at the discretion of the treating physician in accordance with national guidelines. The characteristics of the group are presented in Table 1. The median duration of follow-up for surviving patients was 46.6 (95% CI: 17.4–75.8) months.
Table 1
Patients’ characteristics
Efficacy and outcomes
The median OS and PFS from first line therapy initiation were 33.8 months (95% CI: 23.8–47.8) and 19.1 months (95% CI: 15.0–23.3). The parameters of the fitted Cox models for OS and PFS are shown in Table 2. BMI (p = 0.034) and PIV (p < 0.001) were significantly associated with OS, and PIV (p = 0.001) was significantly associated with PFS. The risk of death of obese patients was 57% of the risk of overweight or normal BMI patients.
Table 2
Parameters of the final Cox proportional hazard models for overall survival and progression-free survival
Median OS was 64.7 months (95% CI: 39.7–89.6) and 28.0 months (95% CI: 18.7–37.3) for obese and normal/overweight groups, respectively. Median PFS for obese and normal/overweight groups was not found to be significant (p = 0.072)
Median OS was 19.1 months (95% CI: 9.9–28.4) and 45.8 months (95% CI: 37.6–53.9) for high-PIV (> 548) and lower PIV groups, respectively. Median PFS was 11.8 months (95% CI: 9.2–14.5) and 22.5 months (95% CI: 15.3–29.6) for the high-PIV group and lower PIV groups, respectively. The risk of death for the high-PIV group was 3.4 times higher than for patients with lower PIV values. The corresponding risk of progression for patients with high PIV was 2.2 times higher. The hazard ratio estimates with 95% CIs can be found in Table 2. The OS and PFS curves for the whole group and depending on prognostic factors are presented in Figures 1–3, and the corresponding 3-year probabilities are presented in Table 3.
Fig. 1
Kaplan-Meier curves for overall survival (OS) in the geriatric population according to pan-immune-inflammation value (PIV). Median OS was 19.1 months (95% CI: 9.9–28.4) and 45.8 months (95% CI: 37.6–53.9) for high-PIV and lower-PIV groups, respectively. All of these results were statistically significant (p < 0.001)
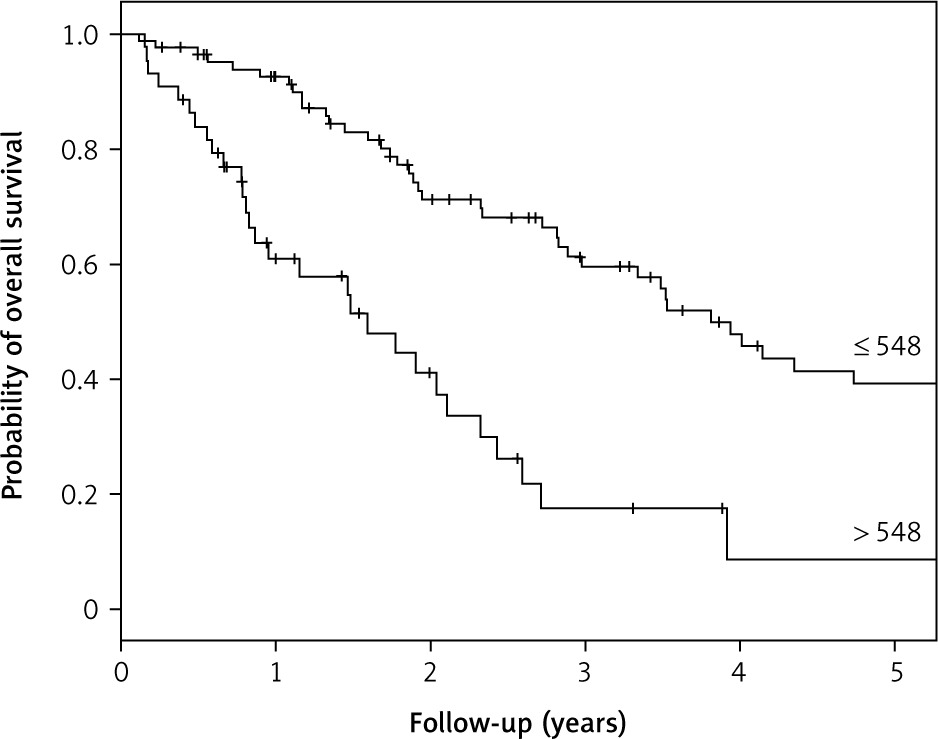
Fig. 2
Kaplan-Meier curves for progression-free survival (PFS) in the geriatric population according to pan-immune-inflammation value (PIV). Median PFS was 11.8 months (95% CI: 9.2–14.5) and 22.5 months (95% CI: 15.3–29.6) for high-PIV group and lower PIV groups, respectively. All these results were statistically significant (p = 0.001)
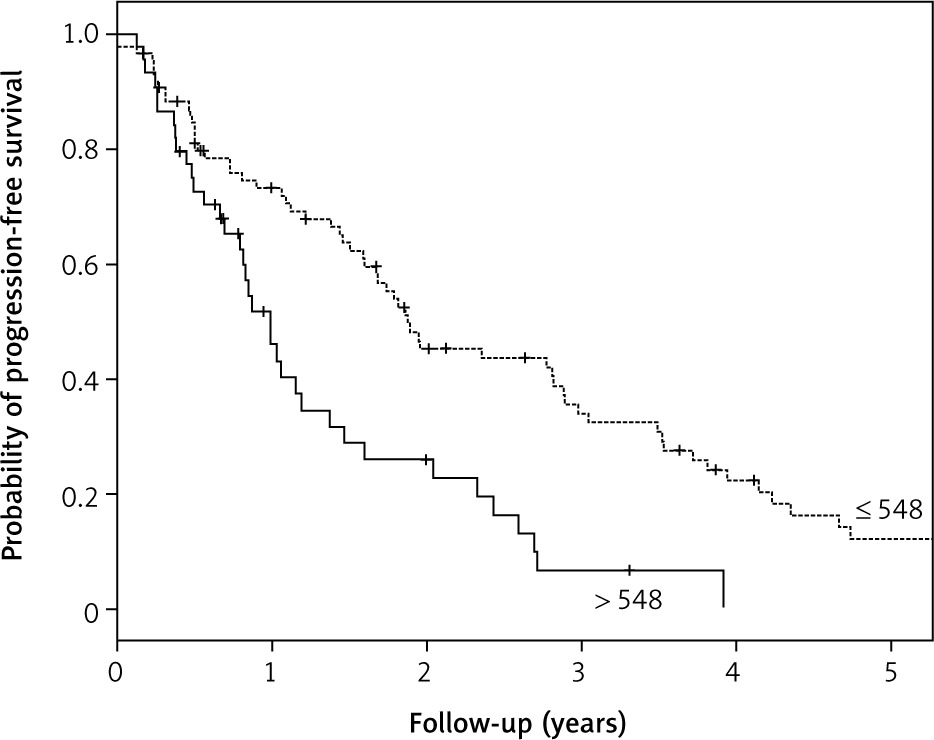
Fig. 3
Kaplan-Meier curves for overall survival (OS) in the geriatric population according to body mass index. Median OS was 65.7 months (95% CI: 39.7–89.6) and 28.0 months (95% CI: 18.7–37.3) for obese and normal/overweight groups, respectively. All these results were statistically significant (p = 0.034)
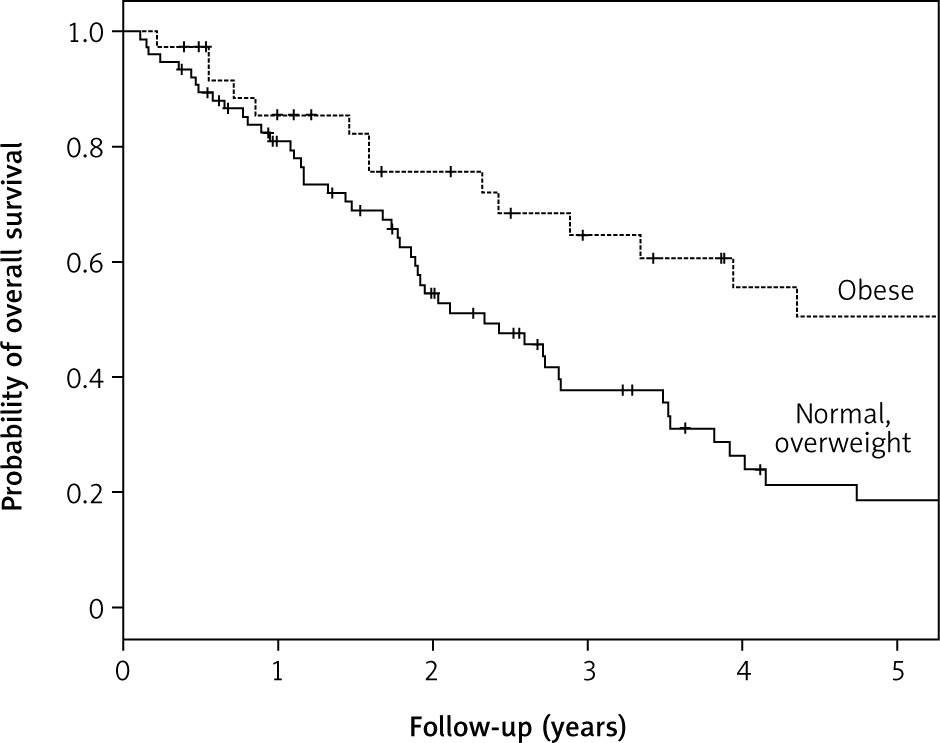
Table 3
Three-year survival for overall survival and progression-free survival Kaplan-Meier curves
No correlation was found between the G8 score and OS or PFS in any of the performed tests.
Discussion
In the geriatric population the subjective impression of performance status may be insufficient to evaluate the patient well, and cases of inappropriate selection of treatment can happen [13]. Hence, it is recommended to make a CGA before the introduction of any type of therapy [29], but it takes a long time to do it properly and demands someone well prepared to interpret it [13]. Therefore, in several studies, researchers have evaluated the usefulness of different scores as tools that could help to make everyday predictions of the benefits of the oncological treatment easier [30]. The G8 geriatric screening tool is a short, eight-question scale that can be administered by clinicians in a short time and helps not only to identify patients who will further need the general CGA but can also be a strong predictor of the OS in patients with cancer [30]. Therefore in this study, we assessed the correlation between the results from assessment in the G8 geriatric screening tool that our patients obtained and their OS and PFS. However, no statistically significant correlations were found.
Inflammatory cells contribute to the promotion of tumor progression [31, 32]. Considering this, researchers established ratios such as NLR or PLR and proved their prognostic effectiveness in cancer, including RCC [18], in several studies [14]. Nevertheless, the other inflammatory cells also participate in this complex process of tumor promotion, so it was proposed to create a more complex scale that would take into account more variables [14]. The PIV is perceived as a more comprehensive scale, as it contains more elements responsible for immune actions in different ways [15].
The first assessment of PIV as a prognostic factor was made by Fucà et al., who confirmed its prognostic value in patients with metastatic colorectal cancer treated with combined chemotherapy with biological agents (anti- VEGFR or anti-EGFR) [17]. The patients who belonged to the low-PIV group had a significantly better OS than those in the high-PIV group (cut-off point: 390) [17]. Moreover, they proved that PIV, which takes into account tumor-promoting and tumor-fighting cells altogether, is more relevant as a prognostic factor in OS than any other previously analyzed algorithm (NLR, PLT MONO, SII) [17].
Recently PIV started to be an object of study in different types of tumors such as small cell lung cancer (SCLC) [15], head and neck squamous cell carcinoma [16], RCC [18], and esophageal cancer [19]. All these studies confirmed the results of Fucà et al. that patients in the high-PIV group with a cut-off point specific for the investigated type of cancer had lower OS [15–19]. Studies by Zeng et al. and Yekedüz et al. were also consistent with the finding of Fucà et al. that the high-PIV group had lower PFS [15–18]. Zeng et al. proved the relevance of PIV as a prognostic factor in patients with SCLC treated with anti-PD1/PD-L1 inhibitors, used also in the treatment of the RCC, together with chemotherapy [15]. Baba et al. assessed the correlation of PIV combined with other variables such as BMI or age and also confirmed their lack of influence on PIV [19]. Moreover, they analyzed local tumor immunity (tumor-infiltrating lymphocytes – TIL) and found that strong TIL status correlated with lower PIV, which suggests the idea of systemic and local immunological correlations and may potentially lead to prediction of an immune CPI response in cancer [19]. Gambichler et al. studied PIV both in a healthy population and in patients diagnosed with Merkel cell carci- noma (MCC). Their study showed that higher PIV was present in an advanced stage of the illness and led to an increased risk of MCC recurrence [14].
The first study about PIV in patients with mRCC was performed in 2022 [18]. As in other research, the authors established two different groups of patients in terms of PIV level (high-PIV and low-PIV groups) by choosing a cut-off value of 372, specific for their study, and found that in patients with mRCC higher PIV level correlates with shorter OS and PFS [18]. It should be mentioned that Yekedüz et al. studied only patients treated with nivolumab in at least the second line and did not detect any correlation between the line of the treatment and the survival of their patients, although more of them were given nivolumab as a second line treatment in the low-PIV group [18].
Our study was consistent with the results of Yekedüz et al. in terms of the impact of PIV on OS and PFS. We confirmed that patients from the high-PIV group had a substantially shorter median OS and PFS than patients from lower PIV groups. Our patients had longer median OS and PFS than those from Yekedüz et al.’s study, but it must be underlined that they analyzed treatment of mRCC with nivolumab beyond the first line while in our study patients with mRCC were treated with TKIs in the first line. Like the Turkish researchers we conducted a retrospective study, which has some limitations. Nevertheless, by evaluating patients treated in the same hospital, we avoided the issue of differences in measurements which are believed to exist between various laboratories and which were present in the Yekedüz et al. study [18].
This study also revealed an association between high BMI and longer OS. Several other studies have also have shown that patients with high BMI had a more favorable survival outcome than patients with low BMI [23, 24]. Similar results were obtained in a study in which the effect of the visceral adipose tissue index (VATI) on survival and toxicity during treatment with TKI was assessed [32, 33]. It is called the “obesity paradox” because obesity is associated with increased RCC incidence [20] and at the same time it is a favorable prognostic factor. Several hypotheses have been proposed to explain that paradox, but the association is still unclear.
Nishihara et al. found that the inverse relationships between BMI and mortality among some disease subgroups can be reconciled based on disease heterogeneity [34]. It means that the longer survival among obese compared with patients who have low BMI is due to a less aggressive disease subtype [35, 36] and also obesity is more associated with the development of clear cell histology than other histological types [37]. Therefore TKI may have a better outcome.
Conclusions
Adipose tissue is a major endocrine organ that produces hormones and cytokines related to cancer progression [25]. It releases adiponectin, higher plasma concentrations of which correspond with smaller tumor size, less frequent metastases, and lower Fuhrman nuclear grades in RCC [38]. It may be due to the anti-inflammatory and angiogenesis-inhibiting effects of this molecule [39]. Furthermore, sunitinib is predominantly metabolized via the liver-based CYP450 enzyme CYP3A4 [40]. High BMI is associated with elevated liver transaminase levels and fatty liver [41], and then decreased CYP3A4 expression and activity [42]. It can lead to high sunitinib concentrations, which according to Mourtzakis explains the association between high BMI and OS or high BMI and early drug-limiting toxicity [40].
Increased serum insulin-like growth factor-1 (IGF-1) and leptin in obesity can also explain the “obesity paradox”. Rasmuson et al. found an association between serum IGF-1, leptin, and prognosis [43]. In this study, serum levels of both IGF-1 and leptin positively correlated with BMI. Patients with higher serum levels of IGF-1 and leptin had a more advantageous prognosis compared with those with lower levels in univariate analysis. Moreover, lower serum IGF-1 was identified as an independent prognostic factor in multivariate analysis [43].
It should be mentioned that this study has limitations. BMI is a vague estimate of a patient’s body composition. Some scientists have proposed that the fat surface or VATI is a more accurate factor [44, 45]. BMI may not provide certain important information such as underlying sarcopenia or overdeveloped visceral adipose tissue, which is responsible for the secretion of most adipokines. Unfortunately, VATI may often be unavailable in clinical settings. Determination of BMI is cheaper and does not require computed tomography. It is a simple tool for routine practice, which can be used as a good prognostic factor. Obesity and low PIV values are significant prognostic factors for OS in geriatric mRCC patients treated with TKIs. It should be emphasized that their assessment is extremely simple and nearly cost-free. However, there are limitations associated with the retrospective nature of this study, so further research is needed.


