
Introduction
Ovarian cancer has the worst prognosis and the highest mortality rate of any gynecological cancer [1–4]. This is primarily because most patients have advanced serous ovarian carcinomas, which frequently develop resistance to platinum/taxane chemotherapy [4, 5]. Malignant ovarian tumors comprise three cell types: epithelial, stromal, and germ cells [6, 7]. Epithelial tumors (carcinomas) account for 90% of all ovarian cancers, which are further classified into two types based on biological characteristics and clinical behavior: low-grade serous ovarian cystadenocarcinoma (LGSCA) and high-grade serous ovarian cystadenocarcinoma (HGSCA) [8–10]. Serous borderline tumors represent non-invasive, low-grade, proliferative serous epithelial neoplasms falling between benign cystadenomas and serous cystadenocarcinoma (SCA) [11]. A subset of borderline ovarian tumors are precursors of LGSCA [12, 13].
Currently, the standard method for diagnosing a suspected lesion is a surgical exploration to obtain a tissue sample, followed by histological confirmation. Despite its high specificity, a meta-analysis suggests that the frozen section has low sensitivity for borderline tumors, mucinous tumors, and larger neoplasms [14]. In addition to differences in biomarker concentrations between formalin-fixed paraffin-embedded (FFPE) tissue specimens and plasma, tumor heterogeneity may limit the diagnostic value of plasma proteins [15].
Several studies have suggested that inherited or sporadic mutations in the BRCA1 and BRCA2 genes may increase the risk of ovarian cancer [16, 17]. The most prevalent subtype of type II tumors, HGSCA, is associated with relative chromosomal instability and mutations in the TP53 (96%) and BRCA1 (22%) genes [16–20]. However, it is believed that BRCA1 mutations cannot accurately predict disease progression without additional biomarkers but may predict response to the targeted treatment with poly-ADP ribose polymerase inhibitors. Protein biomarkers have been proposed as a promising tool for diagnosis and treatment, but their effectiveness is yet to be established.
However, specific biomarkers, such as cancer antigen 125 (CA125) and human epididymis protein 4 (HE4) [21–25], have been validated and are currently used to monitor treatment and identify recurrence in ovarian cancer patients. Despite the prevalence of serum CA125 measurement and ultrasonography [26] in ovarian cancer diagnosis, their early detection accuracy is limited due to false positive and false negative results. In vitro multivariate index assays (IVDMIAs) that include multiple markers have been developed to improve the diagnostic accuracy of ovarian cancer assessment [27, 28]. Before surgery, OVA1 was the first IVDMIA to assess the likelihood of malignancy in women with an ovarian adnexal mass [28, 29]. ROMA is an additional biomarker assay that determines the risk of ovarian cancer by analyzing serum concentrations of CA125 and HE4 [25, 30, 31], in addition to menopausal status [32]. The Overa test, the successor to OVA1, replaces two biomarkers in OVA1 with HE4 and follicle-stimulating hormone and provides a malignancy probability score ranging 0–10 [27, 28]. In the early stages of ovarian cancer, the survival rate is high, but it drops significantly in later stages. Unfortunately, ovarian cancer symptoms typically do not manifest until later stages, highlighting the urgent need for a screening test and early detection method that can identify biomarker changes at an early stage.
Limitations in current testing methods hinder the accurate detection of early-stage ovarian tumors [33]. Hence, it is crucial to explore more sensitive diagnostic biomarkers and develop novel treatment strategies. Integrating targeted and untargeted proteomics with biostatistics holds promise in creating innovative tools to significantly reduce ovarian cancer mortality rates [34–37]. Proteomics, known for its high specificity and sensitivity in various cancers, including ovarian cancer [38–41], has been utilized through mass spectrometry-based approaches to comprehend the disease’s pathology and identify specific biomarkers for early detection [35, 42]. Additionally, it aids in the identification of biomarkers associated with chemotherapy resistance [43, 44], a critical factor affecting treatment management and cancer progression. Personalized treatment based on these biomarkers can yield improved patient outcomes.
To contribute to this effort, we analyzed the proteomes of FFPE tissue biopsies obtained from different types of serous ovarian tumors, including benign tumors, borderline tumors, and SCA. Additionally, we investigated the proteins that showed abnormal regulation in HGSCA and LGSCA, as well as in borderline tumors compared to LGSCA. We aimed to discover markers of disease progression and assess the proteins specific to the tissue that are linked to the development of serous ovarian tumors.
Materials and methods
Study demographics and sample selection
Forty-six patients with serous ovarian tumors were selected for the current study (8 LGSCA, 26 HGSCA). All the patients were diagnosed and treated at the University of Aleppo Hospital. Two board-certified pathologists (L.G. and S.V.) reviewed all the cases, confirmed the diagnoses, and selected the samples for the current study. Only samples with > 80% vital tumor and available remaining tissue were selected for the study. Other subtypes of ovarian carcinomas (mucinous, clear cell, endometrioid), metastatic tumors, and non-epithelial tumors (germ cell, sex cord-stromal tumors) of the ovary were excluded from the study. Serous cystadenocarcinoma was graded using the two-tiered grading system: low-grade (well-differentiated) and high-grade (poorly differentiated) cancers. The tumor staging was done using the International Federation of Gynecology and Obstetrics (FIGO) system. Serum CA125 levels were routinely assessed in all patients during the diagnostic work-up and before surgery, by the local protocol in the hospital. None of the patients received chemo- or radiotherapy before the sampling.
Preparation of formalin-fixed paraffin-embedded tissue and analysis by LC-MS/MS
Forty-six FFPE samples comprising three benign, nine borderline, and 34 SCA were prepared for proteomic analysis. The paraffin was removed from seven slices of 10 µm with xylene, followed by rehydration with decreasing levels of ethanol/water, and then they were dried as previously described [45]. The tissue was then dissolved in lysis buffer (5% sodium dodecyl sulfate, 50 mM triethylammonium bicarbonate, pH 8.5), and the protein concentration was estimated using infrared spectrometry (Direct Detect Spectrometer, Merck KGaA, Darmstadt, Germany). Tryptic digestion was performed using S-Trap micro spin columns (Protifi, Farmingdale, Huntington, NY, USA), as previously described [46]. A set of samples was further purified using C18 spin columns. The peptide concentration was estimated by tryptophan fluorescence [45], and finally, samples were dissolved in 0.1% formic acid and 1 µg of each sample was injected in one to four replicates into a Dionex Ultimate 3000 RSCL nano-LC system (Thermo Fisher Scientific Instruments, Waltham, MA, USA). Samples were loaded and trapped on a µ-Precolumn (300 µm × 5 mm, C18 PepMap100, 5 µm, 100 Å (Thermo Fisher Scientific, Waltham, MA, USA) with a flow rate of 30 µl/min using 97.9% (vol/vol) water, 2% (vol/vol) acetonitrile and 0.1% (vol/vol) formic acid. Peptide separation was performed with a flow of 300 nl/min using an analytical column (EASY-Spray Column, 500 mm × 75 µm, PepMap RSCL, C18, 2 mm, 100 Å, Thermo Scientific). Peptides were eluted using a gradient by mixing buffer A (99.9% (vol/vol) water, 0.1% (vol/vol) formic acid) with buffer B (99.9% (vol/vol) acetonitrile, 0.1% (vol/vol) formic acid) over 181 min. The gradient was initiated with 2% B at 0 min, 14% B at 3 min, 25% B at 120 min, 40% B at 125 min, 80% B at 127 min, 80% B at 143 min and 2% B at 144 min to 181 min. The acquisition was performed on an Orbitrap Fusion Tribrid mass spectrometer (Thermo Scientific). The universal method setting was used with a duration of 152 min. Peptides with charge states of 2–7 were included. The cycle time was 3 s. Dynamic exclusion was set to 60 s. MS1 was performed with full orbitrap scans (m/z 375–1500) at a resolution of 120,000 with an automatic gain control (AGC) target of 4 × 10⁵ and a maximum injection time of 50 ms. The most intense precursors were selected with an intensity threshold of 5 × 10³ to a maximum of 1 × 10²⁰. For MS2 scans precursor ions were isolated in the quadrupole with an isolation window of 1.6 m/z. MS2 scans were performed at a rapid scan rate in the linear ion trap with collision-induced dissociation energy at 35%, an AGC target of 2 × 10³, and a maximum injection time of 300 ms, as previously described [46]. The MS analysis generated 184 raw files. The raw files were analyzed with MaxQuant version 1.6.5.0 (Max Planck Institute of Biochemistry, Martinsried, Germany) for label-free quantification (LFQ) analysis [47]. The database searched was Uniprot Homo sapiens (filtered and reviewed) (www.uniprot.org), downloaded on 10 August 2022. MaxQuant settings have previously been described [48]. In short, we generally used the default setting for LFQ analysis with a false discovery rate (FDR) of 0.01 for protein identification and peptide spectrum matches. Trypsin digestion was used instead of Trypsin/P. The label-free quantification minimum ratio count was set to 1. The “match between runs” function was activated. MS/MS was required for quantification. Peptides used for quantification were unique and razor peptides, unmodified and modified with oxidation (M) or acetyl (protein N-terminal). A Decoy search was performed in the database with revert sequences. The search included contaminant sequences. The MaxLFQ algorithm in MaxQuant performs a very robust “delayed normalization” procedure [49]. MaxQuant data can be found in Supplementary File 1.
Statistical analysis
Demographic and clinical data were examined using IBM SPSS Statistics 29.0.0.0 (IBM Corp., Armonk, NY, USA) and displayed as mean and standard deviations (mean ±SD). Age disparities among the study groups were explored using ANOVA (analysis of variance) with Games-Howell post hoc analysis. Within the SIMCA software, we conducted an unsupervised principal component analysis to evaluate trends and detect potential outliers in the dataset (Suppl. File 2, Fig. S1). To pinpoint proteins with significant contributions to group differentiation, we utilized OPLS-DA, a supervised multivariate analysis technique. Both principal component analysis and OPLS-DA analyses were carried out on proteomic data that had been transformed logarithmically. In Perseus versions 1.6.14.0 or 2.0.7.0 (Max Planck Institute of Biochemistry, Martinsried, Germany) [47], the LFQ data of the identified proteins extracted from the MS were log2 transformed, and technical replicate values were averaged to obtain a single value for each biological replicate. Data were further filtered by excluding potential contaminants, reverse sequences, and proteins only identified by site. For a successful identification, it was essential for a protein to possess at least 2 unique peptides. A protein needed to exhibit a minimum of 70% valid values within every group. For group comparison analysis, we applied a stringent statistical methodology. Depending on the specific nature of the comparisons, we either used parametric tests (such as Student’s t-test and ANOVA coupled with Tukey’s HSD post hoc test) or their non-parametric counterparts (such as the Mann-Whitney U test and Kruskal-Wallis H test, complemented by Bonferroni correction). Significance thresholds were set at p < 0.05 and a log2 fold change (log2FC) > 1 or < –1. In cases of multiple ANOVA testing, we adopted a permutation-based FDR technique, using 250 randomizations, and presented the findings as q-values.
The chosen models and biomarker candidates were visualized and presented in the form of individual receiver operating characteristic (ROC) curves. Statistical analysis was performed using GraphPad Prism 9.5.1 (GraphPad Software, La Jolla, CA, USA) and Microsoft Excel. To conduct PCA and OPLS-DA analyses, SIMCA 17 software (Sartorius, Göttingen, Germany) was used. For the combined ROC analysis metaboanalyst v. 6.0 was used (https://www.metaboanalyst.ca/home.xhtml). The relevant log transformed MS data for proteins were tested using the “ROC curve-based model evaluation” under Biomarker analysis. The chosen algorithm for both combined models is the random forest.
For the pathway analysis, data were analyzed with ingenuity pathway analysis (IPA) from QIAGEN Inc., (https://www.qiagenbioinformatics.com/products/ingenuity-pathway-analysis). The algorithms developed for use in IPA are described by Krämer et al. [50]. Of the 1,736 proteins uploaded 1,725 proteins were recognized by IPA. Analysis was performed on proteins that were significantly changed based on a t-test at p < 0.05 (Suppl. File 3).
Results
Clinicopathologic characteristics of the cohort
The clinicopathologic characteristics of the cohort are presented in Table 1. During the study period, 34 patients with SCA and 9 with borderline serous ovarian cystadenomas met the inclusion requirements and participated in the study. In addition, 3 benign serous cystadenomas were gathered as control samples. Over 90% of the SCA patients were identified with early-stage disease (FIGO stage I). Regarding tumor grade, more than 75% of the SCA patients presented with HGSCA (Table 1). As anticipated, age correlated significantly with the type of the disease.
Table 1
Patient and tumor characteristics of the ovarian cancer cohort
Distinct tissue-enriched proteomic profile between benign tumors, borderline tumors, and serous cystadenocarcinoma
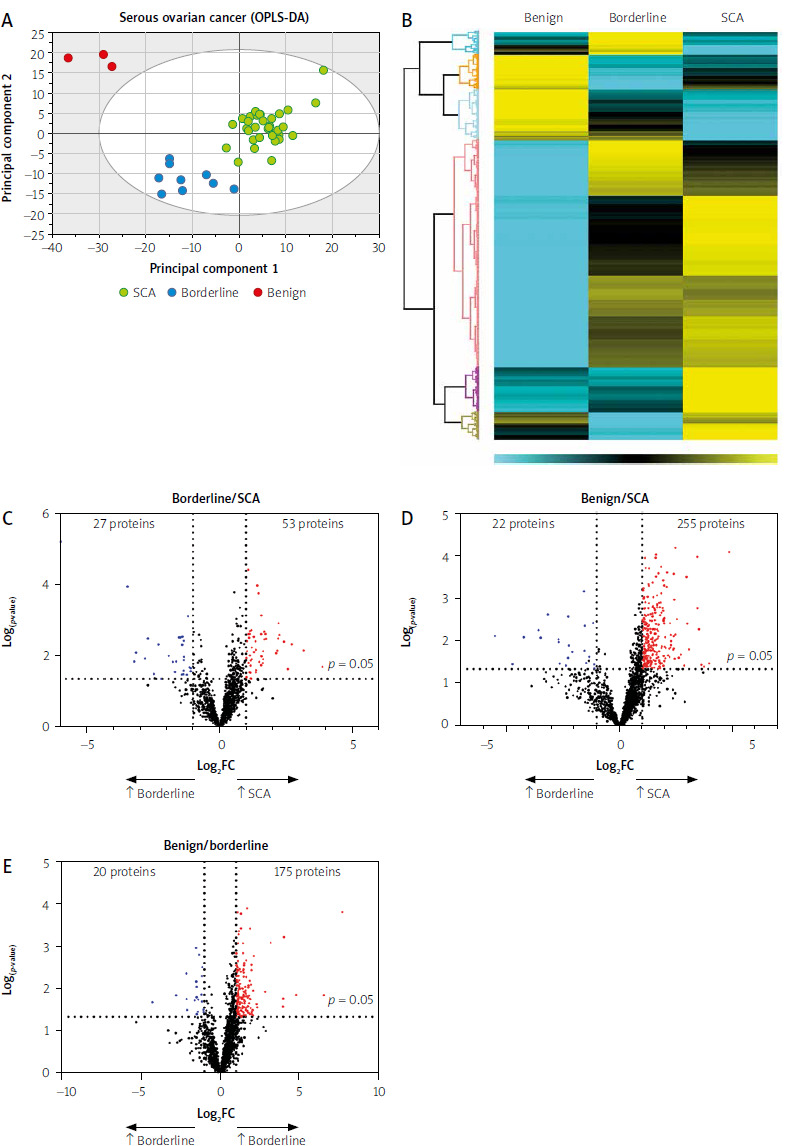
Using mass spectrometry, 3802 proteins were detected, with 1736 identified in at least 70% of samples within each group (Suppl. File 1). The unsupervised PCA identified three groups with some overlap between them (Suppl. File 2, Fig. S1). In addition, a multivariate analysis using orthogonal partial least squares discriminant analysis (OPLS-DA) was performed to include the integrated protein profiles found in SCA, borderline, and benign cases (Fig. 1 A). Interestingly, the participants in the study were found to cluster based on their respective groups, with two principal components (PC1 and PC2) accounting for 95% of the subject clustering (R2X = 0.490, Q2 = 0.245 (Comp1) (R2Y = 0.801, Q2 = 0.258) (Comp2). This suggests that the protein profiles of each group were unique and contributed to the observed discrimination. A heat map was also used to show the differences in protein abundance between the three groups (Fig. 1 B). Finally, volcano plots were used to demonstrate fold changes in protein expression between various group comparisons: SCA vs. borderline showed 53 upregulated and 27 downregulated proteins (Fig. 1 C, Suppl. File 1), SCA vs. benign revealed 255 upregulated and 22 downregulated proteins (Fig. 1 D, Suppl. File 1), and benign vs. borderline showed 175 upregulated and 20 downregulated proteins (Fig. 1 E, Suppl. File 1). Table 2 shows the pairwise comparison of the top 10 proteins with differential expression between SCA vs. borderline, SCA vs. benign, and borderline vs. benign, with log2FC > 1 or < –1. Supplementary File 1 provides additional information on all significantly expressed proteins.
Fig. 1
Tissue proteomic profiling of serous ovarian tumors
FC – fold change, OPLS-DA – orthogonal partial least squares discriminant analysis, SCA – serous cystadenocarcinoma OPLS-DA score plots display distinct separation and clustering among serous cystadenocarcinoma (SCA) samples (green circles), borderline samples (blue circles), and benign samples (red circles) on the first and second principal component axis with a 95% CI (oval circle). This indicates the existence of specific protein subsets that can effectively distinguish between SCA, borderline, and benign tumors (A). The heatmap displays Z-score normalized label-free quantification values of differentially expressed proteins in multiple comparisons of the three groups studied (B). Volcano plots were prepared to identify potential diagnostic and disease progression protein markers for OC, illustrating upregulated proteins for all groups (red) and downregulated proteins (blue) based on FC (log2FC > 1 or < −1) and p-value < 0.05 (black dotted lines) (C). In the SCA vs. borderline comparison, 53 proteins were upregulated and 27 downregulated (D). In the SCA vs. benign comparison, 255 proteins were upregulated, and 22 were downregulated (E). In the benign vs. borderline comparison, 175 proteins were upregulated, and 20 were downregulated.
Potential biomarker candidates in serous cystadenocarcinoma disease progression
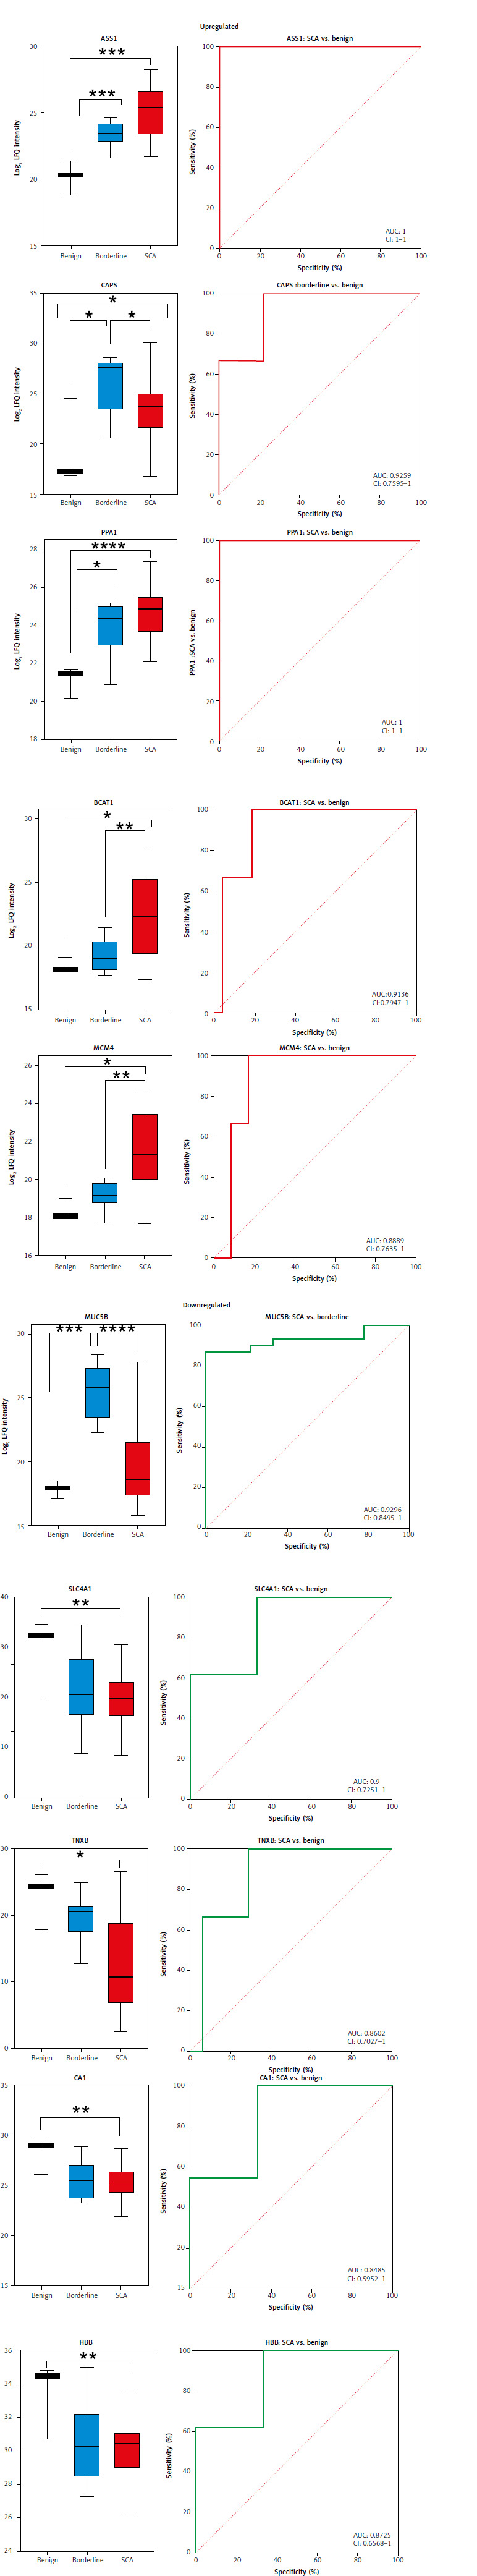
To assess the diagnostic potential of the significant proteins, the expression of each protein across the three groups was represented using a box plot, followed by ROC analysis. When comparing differentially expressed proteins from benign to borderline to SCA tumors, we identified five upregulated proteins (ASS1, CAPS, PPA1, BCAT1, MCM4) and downregulated proteins (MUC5B, SLC4A1, tenascin-XB – TNXB, carbonic anhydrase 1 – CA1, hemoglobin β – HBB), all of which exhibited AUCs ≥ 0.84 (Fig. 2). In addition, nine proteins previously linked to cancer show acceptable sensitivity and specificity in this study (Suppl. File 2, Table S1). To investigate possible proteins that distinguish borderline from LGSCA and LGSCA from HGSCA, a biomarker panel method was used. Each group of proteins had its own combined ROC curve. The upregulation of LGSCA proteins resulted in a combined ROC AUC value of 0.942, 95% CI: 0.774–1, while the AUC value for LGSCA vs. HGSCA was 0.942, CI: 0.774–1.
Fig. 2
Identification of disease progression biomarkers in serous ovarian cancer
AUC – area under the curve, ASS1 – argininosuccinate synthetase 1, BCAT1 – branched chain amino acid transaminase, CA1 – carbonic anhydrase 1, CAPS – calcyphosin, CI – confidence interval, HBB – hemoglobin β, LFQ – label-free quantification, MCM4 – minichromosome maintenance complex component 4, while proteins exhibiting reduced expression were MUC5B – mucin-5B, PPA1 – inorganic pyrophosphatase 1, SCA – serous cystadenocarcinoma, SLC4A1 – solute carrier family 4 member 1, TNXB – tenascin-XB Receiver operating characteristic curves and box plots of protein candidates. Proteins exhibiting increased expression in the serous cystadenocarcinoma, which hold diagnostic potential. Box plots display logarithmic label-free quantification intensities excluding NaN (missing values).
*** p < 0.001
**** p < 0.0001
Protein markers differentiating borderline from low-grade serous cystadenocarcinoma and low-grade serous cystadenocarcinoma from high-grade serous cystadenocarcinoma
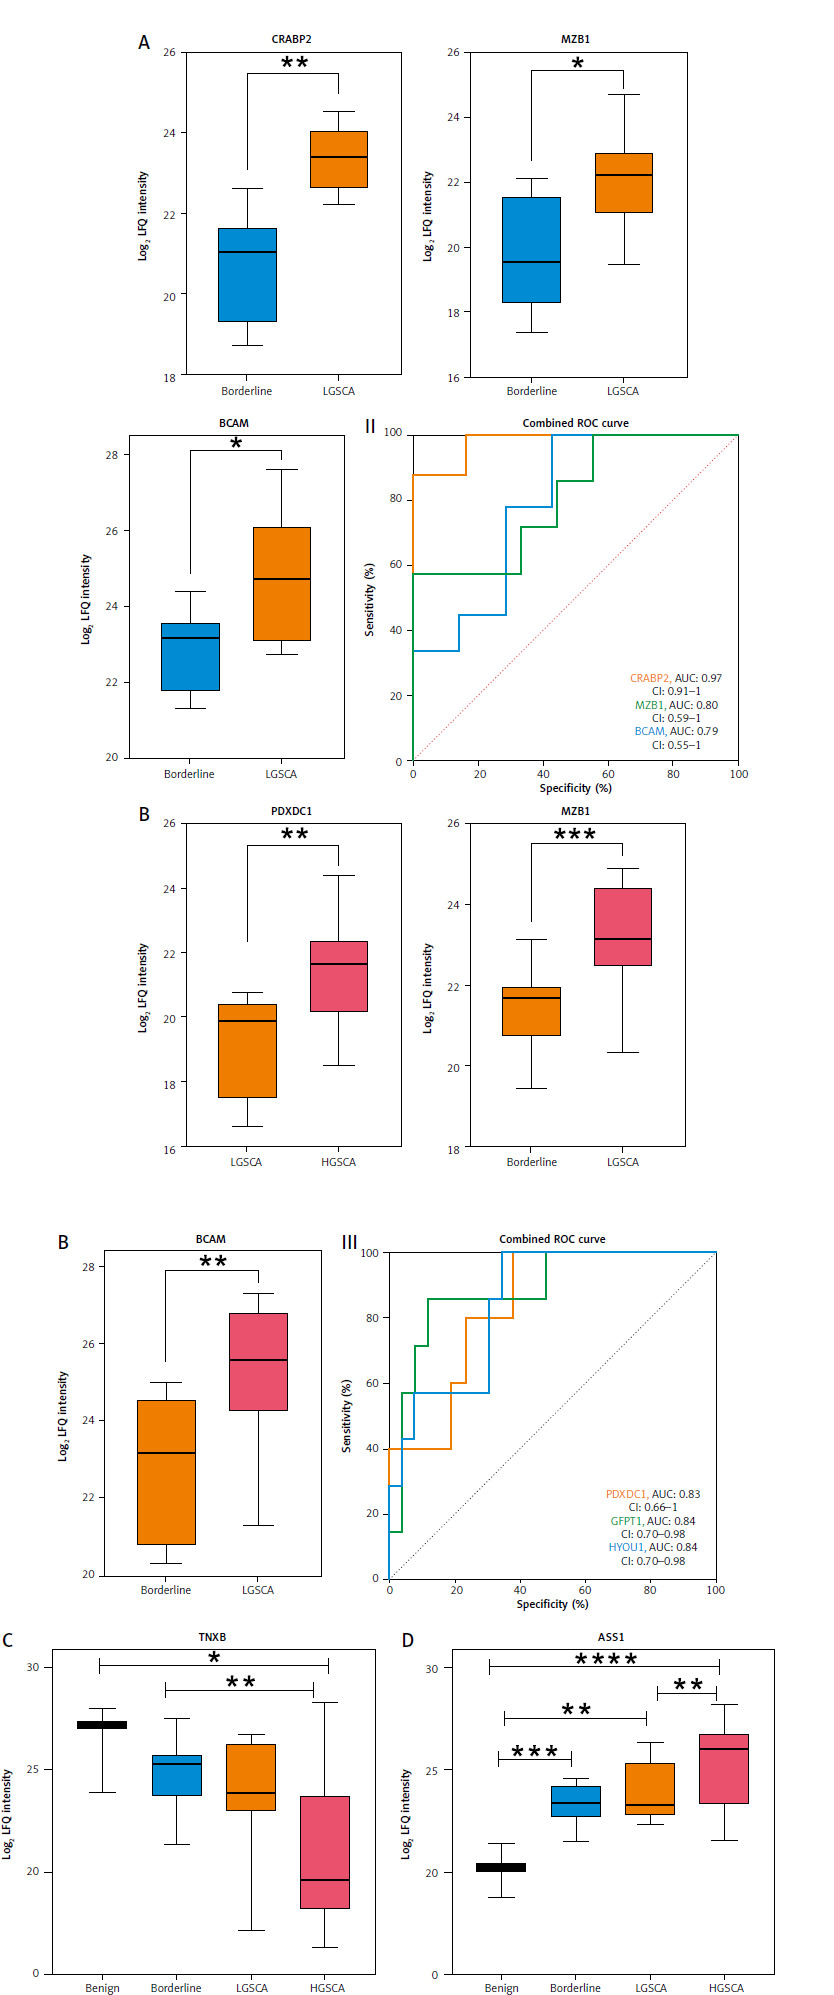
To identify protein markers that effectively distinguished between borderline vs. LGSCA and LGSCA vs. HGSCA, we implemented box plots and ROC analysis. CRABP2, MZB1, and BCAM showed significantly higher expression in LGSCA compared to borderline tumors, with AUC values of 0.97, 0.80, and 0.79, respectively (Figs. 3 A, 3 A–II, Suppl. File 2, Table S1). Pyridoxal dependent decarboxylase domain containing 1, GFPT1, and HYOU1 exhibited higher levels in HGSCA compared to LGSCA, with AUC values in the range 0.83–0.98 (Figs. 3 B, 3 B–III, Suppl. File 2, Table S1). Tenascin-XB showed a progressive decrease in expression from benign tumors to HGSCA, with significant differences observed between benign and HGSCA, as well as borderline and HGSCA (Fig. 3 C, Table S1). Conversely, ASS1 displayed a consistent increase in expression from benign tumors through borderline, LGSCA, and HGSCA, marking it as a potential indicator of disease progression.
Fig. 3
Highlights the identification of protein markers capable of differentiating borderline from low-grade serous cystadenocarcinoma (LGSCA) and LGSCA from high-grade serous cystadenocarcinoma
LFQ – label-free quantification Box plots of three possible protein biomarkers for borderline to LGSCA progression. Comparing borderline tumors to LGSCA reveals a significant increase in levels of CRABP2 – cellular retinoic acid-binding protein 2, MZB1 – marginal zone B and B1 cell specific protein, and BCAM – basal cell adhesion molecule (A). Box plots of three potential protein biomarkers for identifying LGSCA and high-grade serous cystadenocarcinoma (HGSCA) (B). Levels of PDXDC1 – pyridoxal dependent decarboxylase domain containing 1, GFPT1 – glutamine-fructose-6-phosphate transaminase 1, and HYOU1 – hypoxia up-regulated 1 were significantly increased. ROC curves for distinguishing between borderline and LGSCA proteins, and ROC curves (III) for proteins that distinguish LGSCA from HGSCA (II). Box plots of tenascin- XB (TNXB) and argininosuccinate synthase 1 (ASS1) as potential serous cystadenocarcinoma disease progression markers (C, D). For TNXB, there is a progressive decrease from benign to HGSCA, with significant differences between benign and HGSCA, as well as borderline and HGSCA. A significant progressive change can be seen in log2 label-free quantification intensities of ASS1 from benign to borderline, LGSCA, and HGSCA (Fig. 3 C, Suppl. File 2, Table S1).
* p < 0.05
** p < 0.01
*** p < 0.001
**** p < 0.0001
Ingenuity pathway analysis revealing altered protein expression pathways in serous cystadenocarcinoma progression
In a pairwise comparison of SCA, borderline, and benign tumors, the IPA analysis identified numerous perturbed “canonical pathways” and “diseases and functions” (Suppl. File 3). Functionally, SCA and borderline tumors are biologically related and distinct from benign tumors. Several diseases and functions associated with cell proliferation and viability were more prevalent in SCA and borderline tumors than in benign tumors. Among disease or function annotations containing “apoptosis” and “cell death,” we discovered eleven decreases in SCA and three decreases in borderline tumors compared to benign tumors. When compared to benign tumors, seven annotations containing the word “proliferation” were upregulated in SCA and six in borderline. None of these were significantly different between SCA and borderline tumors, implying that SCA and borderline tumors are more similar in terms of these functions. When SCA was compared to borderline tumors, the biological differences were much less pronounced; for example, the “diseases and functions” analysis revealed increased nucleotide metabolism in SCA as well as changes in proteins involved in certain types of cancers. From the perturbed “canonical pathways” we discovered that SCA and borderline tumors had significantly higher levels of RNA synthesis and processing than benign tumors. For example, “RNA polymerase II transcription,” “processing of capped intron-containing pre-mRNA” and “processing of capped intronless pre-mRNA” were higher in SCA and borderline tumors compared to benign tumors. Mitochondrial metabolic functions, such as “oxidative phosphorylation” were higher in SCA compared to borderline tumors. Serous cystadenocarcinoma and borderline tumors were distinct, despite being biologically closely related, with some differences in nucleotide and mitochondrial metabolic processes. Both tumors exhibit high proliferation, distinguishing them from benign tumors.
Discussion
Serous ovarian tumors are complex and heterogeneous groups of neoplasms, encompassing various entities from benign via borderline and LGSCA to high-grade neoplasms, such as HGSCA. The most common, HGSCA, is also the deadliest gynecological cancer, and early detection is vital for enhanced patient outcomes. Therefore, identifying new biomarkers that can enhance diagnostic capabilities independently or in combination with existing tumor markers is essential. This study presents an extensive proteomic analysis of FFPE tissue samples obtained at the time of diagnosis from benign tumors, borderline tumors, and SCA. Our study aimed to identify tissue-based markers associated with disease development and progression to provide potential targets for future research and therapeutic interventions.
We conducted a detailed comparison of protein profiles across three ovarian tumor conditions: SCA vs. borderline (n = 80), SCA vs. benign (n = 277), and borderline vs. benign (n = 195), as depicted in Figs. 1 C–E and detailed in Supplementary File 1. This analysis also highlighted significant differences, including the upregulation and downregulation of the top ten proteins between SCA vs. benign, SCA vs. benign, and borderline vs. benign (Table 2). Our comparative analysis of protein expression across benign, borderline, and SCA tumors indicated that five proteins (ASS1, CAPS, PPA1, BCAT1, MCM4) were significantly upregulated, while five proteins (MUC5B, SLC4A1, TNXB, CA1, HBB) were downregulated. All of these proteins exhibited AUCs ≥ 0.84. PPA1 overexpression, linked to poor survival and chemoresistance, impacts key oncogenic pathways such as p53, β-catenin, and PI3K/AKT/GSK3 [51, 52]. Argininosuccinate synthase 1, pivotal in arginine metabolism, is overexpressed in HGSCA facilitating tumor growth and metastasis, possibly modulated via the IL-17/CXCL8 pathway [53]. Moreover, CAPS, BCAT1, and MCM4 distinctly differentiate between SCA and benign tumors, suggesting their potential utility in diagnostics. Further insights include BCAT1 in promoting proliferation and invasion in epithelial ovarian cancer, correlating with poor outcomes [54, 55]. The expression of MCM4 is closely tied to the cancer stage and presents high predictive value in ovarian cancer diagnostics [56]. Conversely, CAPS, though prevalent in lung and colorectal cancers, has an uncertain role in ovarian cancer pathology [57]. Significant downregulations noted in our study, such as MUC5B, a glycoprotein with varied expression in gastric and breast cancers, show reduced levels in higher-grade ovarian tumors, aligning with our findings of lower MUC5B in SCA than borderline tumors [57]. These molecular distinctions offer a deeper understanding of ovarian cancer pathology and could guide future therapeutic strategies [58].
Table 2
Top 10 differentially expressed proteins for cystadenocarcinoma/borderline, serous cystadenocarcinoma/benign, and borderline/benign
Carbonic anhydrases control respiration, pH, and ion transport [59, 60]. Carbonic anhydrases influence the pH levels of cancer cells and their surrounding microenvironment. These pH changes influence the ability of tumors to evade the immune system, proliferate, and invade nearby tissues. Carbonic anhydrase 1 level changes have been linked to several cancers, including colorectal cancer, myeloid leukemia, and renal carcinoma, and they have been proposed as a biomarker for non-small lung cancer [59, 60]. Hemoglobin β transports oxygen within erythrocytes, facilitating cellular respiration and maintaining metabolic balance. Recent cancer research has revealed aberrant expression in a variety of malignancies. For example, HBB has been identified as a lung-derived antimetastatic factor that inhibits neuroblastoma growth and metastasis, and another study highlighted its potential as a serum biomarker for ovarian cancer due to elevated levels in patient sera [61–63]. In contrast, our findings show significant down-regulation of HBB expression between benign tumors and SCA, indicating that HBB plays a different role that may be specific to the tumor type or stage. While the exact role of SCL4A1 in ovarian cancer is unknown, high SLC4A1 expression has been associated with poor progression-free survival [64].
Our study accentuates the diagnostic potential of specific protein markers in distinguishing between SCA, borderline, and benign tumors. Moreover, our identification of upregulated and downregulated proteins provides insights into ovarian cancer progression and highlights potential avenues for further research and therapeutic intervention. Moreover, we further explored the role of ASS1 and TNXB as disease progression markers in SCA. The progressive increase in ASS1 expression from benign to borderline to malignant tumors suggests a potential role in ovarian cancer progression. Argininosuccinate synthase 1 is involved in the urea cycle and arginine biosynthesis, and its upregulation may support the increased metabolic demands of rapidly proliferating cancer cells [65]. There is strong crosstalk between constituents of the urea cycle and other metabolic pathways which have been shown to promote tumorigenesis in various cell types [66]. Recent studies have linked ASS1 to the IL-17/CXCL8 signaling pathway in ovarian cancer, potentially contributing to tumor growth and metastasis [66] For other types of cancer, ASS1 has been shown to have decreased expression, and this decrease has been associated with increased cancer cell survival, migration, and invasion [67]. However, in ovarian cancer, it has been documented that increased expression of ASS1 is present. Specifically, increased expression of ASS1 is seen in LGSCA and HGSCA [68]. Interestingly, similarly to other cancers, a decrease of ASS1 expression was found in non-serous ovarian cancer subtypes [66]. Our findings corroborate existing literature by showing a progressive increase in ASS1 expression across our samples. Additionally, we observed a novel trend: ASS1 expression begins to increase from the borderline stage of tumor development in SCA, a pattern not previously reported.
In contrast, TNXB, an extracellular matrix glycoprotein that is predominantly expressed during embryogenesis, showed a progressive decrease from benign to malignant tumors in our study [69, 70]. This is consistent with previous findings in other cancer types, where TNXB loss has been linked to tumor progression [71]. Tenascin-XB may play a role in maintaining tissue integrity, and its loss could facilitate tumor invasion and metastasis [72, 73]. Our observation of decreased TNXB levels in ovarian tumors contrasts with a previous study by Marcišauskas et al., which reported increased TNXB in ovarian cancer cyst fluid [74]. This discrepancy could be due to differences in sample types (tissue vs. cyst fluid), tumor heterogeneity, or variations in protein processing and secretion. Further investigation is needed to reconcile these findings and understand the complex role of TNXB in ovarian cancer biology.
The identification of differentially expressed proteins from tumor tissue presents significant potential for future clinical applications in the early diagnosis and molecular typing of ovarian cancer. Our study highlights several key proteins, such as ASS1 and TNXB, which serve as biomarkers for distinguishing between benign, borderline, and SCA while providing insights into disease progression. The robust protein profiles identified through our proteomic analysis present potential to facilitate the development of diagnostic assays aimed at enhancing early detection, which is critical given the often asymptomatic nature of ovarian cancer in its initial stages. Furthermore, classifying tumors based on their molecular characteristics could enable personalized treatment strategies, allowing clinicians to tailor interventions according to individual protein expression profiles. This aligns with the growing trend toward precision medicine in oncology, where understanding the unique biological landscape of a patient’s tumor can significantly improve outcomes. By integrating these biomarkers into clinical practice, we could enhance diagnostic accuracy and improve monitoring of disease progression, ultimately contributing to better patient management and survival rates in ovarian cancer. The identified biomarkers, such as ASS1 and TNXB, should also be further validated using some of the ancillary diagnostic techniques, including immunohistochemistry.
While our study provides valuable insights into potential biomarkers for ovarian cancer progression, several limitations must be considered. The small sample size, particularly for benign (n = 3) and borderline (n = 9) tumors, substantially limits the statistical power and generalizability of our findings. Additionally, the lack of an independent validation cohort means that our results should be considered preliminary and require further confirmation. Additionally, there is a lack of quantitative CA125 data available for correlation, which limits our ability to explore potential relationships. Moreover, the number of patients with advanced stage cancer is limited, with only three patients included, further constraining the analysis. Regarding the methodology employed, the MS datasets contain numerous instances of missing data, potentially resulting in the loss of important comparisons. Missing values may be due to protein levels below the detection limit or technical limitations. Due to limited sample availability, we opted for the well-established data-dependent acquisition technique, which yields similar peptide and protein quantification [75, 76]. To address missing values, we employed the “match between runs” option in MaxQuant analysis, as recommended by Yu et al. [77]. Determining data filtration stringency is subjective; overly strict methods risk overlooking important markers, while no filtration may introduce contaminants and biased results.
MS
Conclusions
Our preliminary study provides an understanding of protein expression patterns in ovarian tumors and their relevance for diagnostics and treatment. Through our MS-based tissue proteomics analysis, we have identified promising protein pathways and biomarkers associated with SCA. The expression of these biomarkers shows correlations with tumor progression, from benign and borderline tumors to LGSCA and HGSCA. These findings shed light on the mechanisms underlying ovarian carcinogenesis, emphasizing the need for further investigation and validation of these biomarkers with clinical markers such as CA125 and HE4 to determine whether they offer complementary or superior diagnostic value. Further diagnostic and clinical studies should be performed to confirm the validity and clinical utility of the identified biomarkers.


