
Introduction
The term liquid biopsy includes the examination of circulating DNA or circulating tumor cells. DNA, which is continuously secreted into the bloodstream by normal and cancer cells, makes up the circulating cell-free DNA (cfDNA). It is characterized by a short half-life (about 1 hour) [1]. This short half-life makes cfDNA a precise marker for tracking the course of the disease. The clinical relevance of cfDNA testing is explored in various respects. The prognostic value of baseline cfDNA concentration as a potential biomarker of overall survival has been shown in various tumor types. In tumors with a different location or histological type, basal levels of cfDNA increased with tumor size (T classification) or tumor volume, as shown in anal cancer [2], oral cancer [3], and non-small cell lung cancer (NSCLC) [4].
A question that arises is whether the changes in cfDNA levels accurately reflect the behavior of the tumor during therapy. Studies on human xenografts in immunocompromised mice produced inconsistent results [5, 6]. Cheng et al. observed a significantly higher concentration of cfDNA in the plasma of tumor bearing mice than in control mice [5]. In contrast, Thierry et al. [6] found no differences in the concentration of cfDNA between control and inoculated mice. In other studies, immunocompetent mice inoculated with MCA-2 (highly immunogenic mouse sarcoma) cells showed an increase in cfDNA concentration with tumor growth, or a decrease with tumor rejection. Importantly, the increase in cfDNA concentration preceded tumor appearance by 2 days, while tumor regression was concurrent with a decrease in cfDNA concentration. Hence, the authors suggested the possibility of using cfDNA to track the response to treatment [7]. The above results indicate the participation of the immune system in the formation of cfDNA; therefore in our research we decided to check the relationship between circulating cells of the immune system and cfDNA, as well as to verify the usefulness of cfDNA for monitoring the course of the disease in squamous cell anal.
Material and methods
In this study we assessed the clinical validity of circulating DNA (cfDNA) detection in prospectively collected samples from patients with anal squamous cell carcinoma (ASCC). Patients were homogenously treated with chemoradiotherapy (CRT) according to the RTOG 0529 protocol [8]; two chemotherapy cycles with mitomycin C and 5-fluorouracyl and simultaneous-integrated boost intensity-modulated radiation therapy (SIB-IMRT) at the Maria Sklodowska-Curie National Research Institute of Oncology Gliwice Branch, Poland between October, 2016 and March, 2019. The project was approved by the Bioethics Committee at the Maria Sklodowska-Curie National Research Institute of Oncology Gliwice Branch, Poland. The study conformed to the Code of Ethics of the World Medical Association. Informed consent was obtained from all subjects involved in the study. Based on the PET/CT examination, radiotherapy was planned and the primary tumor volume was determined. For delineation of the primary tumor standardized uptake values (SUV) the threshold of 2.5 has been used in accordance with the institutional practice. Treatment response was evaluated by clinical and radiological examination depending on the clinical situation. Histology was performed outside of Maria Sklodowska-Curie National Research Institute of Oncology Gliwice Branch, Poland.
Peripheral blood (12 ml) was collected into K3EDTA tubes (Becton-Dickinson, New Jersey, Franklin Lakes, USA). Immediately after drawing blood samples, they were separated by double centrifugation (10 min at 4°C, 300 γ and 1000 g). Plasma was aliquoted (1 ml) and stored at –80°C until DNA isolation. DNA was extracted with Genomic Mini AX Body Fluids kit (A&A Biotechnology, Gdynia, Poland) according to the manufacturer’s instructions. Blood morphology was done routinely using a SYSMEX XN-550 analyzer (Sysmex Europe GmbH, Germany). The data on the number of white blood cells were obtained from hospital registers, and patient survival data were obtained from the Silesian Cancer Registry. Blood samples were taken at various stages of treatment during routine laboratory tests: at baseline (0) (1–30 days before therapy); during therapy (A) (after first chemotherapy cycle); after treatment (B) (1–30 days after CRT); three times at follow-up (C) – 24 months, (D) – > 2 years and (E) > 3 years after CRT.
Amplification of human telomerase reverse transcriptase (TERT) was used as a marker of the total amount of genomic DNA. The oligonucleotides (probes and primers) for the TERT gene were synthesized by Genomed S.A. (Genomed S.A., Warsaw, Poland). All PCR reactions were performed using the Bio-Rad CFX96 qPCR instrument (Bio-Rad Laboratories, Hemel Hempstead, United Kingdom). Concentration of cfDNA was expressed as ng/ml.
Statistical analysis. The chi-square test was used to evaluate the association between categorical variables. Continuous variables were analyzed via the nonparametric Mann-Whitney U test. The one-way ANOVA test was used to test for differences between the groups during cfDNA monitoring. All statistical analyses were performed using Statistica software ver. 13.1 (Dell Inc., Tulsa, USA), and p < 0.050 was considered significant.
This research was funded by the National Center of Research and Development, grant number TANGO2/340829/NCBR/2017 (grant awarded to AM Mazurek) and an Institutional Grant of Maria Sklodowska-Curie National Research Institute of Oncology Gliwice Branch (awarded to AM Mazurek).
Results
Analysis of total circulating cell-free DNA before treatment
The study included 26 newly diagnosed ASCC patients. Detailed patients’ characteristics are presented in Table 1.
Table 1
Patients’ characteristics
The total cfDNA concentration was measured by quantitative PCR using TERT amplification. In pre-treatment samples, cfDNA levels ranged from 4.88 to 49.0 ng/ml; an outlier value (49 ng/ml) was discarded. There was no significant relationship between baseline levels of cfDNA and clinical/demographic variables, with insignificantly higher cfDNA levels in advanced tumors. A strong correlation was found between the concentration of total cfDNA and the tumor volume assessed by PET/CT (r = 0.9, p = 0.00006). A positive correlation was also found between cfDNA and number of neutrophils (r = 0.706, p = 0.0069). Apart from the described correlation between cfDNA and neutrophil counts, we found no relationship between other parameters such as total white blood cell count, lymphocyte count or neutrophil to lymphocyte ratio.
Fluctuation in circulating cell-free DNA level during therapy
Plasma samples were collected at following points: before treatment (0) – 14 samples, during treatment (A) – 10 samples, at the end of treatment (B) – 9 samples, and during the follow-up (C) – 11 samples, (D) – 9 samples, (E) – 7 samples. Collectively, 60 plasma samples were analyzed. The group consisted of 21 women (81%) and 5 men (19%), with a median age of 64 years (range: 47–80 years). No distant metastases were diagnosed at the time of enrollment. As a rule, we observed an increase in cfDNA levels after initiation of therapy, a peak at the end of treatment, and a decrease during the follow-up period. After two years, cfDNA levels had dropped below pre-treatment values (Table 2).
Table 2
Data on circulating cell-free DNA concentration at various points before, relative to treatment in primary anal squamous cell carcinoma
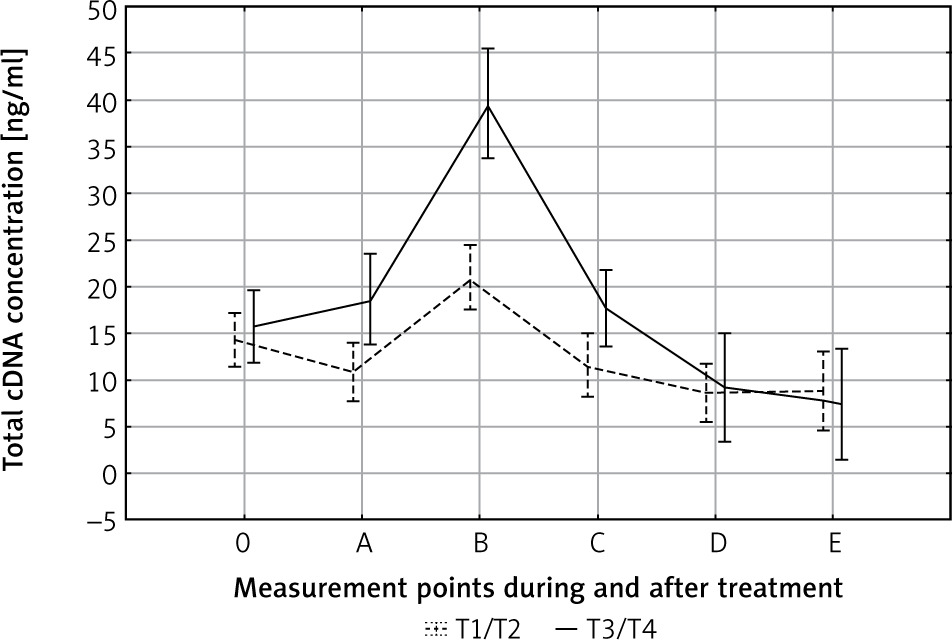
After adjusting for tumor size, in both T1/T2 and T3/T4 tumors the pattern of cfDNA fluctuation was similar. In both groups the highest level of cfDNA was observed at the end of therapy (B); in advanced tumors it was significantly higher than in T1–T2 tumors (p < 0.01) (Fig. 1). The degree of lymph node involvement did not affect the changes in cfDNA levels during treatment (p = 0.79). This result shows that primary tumor breakdown, and not lymph nodes, is responsible for the increase in cfDNA concentration. Other variables did not affect cfDNA kinetics during treatment and follow-up.
Fig. 1
Effect of tumor size on circulating cell-free DNA (cfDNA) clearance. The highest cfDNA values were found in patients with advanced tumors (T3–T4) at the end of therapy. 0, A, B, C, D, E – time points in relation to chemoradiotherapy. The dotted and solid lines represent the mean cfDNA concentration (±SD) for T1/T2 and T3/T4 groups, respectively
Changes in total circulating cell-free DNA concentration in terms of response to treatment
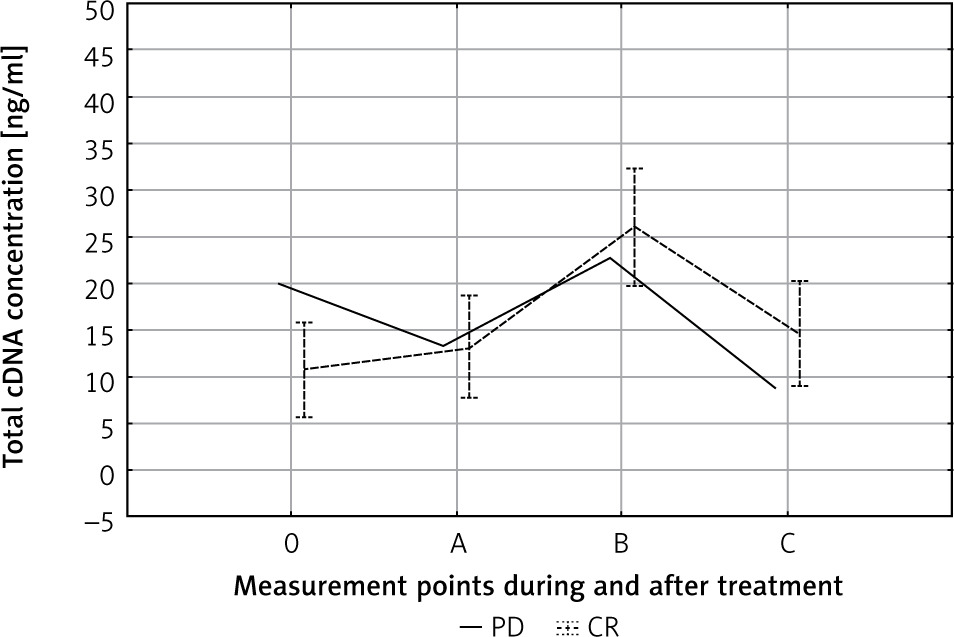
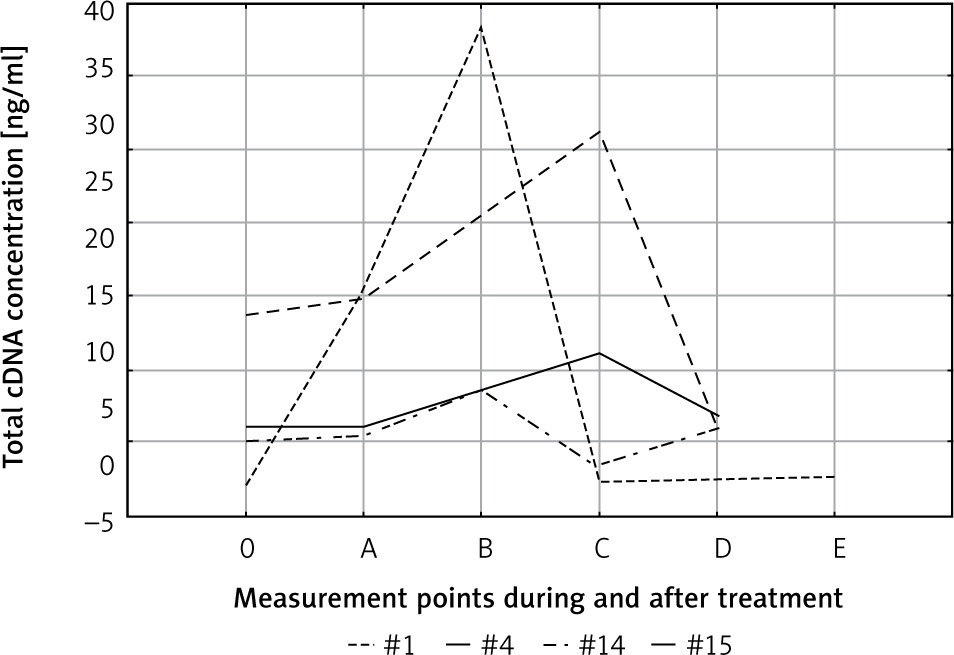
We observed a statistically insignificantly higher pre-treatment (point 0) cfDNA level in patients with progressive disease (PD) compared to patients with a partial or complete response (PR + CR) (19.95 ng/ml vs. 9.95 ng/ml) (Fig. 2). Apart from this difference, the kinetics of changes in cfDNA concentration during treatment of PD and PR + CR patients was the same. Significant differences were observed in the individual kinetics of cfDNA during treatment (Fig. 3). The median follow-up in the entire cohort (n = 26) was 30 months. The cfDNA concentration was not related to the survival time.
Fig. 2
Circulating cell-free DNA (cfDNA) kinetics during treatment. 0, A, B, C – time points in relation to chemoradiotherapy. The dotted line represent the mean cfDNA concentration (±SD) for complete response patients. The solid line represents cfDNA concentration in the case of progressive disease patients
CR – complete response, PD – progressive disease
Discussion
Circulating cell-free DNA (cfDNA), also known as liquid biopsy, refers to DNA released to peripheral blood through apoptosis, necrosis, and active release. Circulating total cfDNA contains both normal and tumor DNA, with inconsistent data on the percentage of the neoplastic DNA fraction. Regardless of the method of detection, most experimental and clinical studies have shown that the tumor cfDNA fraction (circulating tumor DNA, ctDNA) constitutes a small fraction of the total cfDNA, especially in the early stages of cancer [9]. In clinical trials, tumor burden was shown to be the main factor influencing cfDNA concentration. However, there is no consensus as to which CT/MRI/PET imaging parameters allow for the most accurate tumor assessment [10].
We found a correlation between total cfDNA concentration and primary tumor volume, but not the SUVmax of primary tumor or lymph nodes. A similar relationship between baseline cfDNA levels and total tumor volume, also in anal cancer, was identified by Lefèvre et al. [2]. It should be noted that in our study only cases of locally advanced ASCC were analyzed. Morbelli et al. presented a detailed study of the correlation between cfDNA concentration and tumor metabolism, assessed using 18F-FDG PET/CT, in cases of stage IV metastatic lung cancer. Of the eight 18F-FDG PET/CT volumetric and metabolic parameters studied, only the SUVmax of the largest metastatic lesion correlated with the baseline cfDNA level [11].
There are only a few studies in the world literature investigating the relationship between cfDNA kinetics and changes in tumor volume during treatment. In studies of Winther-Larsen et al. [12] and Li et al. [13], no significant correlation was found between cfDNA kinetics and radiographic response. Hyun et al. observed a decrease in cfDNA at the time of the best radiological response in patients with a partial response to treatment, when changes in tumor size during chemotherapy were correlated with the kinetics of total cfDNA [14]. Investigating the kinetics of circulating cfDNA release during chemotherapy of castration-resistant prostate cancer, Kwee et al. found that plasma cfDNA concentration increased during therapy, while PET/CT tumor activity inversely correlated with cfDNA concentration [15]. Post-treatment cfDNA increase is suspected to be associated with necrosis of non-cancerous cells as a result of cytotoxicity. Butler et al. observed cfDNA fluctuations as a result of normal cell death during chemotherapy [16]. On the other hand, Ma et al., suggested that the involvement of hematopoietic cell apoptosis in plasma cfDNA was transient and limited [17].
Apart from divergent results regarding the relationship between cfDNA level and tumor size/activity, the usefulness of cfDNA as a marker for disease monitoring/response to treatment has been repeatedly demonstrated. The results proving the applicability of cfDNA were obtained from studies with different histological types and stages of tumors, with various methods of treatment and methods of cfDNA detection – NSCLC [18], various treatment modalities; chemotherapy in advanced gastric cancer [19]; perioperative cfDNA kinetics in resectable colon cancer [20]; combined treatment of glioblastoma [21]. It should be noted, however, that some of the publications dealing with this issue failed to demonstrate a relationship between cfDNA kinetics and treatment response [22].
Focusing on anal cancer treated with radiochemotherapy, our results showed a different pattern of change in cfDNA levels compared to Lefèvre et al. [2]. In our work, we observed an increase in cfDNA levels after initiation of therapy, a peak at the end of treatment, and a decrease during the follow-up period, while Lefèvre et al. [2] observed the highest level of cfDNA at the beginning of treatment, followed by a decrease in the middle of treatment and after one year of follow-up, with an increase detected at the end of the treatment period. Moreover, Lefèvre et al. also observed an increase in cfDNA levels at the end of treatment in patients with adverse toxic effects [2]. Lockney et al. presented a preliminary report indicating the possibility of using cfDNA as a predictive biomarker of acute and late gastrointestinal toxicity during radiotherapy [23]. It has been shown many times that the range of absolute values of cfDNA is very wide, regardless of the type of tumor and the method of cfDNA detection used. Many preanalytical variables have also been identified that influence the concentration of cfDNA [24]. These data show that at the present stage of knowledge it is not possible to determine a clinically relevant kinetic pattern or cut-off value for cfDNA. Therefore, if we want to consider an increase in cfDNA concentration as a potential marker of recurrence, we must be sure that it is clinically significant. The use of cfDNA for disease monitoring is also used in non-oncological diseases. It has been shown that increased levels of cfDNA may serve as a predictor of mortality in patients with severe traumatic brain injury, sepsis [25] and transplant rejection [26].


