
Summary
Although the currently available clinical evidence demonstrated high consistency between quantitative flow ratio-fractional flow reserve (QFR-FFR) measurements, there was no detailed analysis of potential confounding factors, which may impair diagnostic accuracy of QFR. The present study provides new insights into use of QFR in assessing the functional significance of coronary stenosis. As we have reported, the presence of chronic kidney disease may negatively impact the diagnostic accuracy of QFR, which should be considered in the clinical diagnostic process.
Introduction
According to the latest European Society of Cardiology (ESC) Guidelines on Myocardial Revascularization, functional assessment of intermediate-grade coronary lesions, using wire-based methods, such as fractional flow reserve (FFR) or instantaneous wave-free ratio (iFR), has a class I, level A recommendation [1]. Still, FFR/iFR adoption in daily clinical practice remains rather low and in general does not exceed 5% of all invasive diagnostic examinations [2–5]. This may be related to procedural costs, additional time required to wire the investigated artery, patient’s contraindications to adenosine and last but not least procedure-related complications [6–8]. To overcome these limitations a novel method – quantitative flow ratio (QFR) – has been introduced. It is based on 3D vessel reconstruction from coronary angiography images and computational fluid dynamics. Other methods relying on creating 3D vessel reconstruction to calculate FFR have also been investigated [9].
Aim
Although recently published studies confirmed high diagnostic accuracy of QFR in patients with stable coronary artery disease [10–12], it is still unknown whether some clinical or laboratory factors may increase the discrepancy between QFR and FFR.
Material and methods
Study design
In this retrospective, single-center study we analyzed clinical and laboratory data of patients who underwent QFR and FFR measurements. QFR analysis was performed using the best available invasive coronary angiography (ICA) projections and was subsequently compared with wire-based FFR measurements as the gold standard. QFR was calculated by two independent certified operators. Detailed medical history and laboratory results were collected to investigate whether there are any factors that could potentially influence QFR’s diagnostic accuracy. The Local Ethics Committee approved the study protocol.
Study population
A precise description of the study population has been previously published [10]. We included patients with stable coronary artery disease who underwent FFR and did not meet any of the following QFR exclusion criteria: (1) diameter stenosis of < 30% or > 90%; (2) vessels of < 2 mm of reference diameter; (3) bifurcation lesions with side branch of > 2 mm; (4) lack of two optimal angiographic projections at least 25° apart; (5) location of the target lesion at the ostium of the left main or the right coronary artery; (6) bypass graft supplying the target vessel; (7) overlapping vessels at target segment; (8) too short recordings of projections, which did not allow the end-diastolic phase to be determined; (9) poor image quality.
Wire-based FFR
Coronary pressure wire (St. Jude Medical, St. Paul, Minnesota, US/Volcano, San Diego, California, US) was used to measure FFR according to the standardized protocol. Briefly, after the pressure sensor was introduced to the proximal segment of the coronary artery, calibration and equalization were performed and then the pressure wire was placed distally to the investigated lesion. The position of the pressure sensor was recorded, and maximal hyperemia was induced by intravenous adenosine triphosphate infusion at the concentration of 140 μg/kg/min. The FFR value was determined at the hyperemic plateau, which was defined as at least a 30-second period of stable FFR reading that was observed after at least 1 min of adenosine infusion. The pressure wire was subsequently pulled back to the guiding catheter to exclude excess drift. The accepted drift range was 0.98 to 1.02. All FFR traces were evaluated for achievement of hyperemia, no severe dampening and degree of drift.
Calculation of QFR
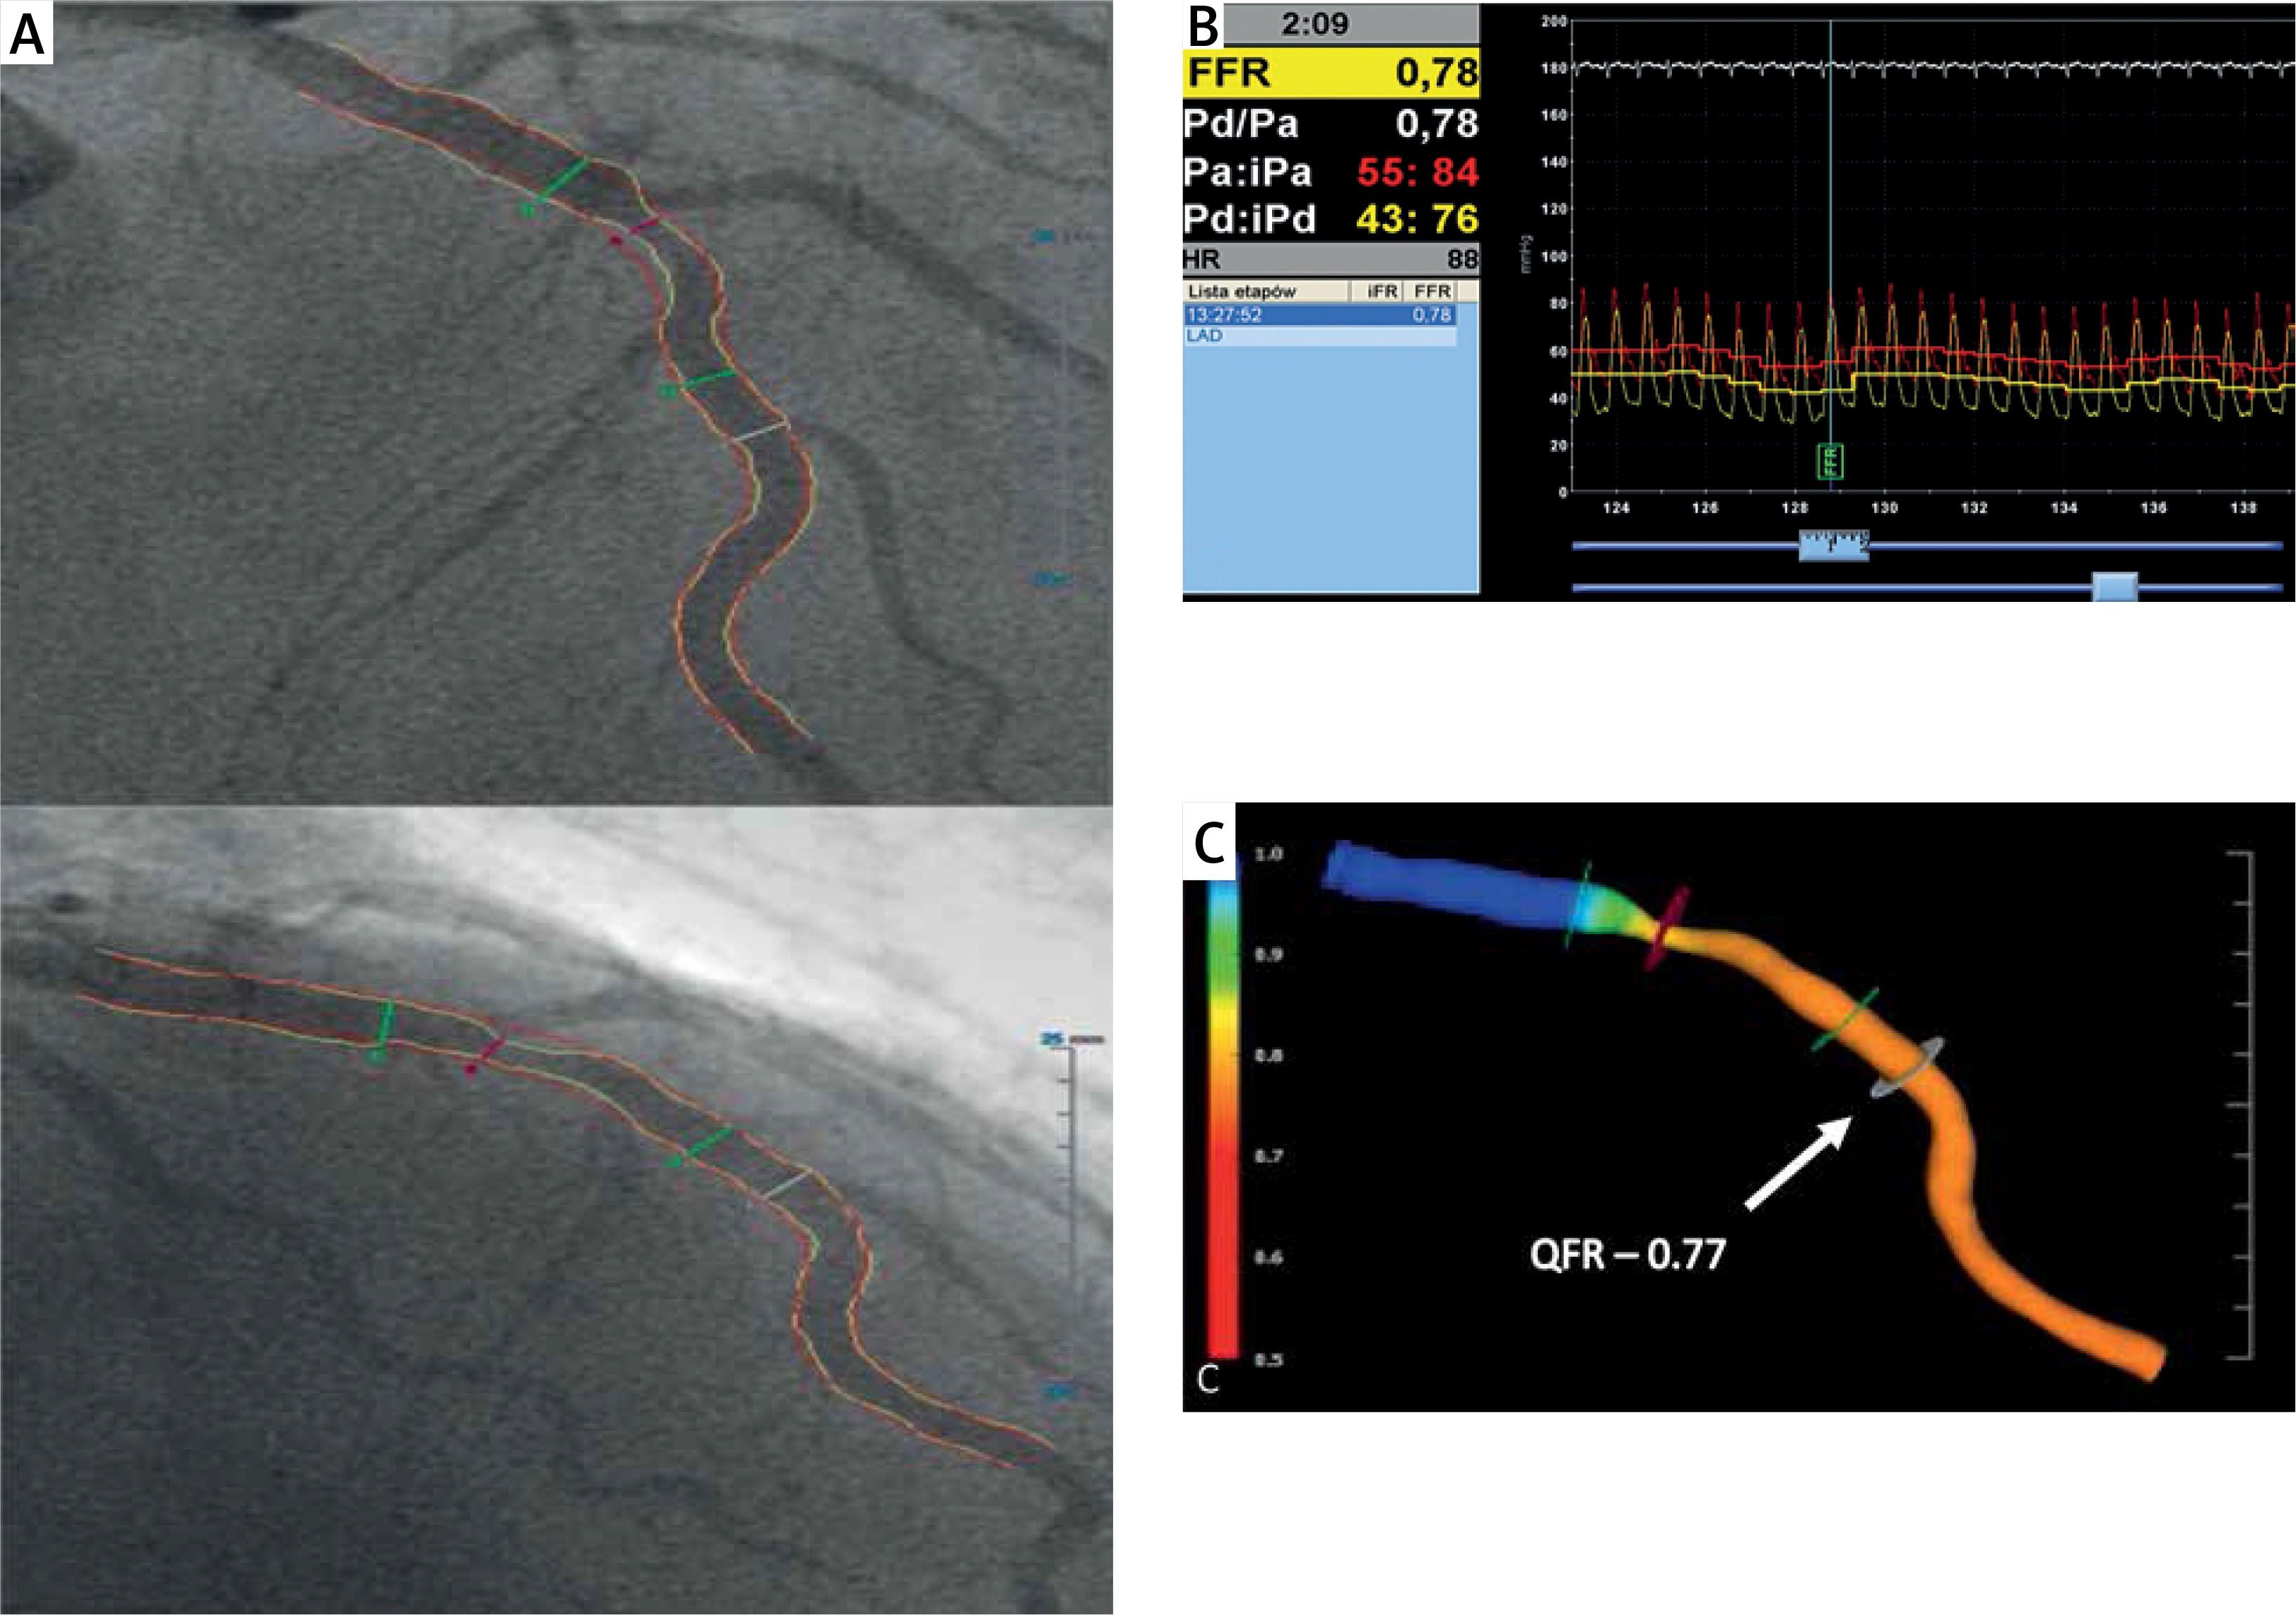
QFR was computed using the Medis Suite XA/QAngio XA 3D/QFR software (Medis, Leiden, the Netherlands) by two independent investigators blinded to FFR results. The investigators were unblinded to the position of the FFR wire. The detailed theory on QFR computation, algorithm used in the software package and contrast-flow estimation were described previously [13]. Briefly, based on automated contouring, a 3D QCA model of the target vessel was reconstructed using two angiographic projections recorded at 15 or 30 frames/s and at least 25° apart. Proximal and distal reference points were used to indicate the region of interest and “flagging” was used to indicate lesion segments. After 3D QCA reconstruction, QFR was computed using TIMI frame count correction (estimated as virtual hyperemic flow velocity based on contrast flow in non-hyperemic conditions using frame count analysis; Figure 1).
Figure 1
Computation of QFR (quantitative flow ratio) from coronary angiography. A – Angiographic projections of the left anterior descending (LAD) artery at > 25° apart. B – Fractional flow reserve measured during intravenous adenosine infusion was 0.78. C – Computed QFR value indicates ischemia (QFR = 0.77). Arrow indicates original location of pressure transducer
FFR – fractional flow reserve.
Statistical analysis
Descriptive parameters are presented as mean ± standard deviation and +95% CI (confidence intervals) or median with range of the minimum and maximum value. Correlation between parameters was calculated using Pearson and Spearman coefficients (r) with 95% CI. The diagnostic efficiency was determined by the AUC (area under the curve) calculated from the ROC (receiver operating characteristic), Cohen’s κ coefficient, classification agreement (categorical concordance between QFR and FFR using a defined cutoff for both techniques) and other statistical measures of the performance such as accuracy, sensitivity, specificity, positive predictive value (PPV), negative predictive value (NPV) and likelihood ratios.
To determine the significance of the differences between parameters, Student’s t test or the Mann-Whitney U-test was used (depending on the normality of the results and equality of the variances). The statistical significance level was p < 0.05. All statistical analyses were performed using R software.
Results
Out 740 screened patients, we included 196 patients. The details for exclusion of 544 patients have been previously published [10]. They were mostly male (76%), with mean age 66.4 ±10.1 years. The study population consisted of stable coronary disease patients with typical coexisting risk factors and a history of previous coronary episodes. Detailed population characteristics are presented in Table I.
Table I
Population characteristics
| Parameter | Mean ± SD or n (%) |
|---|---|
| Age [years] | 66.4 ±10.1 |
| Gender (M/F) | 149/47, male: 76% |
| AF/Afl | 33 (17) |
| Hypertension | 149 (76) |
| Dyslipidemia | 108 (55) |
| DM | 53 (27) |
| Insulin-treated DM | 21 (11) |
| CKD | 32 (16) |
| PAD | 26 (13) |
| Family history of CAD | 21 (11) |
| TIA/stroke | 15 (8) |
| History of PCI | 118 (60) |
| History of CABG | 5 (3) |
| History of MI | 98 (50) |
| Smoking | 57 (29) |
| Heart failure | 37 (19) |
| Drugs: | |
| Beta-adrenolytic | 184 (94) |
| Ca-blocker | 52 (27) |
| Nitrate | 17 (9) |
| Antiarrhythmic | 8 (4) |
| Digoxin | 1 (1) |
| ACE-I | 139 (71) |
| ARB | 30 (15) |
| Aldosterone antagonist | 24 (12) |
| Statin | 177 (90) |
| Ejection fraction (%) | 52.6 ±11.2 |
| Hemoglobin [g/dl] | 13.6 ±1.4 |
| Hematocrit (%) | 40.4 ±4.1 |
| Platelets [× 103/mm3] | 208.5 ±58.0 |
| Sodium [mmol/l] | 141.5 ±3.02 |
| Potassium [mmol/l] | 4.38 ±0.4 |
| Creatinine [mmol/l] | 0.2 ±0.4 |
| eGFR [ml/min/1.73 m2] | 43.17 ±12.39* |
| eGFR > 60 ml/min/1.73 m2 | 137 (70) |
M – male, F – female, AF – atrial fibrillation, Afl – atrial flutter, DM – diabetes mellitus, CKD – chronic kidney disease, PAD – peripheral artery disease, CAD – coronary artery disease, TIA – transient ischemic attack, PCI – percutaneous coronary intervention, CABG – coronary artery bypass grafting, MI – myocardial infarction, Ca-blocker – calcium channel blocker, ACE-I – angiotensin converting enzyme inhibitors, ARB – angiotensin II receptor blockers, eGFR – estimated glomerular filtration rate.
The QFR has been successfully calculated in all patients. The mean computation time for analysis was short and equaled 4 min 2 s (interquartile range: 3 min 28 s – 4 min 15 s). There was a good agreement within and between the calculations performed by two independent observers, with a mean inter-observer variability of 0.011, 95% CI: –0.08 to 0.14 and inter-observer agreement (Cohen’s κ 0.79). Most of the 206 intermediate lesions included in the analysis were located in the left anterior descending (112 lesions) and right coronary artery (55 lesions). In the circumflex artery were located 21 lesions, in the marginal branch 11, in the diagonal branch 3, and in the left main 4 lesions. The mean angiographic percentage diameter stenosis was 52.7 ±11.7% with a mean area stenosis 61.8 ±29.4% mm2, which was classified as intermediate stenosis severity. The mean proximal and distal reference diameters were 3.1 ±0.4 mm and 2.4 ±0.3 mm, respectively. In 157 (76%) vessels the angiograms were recorded at the speed of 15 frames per second (fps), 47 cases at 30 fps (23%) and 2 (1%) cases at 7 fps.
In the total study population, the mean QFR value was 0.768 and it differed significantly from the mean FFR value (0.799) (p < 0.001). Functionally significant stenoses were observed according to FFR (FFR ≤ 0.80) in 127 (62%) vessels. The best criterion value of QFR in assessing the FFR-based functional stenosis severity was ≤ 0.81; according to this cutoff value there were 133 (65%) patients. Classification agreement between the two methods was high at 75%. Similarly, the correlation (r = 0.780, p < 0.05) between QFR and FFR was also high.
However, we identified two subgroups of patients in whom there was a significant difference between QFR and FFR values (Table II). These included patients with insulin-treated diabetes mellitus (ITDM; –0.059 ±0.07 vs. –0.027 ±0.074; p = 0.039) and chronic kidney disease (CKD; –0.062 ±0.031 vs. –0.025 ±0.068; p = 0.027). Box-plots for ITDM and CKD are presented in Figure 2. Presence of CKD was associated with a decrease of the diagnostic QFR efficiency in detecting ischemia generating lesions (AUC = 0.67, 95% CI: 0.46–0.88 vs. AUC = 0.89, 95% CI: 0.84–0.94, p = 0.05, Figure 3). Classification agreement (72% vs. 75%, p = 0.87) and correlation (r = 0.63 vs. 0.79, p = 0.10) were numerically lower among CKD patients (Figure 4). After exclusion of ITDM and CKD patients the difference between mean QFR (0.78) and mean FFR (0.80) was statistically not significant (p = 0.08) but there was a significant correlation between these two measures of 0.792 (p < 0.05).
Table II
Factors which may have influenced the difference between QFR and FFR values
[i] M – male, F – female, AF – atrial fibrillation, Afl – atrial flutter, DM – diabetes mellitus, CKD – chronic kidney disease, PAD – peripheral artery disease, CAD – coronary artery disease, TIA – transient ischemic attack, PCI – percutaneous coronary intervention, CABG – coronary artery bypass grafting, MI – myocardial infarction, eGFR – estimated glomerular filtration rate.
Figure 2
Difference between QFR and FFR values for patients without (0) and with (1) diagnosis of insulin- treated diabetes mellitus (DM) or chronic kidney disease (CKD)
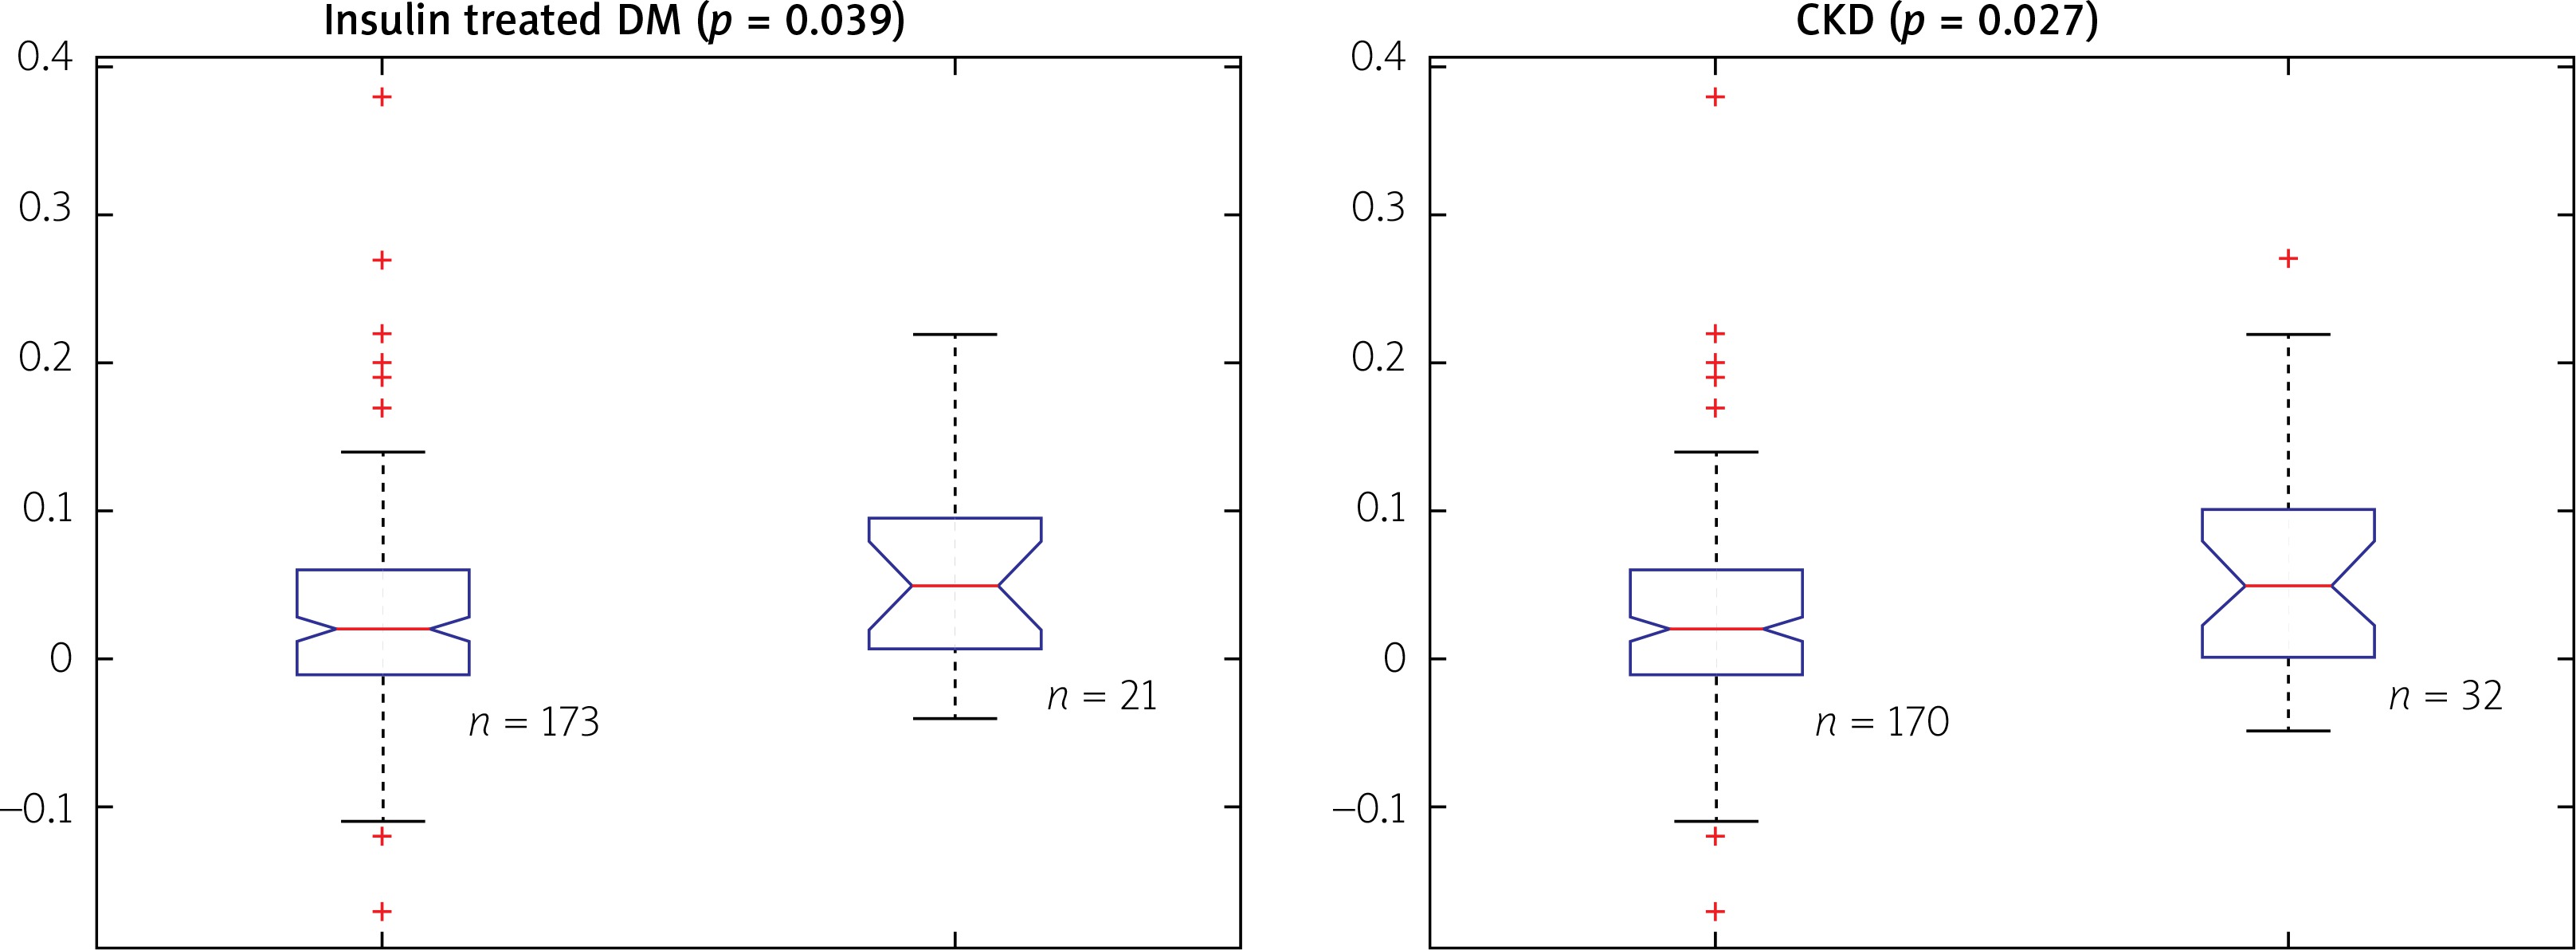
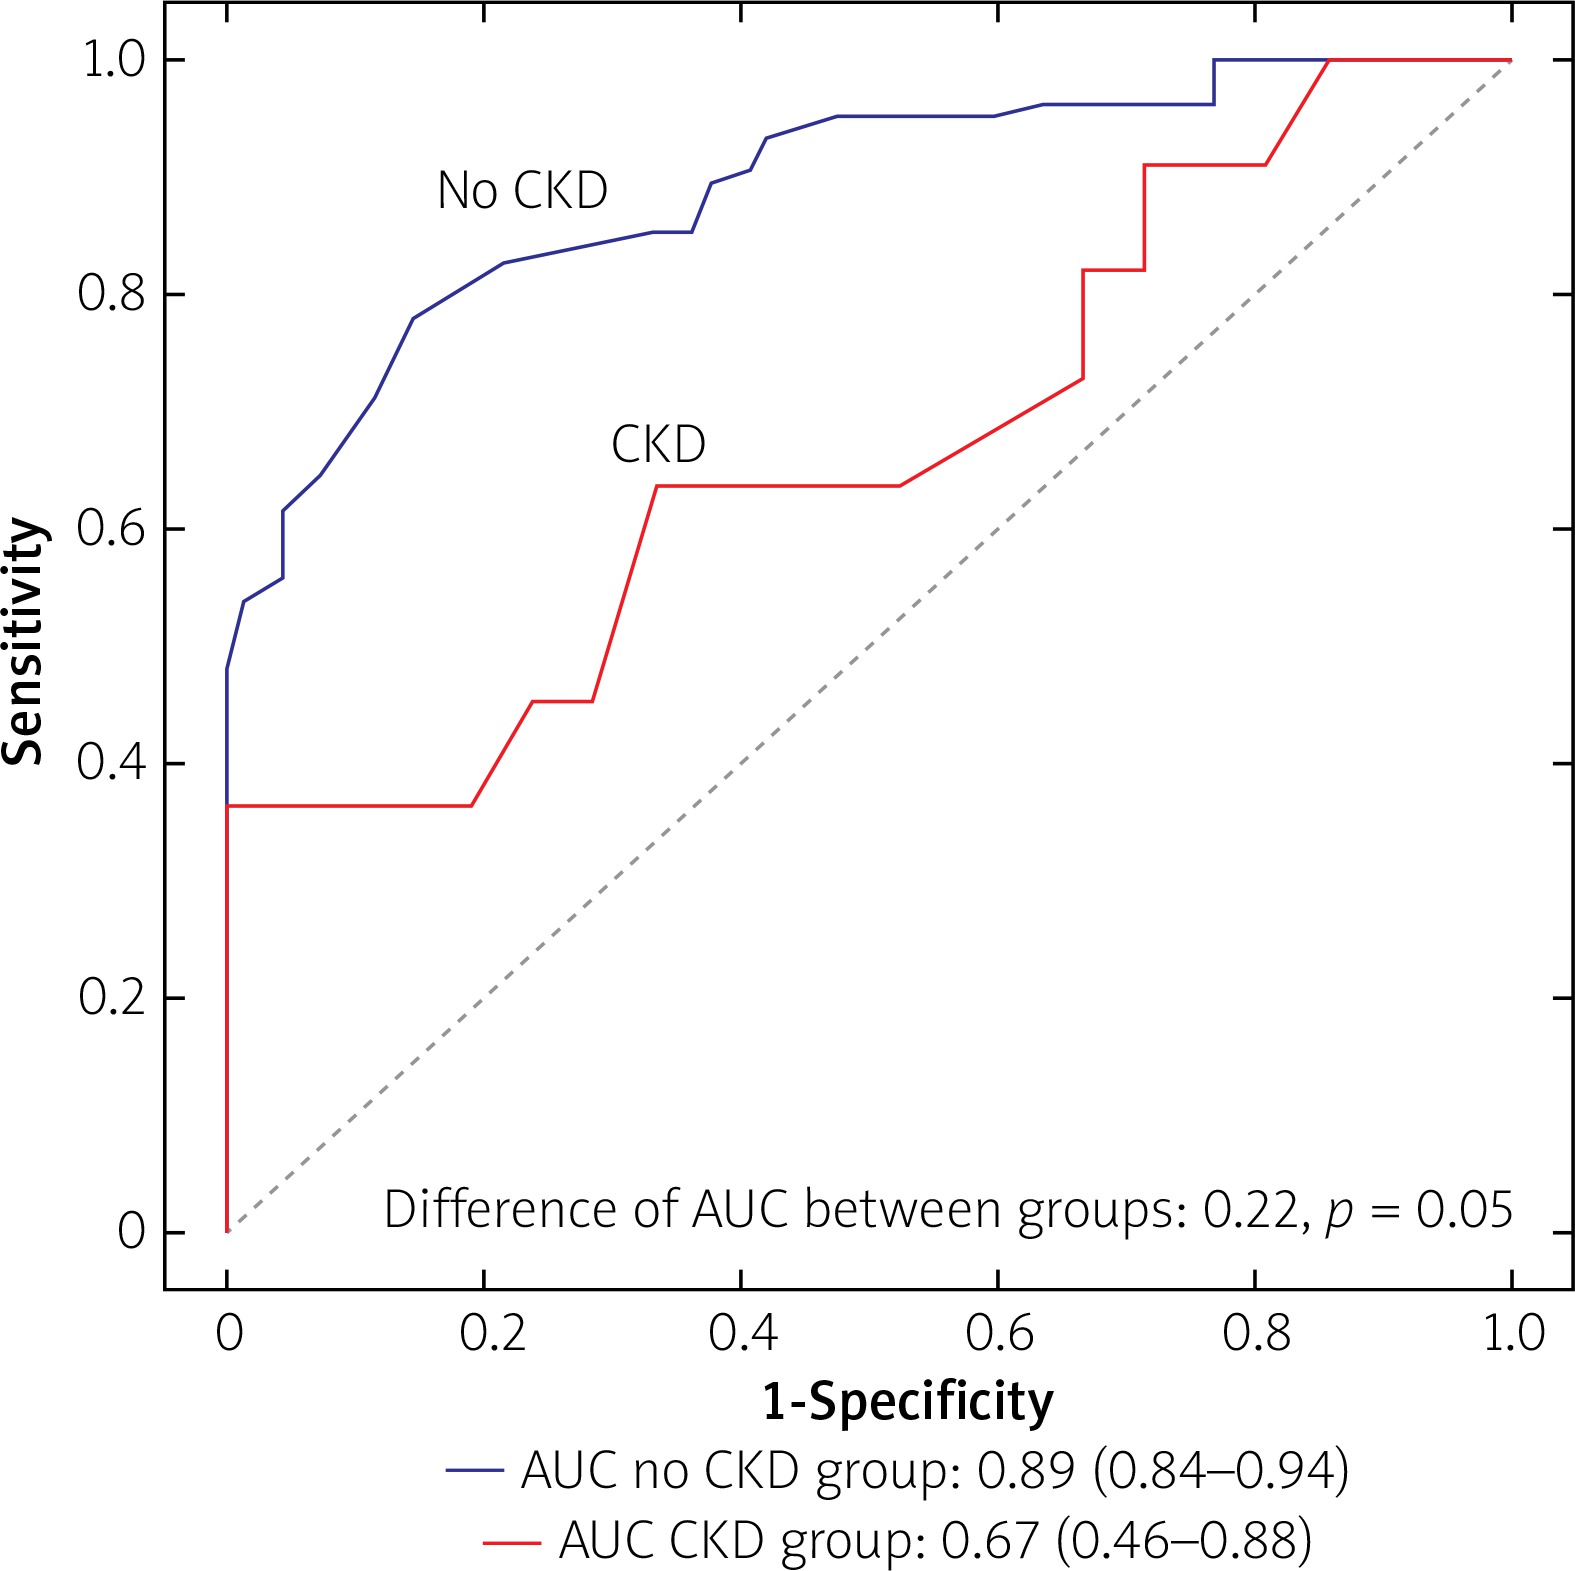
Figure 4
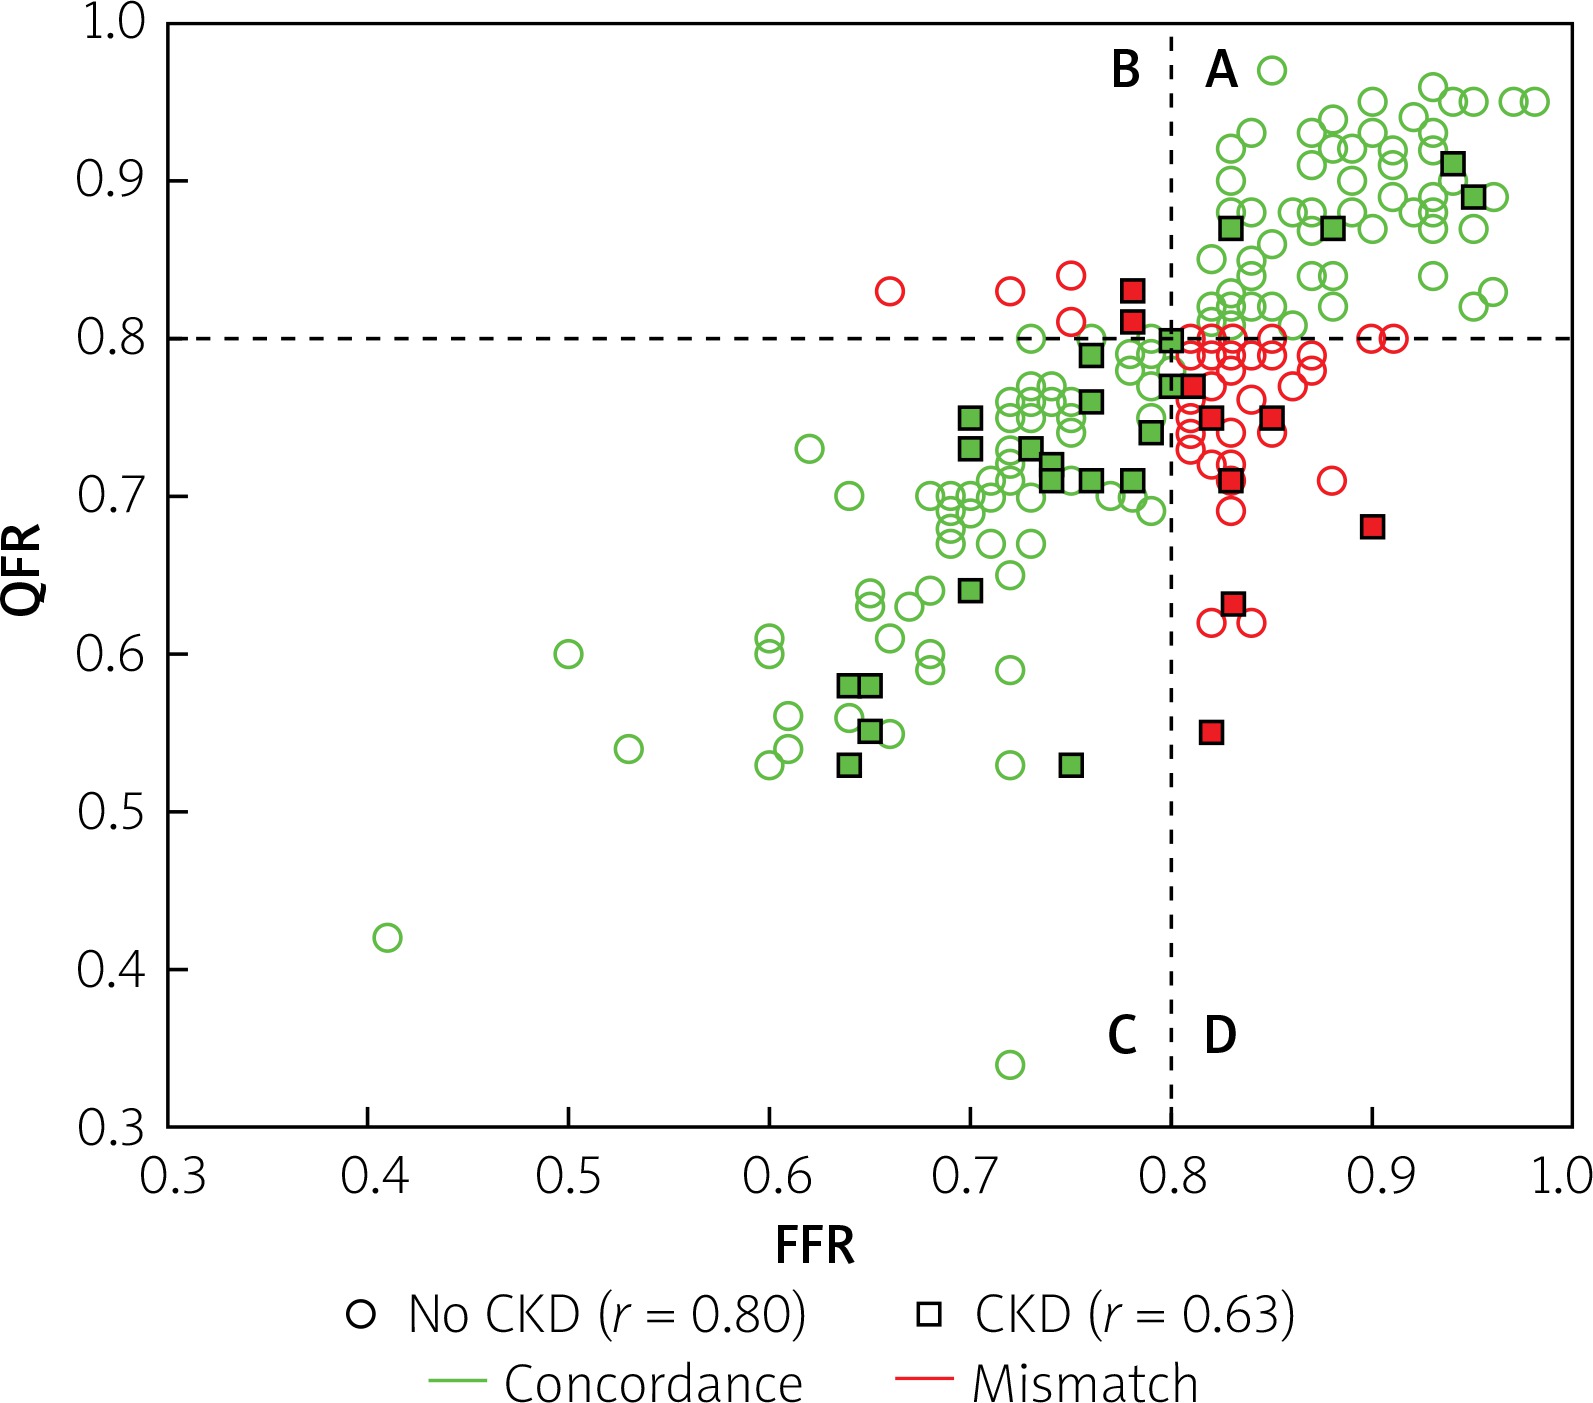
Impact of chronic kidney disease (CKD) on correlation and classification agreement between quantitative flow ration (QFR) and functional flow reserve (FFR). Correlation was numerically lower in patients with CKD (squares, r = 0.63) as compared with patients without CKD (circles, r = 0.80; p = 0.10). Classification agreement between QFR and FFR (quadrants A + C, green symbols) was observed in 75%
Analysis of laboratory parameters revealed that hemoglobin concentration and hematocrit level correlate with QFR and FFR mismatch, although this association is weak (r = –0.18 for both variables; Table III).
Table III
Correlations between difference between QFR and FFR, and clinical data and laboratory results
| Parameter | Number of patients | Pearson’s correlation coefficient | Spearman correlation coefficient |
|---|---|---|---|
| Age | 202 | –0.01 | –0.01 |
| Ejection fraction | 137 | –0.09 | –0.03 |
| Hemoglobin | 199 | –0.10 | –0.18* |
| Hematocrit | 199 | –0.08 | –0.18* |
| Platelets | 199 | –0.09 | –0.14 |
| Sodium | 199 | –0.03 | –0.08 |
| Potassium | 199 | –0.03 | –0.03 |
| Creatinine | 199 | 0.11 | 0.12 |
| eGFR | 49 | –0.19 | –0.13 |
Discussion
Although the currently available clinical evidence has demonstrated high consistency between QFR and FFR measurements, scarce data are available on potential confounding factors, which may impair the diagnostic accuracy of QFR. The present study provides new insights into use of QFR in assessing the functional significance of coronary stenosis. As we have reported, the occurrence of CKD may negatively impact the diagnostic accuracy of QFR, which should be considered in the clinical diagnostic process.
We hypothesize that the discrepancies between FFR and QFR in the CKD cohort could be explained by the presence of microcirculatory resistance [14, 15]. The fact that CKD affects the coronary microcirculation and impairs coronary vasodilator capacity has already been reported [16, 17]. Tebaldi et al. found that the index of microcirculatory resistance was significantly higher in patients with creatinine clearance (CrCl) ≤ 45 ml/min, as compared to controls with CrCl > 45 ml/min (32 U (28–45) vs. 16 U (11–20), p < 0.01). The authors also observed significantly higher occurrence of impaired index of microcirculatory resistance in patients with CrCl ≤ 45 ml/min when compared to controls (90% of patients vs. 10% of patients; p = 0.03) [18]. Additionally, it was found that in the case of non-ischemic FFR values (> 0.80), low coronary flow reserve and high index of microcirculatory dysfunction were associated with the highest occurrence of patient-orientated composite outcome (any death, myocardial infarction and revascularization) during follow-up. A recently published study proved that in the case of abnormally high microcirculatory resistance the classification agreement and diagnostic efficiency of QFR are significantly lower. A high index of microcirculatory resistance and presence of acute coronary syndrome were identified as independent predictors of misclassification between FFR and QFR [19]. The lack of significant impact of ITDM on the QFR-FFR mismatch could potentially be explained by the fact that microcirculation dysfunction is not that common in the well-treated diabetes population [20]. Furthermore, the prevalence of diabetes in patients with microcirculation dysfunction was shown to be similar to those without it [19].
These findings are in line with our outcomes and could result from the differences in QFR and FFR methodology. The key dissimilarities between the estimated and actual hyperemic pressure ratio derive from the fact that in the case of FFR this ratio is influenced by the increase in the coronary flow caused by microcirculatory dilatation achieved during hyperemia. By contrast, in QFR, being a CFD-based technique, fixed boundary conditions with some adjustments based on TIMI frame count correction are assumed. Still, patient-specific modification of coronary flow in response to a hyperemic agent is not fully accounted for, which is why the microcirculatory dysfunction may impact the QFR measurements. This was raised in a recently published study, in which the authors found that the overall diagnostic efficiency of QFR was improved when the frame count correction was applied. However, in the case of microcirculatory dysfunction this correction did not provide sufficient adjustment, which resulted in an increased QFR-FFR gap [19].
QFR, being a novel wire-free method, has recently emerged as a promising tool for functional evaluation of intermediate coronary lesions. The scientific evidence published so far provided promising CoreLab data that showed a good correlation with the wire-based FFR. In the prospective, observational, multicenter FAVOR (Functional Assessment by Various Flow Reconstruction) pilot study the QFR improved the diagnostic accuracy of 3-dimensional quantitative coronary angiography (3D-QCA). QFR did not require pharmacologic hyperemia induction and was calculated in cath lab settings within a few minutes. These analyses and findings were further confirmed in larger international studies [11, 12]. For instance, results from one of the largest trials, FAVOR II China (Functional Diagnostic Accuracy of Quantitative Flow Ratio in Online Assessment of Coronary Stenosis), showed that QFR improves diagnostic accuracy of invasive coronary angiography (ICA) and in reference to FFR has high sensitivity (94.6%), specificity (91.7%), positive predictive value (PPV = 85.5%) and negative predictive value (NPV = 97.1%) [21]. Similarly, in our experience the use of QFR in everyday clinical practice independently from CoreLab analysis confirmed that QFR can be performed in a short time maintaining a high diagnostic accuracy and sensitivity [10].
This was a retrospective study; thus, the angiograms were not recorded according to QFR image acquisition guidelines. However, the inclusion criteria precluded cases with poor quality images and deficient contrast filling. Some relevant hemodynamic variable such as left ventricular ejection fraction (LVEF) and left ventricular diastolic pressure (LVDP) were not available and collected. Because of the unclear influence of these parameters on FFR, we cannot rule out their contribution to discrepancies between QFR and FFR. We cannot be certain that patients did not consume caffeine within the previous 24 h prior to the physiological assessment, which could have influenced FFR values. The detailed medical history, as well as laboratory data, was also retrospectively obtained, which may have further affected results. Last but not least, the study population was rather small. Large-scale, prospective studies are needed to reconfirm our findings.
Conclusions
To the best of our knowledge, this is the first study assessing the influence of laboratory data and detailed medical history on the discrepancy between QFR and FFR values. We proved that although the general diagnostic accuracy of QFR is high, the use of this novel, wire-free, image-based technique for detection of significant ischemia may be limited in CKD patients.


