
Introduction
Studies show that the involutional changes observed in the course of aging dramatically increase during the postmenopausal period. Not only is it a time of cessation of reproductive functions but it also involves a series of accompanying hormonal changes that profoundly affect the functioning of the whole organism. The list of possible consequences, including a substantial decrease of oestrogen level, also covers changes in the body composition. The typical clinical overview comprises an increased bone resorption process, continuing dysfunction of skeletal muscles (drop in muscle mass and muscle strength) as well as an increase in body fat [1].
Observing biomechanical interactions through para-, auto- and endocrine processes between bone and muscle tissues encouraged the authors to establish a definition of the bone-muscle unit concept [2]. The literature provides a range of scientific evidence confirming mutual dependencies between the above-mentioned tissues. The study by Schipilow et al. revealed a correlation between the quality of the bone and muscle mass [3]. Many studies provide proof of the relation between skeletal muscle mass and bone mineral density (BMD) [4–7]. A continuous effect of endo- and exogenic factors on bone and muscle tissues makes them responsible for the process of their development as well as their involutionary changes. The quality of bone and muscle tissue along with their mutual dependence might lead to either so-called “healthy aging” or to a gradual regression recognised by some authors as “sarcoporosis” (or “sarco-osteoporosis”) [2]. It is estimated that a long lasting dominance of resorption over bone forming processes, ongoing for decades, might cause an approximate loss of 55–60% of trabecular bone and 35–40% of cortical bone [8]. At the same time, the estimated loss of muscle mass in the age group of 40–80 years of age is expected to be 30–60% [9]. A steady decrease in muscle strength was also reported by different authors. For people aged 50 and older an average annual decrease of 1.5% in muscle strength had been reported. Same authors claim that the loss increases up to 3% per year for those 60 years of age and older [10]. The average value of muscle strength loss, assessed via handgrip, for women aged 65 or older was 1.239 kg per year [11]. It is without doubt that both bone (BMD) and muscle (mass, strength and function) disturbances are mutually responsible for an increased risk of fractures, disability (leading to dependence) and a decreased quality of life [12].
For the past decade researchers have expressed a great deal of interest in analysing the potential relation between the musculoskeletal unit and adipose tissue. A high percentage of fat tissue accompanied by low muscle mass and strength is currently recognized as the “osteosarcopenic obesity syndrome”. Consequences of the syndrome include increased fracture risk and disability followed by a higher mortality risk. Researchers claim that a high content of fat tissue in an aging organism is a result of a 5–25% decrease of the basic metabolism, starting shortly after 30 years of age. The process is more sudden in women within the postmenopausal period, partially due to the drop in oestrogen activity, leading to up to 1/3 growth of fat tissue [13]. Postmenopausal women are more susceptible to central obesity (abdominal) as a result of fat tissue collection in the abdominal area. The average value of visceral fat in women is estimated at 1.4 l, but with time it might rise to 2.5 l. Subcutaneous adipose tissue is usually not liable for major age-related changes and remains stable at an average of 23.7 l. It should be highlighted that abdominal obesity is included as an element of the metabolic syndrome which predisposes to adverse metabolic and cardiovascular complications [14]. Therefore it is vitally important to emphasize scientific publications presenting interactions between the above-mentioned tissues. Since the number of such papers is relatively small, the authors decided to conduct a study on the topic of interaction between the musculoskeletal unit and adipose tissue.
The study was aimed at identifying a possible relation between the adipose tissue content and different parameters of the musculoskeletal unit in a group of postmenopausal women.
Material and methods
This study was conducted in accordance with the principles of the Helsinki Declaration of the World Medical Association after the appropriate consent from the Bioethics Committee (Medical Chamber in Cracow nr 113/KBL/OIL/2014 from 12th of December 2014) had been obtained from the patients of Cracow Medical Centre (KCM). Inclusion criteria were sex (women), age (≥ 50), being after menopause, signing the informed consent form, and having the complete set of data required by the study protocol (medical questionnaire, total body composition, BMD spine and/or hip, TBS, handgrip). Exclusion criteria included: withdrawn participation consent, aphasia or cognitive impairment (preventing communication), and metal prosthesis. Nine women initially recruited to the study group were excluded from the study sample.
A total of 120 postmenopausal women, with the complete data/examinations required by the study protocol, were enrolled in the study. The group was characterised by an average age of 69 years (59–81; SD 5.3), menopause age of 50.3 (28–60; SD 4.9) and body mass index (BMI) of 27.6 kg/m2 (17.2–36.7; SD 4.9). Following the World Health Organization guidelines on BMI, patients could be classified as underweight (BMI < 18.5, 2 cases, 1.7% of the group), normal weight (18.5–24.9, 36, 30%), overweight (25–29.9, 39, 32.5%), class 1 obese (30–34.9, 35, 29.2%) or class 2 obese (≥ 35, 8, 6.7%). Every patient who participated in the study had all their tests done in the Cracow Medical Centre in one day, scheduled suitably for the patient, within the time period of 8 a.m. to 4 p.m.
The study protocol required every participant to fill out a questionnaire on their basic demographic and anthropometric data followed by past and ongoing medical conditions. The questionnaire included information on the occurrence of fragility fractures in the past and falls in the last 12 months that preceded the study. All patients underwent the measurement of body height and weight using a calibrated stadiometer. This was followed by an assessment of the patient’s body composition (adipose, bone and muscle tissues). All densitometric examinations were carried out on the same apparatus, by one experienced technician using total body composition (TBC) analysis (Hologic, Horizon W, Bedford, USA). The total body composition module enables the assessment of selected parameters that characterise muscle tissue [appendicular skeletal muscle mass (ASMM)/height2 – appen.lean/height2 – kg/m2] as well as adipose tissue [visceral adipose tissue area (VAT) cm2, total % body fat and fat mass/height2]. The efficiency of the ASMM/height2 index for the assessment of the muscle system has been previously confirmed by Bering et al., Kołodziej et al. as well as Warzecha et al. [15–17]. Additional information on the muscle tissue was collected using a hydraulic dynamometer (Baseline 12–0240, NY, USA) which allowed us to assess the handgrip muscle strength of the patients. Handgrip assessment was conducted in a standing position with the elbow joint of the tested limb bent to 90° and the forearm in a neutral position. Every patient had 2 try-outs and the better one was included in the following study. Additionally every patient underwent BMD assessment in accordance with the methodology recommended by the International Society for Clinical Densitometry in specific locations such as the lumbar spine (L1–L4) and/or femoral neck. All dual-energy X-ray absorptiometry (DXA) scans were taken on the same device as TBC assessment. Bone mineral density spine scan was supplemented by an indirect assessment of bone structure using a Trabecular Bone iNsight application (TBS; vr. 2.0). TBS reference values were taken after the metanalysis of McCloskey et al. [18].
Statistical analysis was conducted using the ROOT program (ROOT – An Object Oriented Data Analysis Framework, Rene Brun and Fons Rademakers), R package (R Foundation for Statistical Computing, Vienna, Austria) and Microsoft Excel (Microsoft Office 365, Microsoft Corporation, Redmond, WA). Statistical tests used in the analyses included: Student’s t-test, Shapiro-Wilk, Fisher-Snedecor and Mann-Whitney U tests. Correlations were assessed using Pearson’s coefficient. Values of p < 0.05 were considered statistically significant.
Results
The analysis of the content of adipose tissue in the studied group revealed an average values of 154.7 cm2 for VAT area (25.6–336; SD 69.3), 43.5% for the percentage of adipose tissue in the body (total body % fat; 27.1–54.6, SD 5.7) and 12.1 kg/m2 for body fat mass in relation to height (fat mass/height2; 4.7–19; 3.4). Complete group characteristics including the analysed parameters of musculoskeletal unit are presented in Table 1.
Table 1
Characteristics of the study group
All parameters of the fat tissue had a stronger correlation with BMI (VAT area r = 0.788, total body % fat r = 0.786, fat mass/height2 r = 0.937; all p < 0.001) than muscle (appen.lean/height2 index r = 0.756, p < 0.001) or bone tissue (BMD neck r = 0.339, BMD spine 0.317, both p < 0.001) .
On the basis of the acquired BMD results, following the valid diagnostic criteria (t-score ≤ –2.5), over a half of the women in the study group were identified as osteoporotic (51.6%, n = 62). Furthermore, a vastly degraded bone microarchitecture (TBS < 1.23) was observed in 70% of the subjects (n = 84) [18, 19]. Using the EWGSOP 2018 (European Working Group on Sarcopenia in Older People) diagnostic criteria, reduced muscle mass was found in 31.6% (n = 38) of patients and low handgrip (< 16 kg for women) in 25.8% (n = 13) [20]. In-depth analysis of the collected questionnaires showed that 1 in 2 women (50.4%, n = 60) had a history of fractures, of which 33% (n = 39) were classified as low-energy incidents. Additionally, 27.7% of the respondents reported a fall within the last 12 months.
Our studies revealed a significant, yet weak correlation between BMD spine and visceral fat (r = 0.213, p < 0.01) as well as fat mass/height2 index (r = 0.259, p < 0.001). The total body % fat did not correlate with BMD spine. All the analysed fat parameters (VAT area, total body % fat, fat mass/height2) significantly correlated with BMD neck, but all correlations were considered weak (Table 2).
Table 2
Correlations between parameters of adipose tissue and parameters of the musculoskeletal unit in a group of postmenopausal women
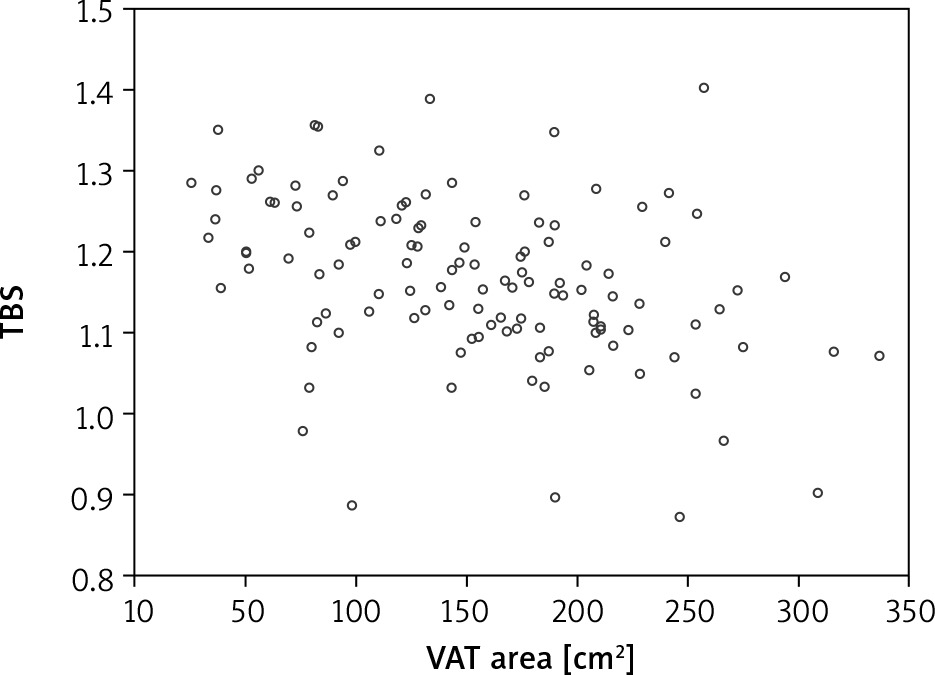
Although densitometric tests using DXA allow for the assessment of bone density loss, they lack information on the possible degradation of the bone microarchitecture, whereas TBS provides such data. Therefore the authors decided to take an additional parameter – TBS – into consideration. The results revealed a weak but significant correlation between TBS and fat mass/height2 as well as total body % fat (r = 0.279 and 0.259 respectively) (Table 2). Stronger dependence was observed in relation to VAT area (r = –0.385, p < 0.001) as depicted in Figure 1.
Fig. 1
Correlation between trabecular bone score and visceral adipose tissue area in a group of postmenopausal women
TBS – trabecular bone score, VAT – visceral adipose tissue
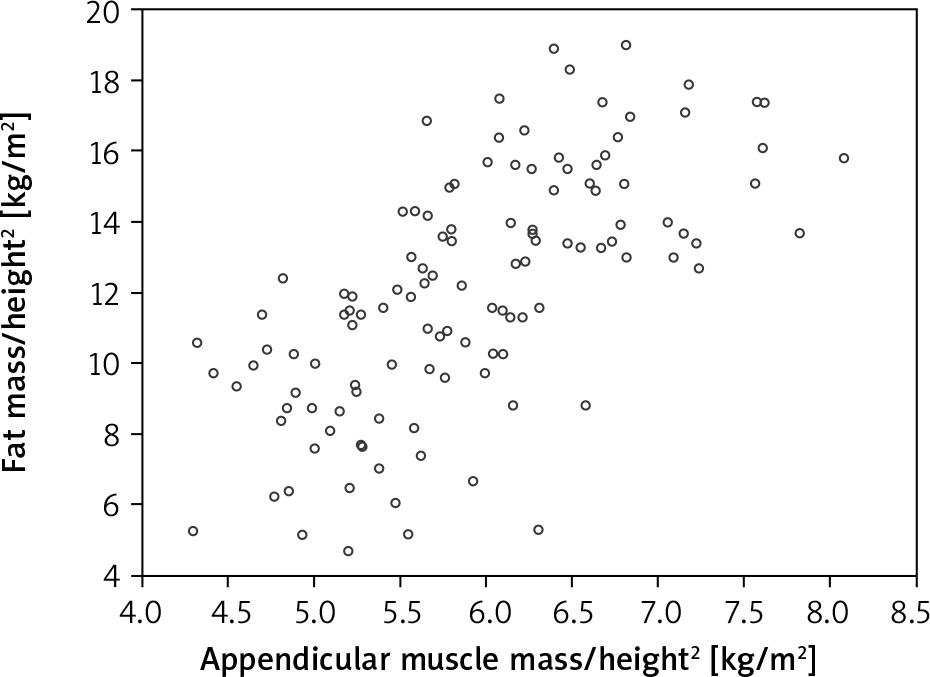
Further statistical analysis carried on the study group showed an additional dependence between the parameters of the adipose tissue and appen.lean/height2 index derived from the muscle tissue. The strongest correlation was identified in reference to the VAT area and fat mass/height2 index (respectively r = 0.589 and 0.658, both p < 0.001) (Fig. 2, 3). When the total body % fat was considered, the correlation was found to be moderate (r = 0.36; p < 0.001) (Fig. 4). At the same time it should be emphasized that the authors did not find a connection between muscle strength (assessed with handgrip) and the analysed parameters of adipose tissue (Table 2).
Fig. 2
Correlation between appendicular muscle mass/height2 index (appen.lean/height2) and visceral adipose tissue area in a group of postmenopausal women
VAT – visceral adipose tissue
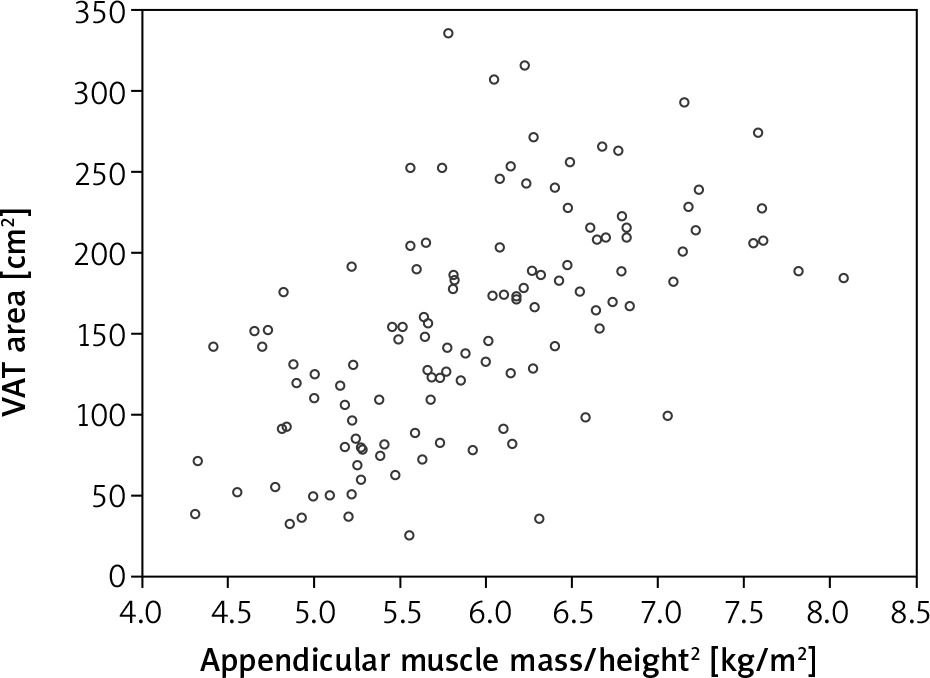
Fig. 3
Correlation between appendicular muscle mass/height2 index and the percentage of fat tissue in the body (total body % fat) in a group of postmenopausal women
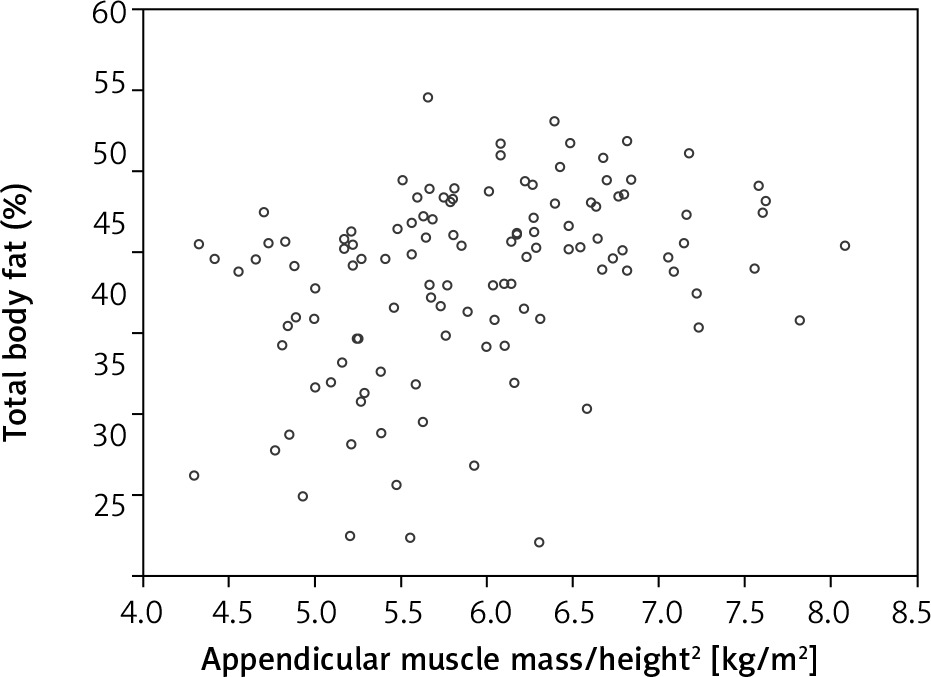
Fig. 4
Correlation between appendicular muscle mass/height2 index (appen.lean/height2) and adipose tissue/height2 index (fat mass/height2) in a group of postmenopausal women
The next stage of the analysis involved the parameters of the adipose tissue and information on fragility fractures collected via the questionnaire. Half of the women in our study group reported to have sustained a fracture in the past – 39 of those cases (32.5% out of 120 women) were identified as a low energy fracture. Our study did not reveal any statistically significant differences, in terms of the analysed adipose tissue, between those with and without fragility fractures (Table 3). A similar lack of results was observed in relation to falls reported within the last 12 months that preceded the study. We did find a significant difference between those groups in relation to appen.lean/height2 but it was barely noticeably and therefore clinically irrelevant.
Table 3
Adipose tissue parameters in postmenopausal women divided into groups with and without fragility fractures
Discussion
Our study provides evidence that higher content of adipose tissue is correlated with greater muscle mass in a group of women within the postmenopausal period. The authors found a significant correlation between the parameters of adipose tissue (VAT area, total body % fat, fat mass/height2) and appen.lean/height2 index, aka ASMM (respectively r = 0.589, 0.359, 0.658). Our results found confirmation in the work of other authors such as Schautz et al. where the study group constituted 1737 patients – men and women between the age of 11–84 years [21]. Weber et al. using a much larger study sample (14850 patients) also identified a strong correlation (r > 0.5) between fat mass index (FMI – fat mass/height2) and ASMM (appen.lean/height2) [22]. It should be acknowledged that our study did not find any evidence for a relation between analysed adipose tissue parameters and muscle strength, assessed with handgrip. Using data from the study of 1511 patients (men and women), Cooper et al. pointed out that an increase in muscle and fat mass (BMI) does not correlate with equal growth in muscle strength [23]. These results, followed by our own study, suggest that even if there is growth in muscle mass, in postmenopausal women, it is very unlikely that it will improve the quality of muscle tissue. From a clinical point of view, these dependencies between adipose and muscle tissue are of great importance for postmenopausal women. Due to their susceptibility to the growth of fat tissue, it is recommended to implement appropriate measures regarding the prophylaxis of sarcopenia (by improving the quality of the muscle tissue) and other related health risks typical for this group of women.
Our study revealed a significant correlation between the parameters of adipose tissue and trabecular bone score (TBS). In fact, the dependency was stronger in reference to TBS than to BMD (both BMD neck and spine). The most relevant parameter was considered to be VAT area (r = 0.385, p < 0.001). A number of published studies have reported that high content of fat tissue might have a protective effect on the loss of bone mass in postmenopausal women [24, 25]. It their research Ng et al. (509 study subjects) found a correlation between BMD spine (r = 0.33), BMD neck (r = 0.4), number of bone trabeculae (trabecular BMD, mg/cm3) in the spine (r = 0.35) as well neck (r = 0.37) and total body fat (TBF, kg) [26]. A variety of studies have shown that by acting on its endocrine function, adipose tissue directly affects the bone tissue, by being the main source of oestrogens after the menopause [24, 25, 27]. Therefore postmenopausal women with low body fat content are more likely to be at risk of a low oestrogen level, which consequently affects the quality of the skeletal system [28]. According to Gower et al., women with obesity are far less likely to be diagnosed with osteoporosis then those with normal BMI [29]. In their meta-analysis Bivier et al. state that obese people are usually characterised by a BMD within the normal range [30]. Our study is in accordance with these results. It revealed a significant correlation between the adipose tissue parameters (fat mass/height2 index, VAT area) and BMD (spine and neck). Postmenopausal women with higher content of fat tissue are characterised by a greater BMD. There was however one exception – total body % fat vs. BMD spine – which did not give a significant correlation.
Conversely to be above-mentioned results, there are studies which prove that muscle tissue has a more significant effect on BMD than adipose tissue [31]. As has been established, increased fat content may decrease the risk of osteoporosis when accompanied by a substantial amount of muscle tissue. According to Hwang et el. (2475 women) a higher value of adipose tissue is likely to cause BMD loss leading to an increase in fracture risk [32]. Therefore obesity might not always be considered a protective factor in terms of fragility fracture risk. Compston et al. confirmed it in the Global Longitudinal Study of Osteoporosis in Women (GLOW), based on over 60 000 postmenopausal women in 10 countries, where it was proven that obesity significantly correlated with higher fracture risk of the ankle and lower leg area [33]. Similar findings were reported by Prieto-Alhambra et al. in a group of over 800 000 postmenopausal women. As the authors established, obese women were significantly more likely to sustain a humerus fracture than those with a normal BMI (RR 1.28; 95% CI: 1.04–1.58, p = 0.018). On the other hand, opposite results were observed in relation to hip fractures. Those were definitely less likely to be reported by overweight or obese women (p < 0.001; respectively: RR 0.77; 95% CI: 0.68–0.88 and RR 0.63; 95% CI: 0.64–0.79). One might speculate that these observations could be a result of the protective effect that fat tissue (around the hip joint) has during falls [34]. It should be mentioned that in our study we did not confirm any relation between the adipose tissue parameters and reported fractures or falls (p < 0.05). This might be related to the retrospective character of the study as well as a relatively small number of fragility fracture cases (n = 39). To recapitulate, adipose tissue might have an impact on the BMD and bone microarchitecture and therefore on fragility fracture risk, but this was not confirmed in this study. The way adipose tissue affects bone is not obvious and requires further extensive research.
Despite our best efforts, this study had some limitations. The first is related to the number of study subjects (n = 120) and therefore the number of patients with a reported fragility fracture (n = 39). The other limitations include the previously mentioned retrospective character of the study regarding the data on fractures and falls. Our study results did not include the assessment of the physical fitness (PF) of the patients, as these were published (PF assessed with Timed up and Go, 4-meter walking test) in the previous paper relating to falls and sarcopenia [17]. The scientific literature lacks studies on the relation between bone, muscle and adipose tissue. The observed dependencies remain uncertain and should be confirmed in a larger, prospective studies. It is our belief that the role of visceral adipose tissue in the functioning of postmenopausal women remains underestimated.
Conclusions
On the one hand, parameters of adipose tissue strongly correlate with the ASMM index in a group of postmenopausal women. On the other hand, there were no such relations with regard to the muscle strength (handgrip).
Adipose tissue is more closely related to the bone microarchitecture assessment (TBS) than BMD spine or BMD hip in a group of postmenopausal women (specially in terms of VAT area).
Postmenopausal women with higher adipose tissue values are characterised by greater BMD.