
Introduction
Portal vein thrombosis (PVT) is characterized by interruption of normal blood flow in the portal vein because of blood clot formation. Thrombophilic conditions, abdominal inflammation, tumorous invasion and liver cirrhosis are among the most common causes [1]. The prevalence of PVT is estimated to be 0.6-15.8% in patients with liver cirrhosis, is higher in the advanced stages of cirrhosis and increases in cirrhotic patients with hepatocellular carcinoma (HCC) [2].
Pathophysiology of PVT in liver cirrhosis is complex and multifactorial. Cirrhotic patients displayed disruption of both anti- and pro-coagulant hemostatic mechanisms, and are therefore at risk of both bleeding and thromboembolism [2, 3]. A disturbed hemodynamic state of portal circulation caused by portal hypertension, characterized by reduced portal inflow velocity and increased intrahepatic vascular resistance, is another factor that contributes to PVT in cirrhosis [2]. Endotoxemia in late-stage cirrhotic patients may lead to hemodynamic alterations and trigger the coagulation cascade that is implicated in thrombus generation and, ultimately, PVT formation [4, 5].
Protein C (PC) and protein S (PS) are physiological anticoagulant proteins synthesized in the liver and inhibit the progression of the coagulation cascades [6, 7]. PC selectively degrades the procoagulant factors Va and VIIIa after its activation by the thrombin-thrombomodulin complex [6, 8]. PS enhances PC activity and acts as a cofactor in the process of factor Va inactivation [9].
D-dimer is a fibrin degradation product of blood clot degeneration that represents an accurate marker of fibrinolytic activity [10]. D-dimer concentrations are routinely determined in the differential diagnosis of venous thromboembolism, and help define the duration of anticoagulant therapy [11, 12]. The D-dimer level was found to be higher in cirrhotic individuals with deteriorating liver function, and its level is altered by the existence of ascites in these patients [9, 13].
The presentation spectrum can range from completely asymptomatic condition, mild abdominal pain or fever in partial PVT, to compromised cirrhosis in complete portal vein obstruction [4, 5]. Moreover, life-threatening complications such as refractory ascites, gastrointestinal hemorrhage and intestinal ischemia can occur [2]. The Baveno VI Working Group [14] added two more variables for the classification of PVT, apart from the site (trunk, branches or both), the degree (complete or incomplete) and the extent of involvement of the extrahepatic portal venous system. These are the presentation (clinical and radiological features) and the type of underlying liver disease (cirrhosis, non-cirrhotic liver disease, HCC, post-liver transplant). However, even in this classification, there is no comment on the functional consequences of portal vein occlusion that could have a detrimental effect on liver function. To develop a comprehensive classification system for PVT in cirrhosis, emphasizing the PVT functionality (consequences of acute or chronic PVT in diseased or healthy liver) has been further proposed [15]. To date, there is a lack of systematic evidence on the clinical importance of PVT.
Therefore, the present study was conducted to describe the changes of PC, PS and D-dimer blood levels associated with PVT formation in cirrhosis and the relation to the degree of liver dysfunction.
Material and methods
Study population
This was a case-control study conducted at the Alexandria University Hospital from October 2017 to June 2021 and included 100 patients with HCV-related liver cirrhosis who previously received direct-acting antiviral therapy at different times and achieved a sustained viral response. The presence of liver cirrhosis was determined as per the clinical and biochemical evaluation, serum-based fibrosis biomarkers and radiological evidence (ultrasound appearance and/or liver stiffness measurement). The case group included 50 cirrhotic patients with acute de novo non-malignant PVT, while 50 cirrhotic patients without PVT were included as a control group. Exclusion criteria included chronic PVT with Doppler evidence of portal vein cavernoma, HCC or any malignant disease, Budd-Chiari syndrome or other causes of chronic liver disease, thrombophilia or other blood diseases, current use of anticoagulant or antiplatelet medications, autoimmune diseases, recent sepsis or severe dehydration, recent gastrointestinal endoscopic therapies, spleen resection, recent surgery or major trauma, or pregnancy.
Patient evaluation
The study participants were evaluated clinically as regards age, sex, and manifestations of chronic liver disease such as gastrointestinal hemorrhage, jaundice, ascites or hepatic encephalopathy (HE). Routine laboratory investigations included complete blood picture, blood urea and serum creatinine, liver aminotransferases, serum albumin, and serum bilirubin. The severity of chronic liver disease was assessed according to the Child-Turcotte-Pugh (CTP) classification. Abdominal ultrasonography was used to assess the surface and texture of the liver, the size of the spleen, the presence and grade of ascites, and any focal hepatic lesion [16]. Doppler ultrasonography with color and pulsed mode was used as the first-line imaging study to examine for interruption of the portal blood flow [17]. Ideally, the absence of blood flow in the portal vein with the presence of echogenic intraluminal material that obstructs the lumen of the vessel but the absence of portal vein cavernoma indicates acute thrombosis. Dynamic contrast-enhanced computed tomography of the abdomen then confirmed the site (trunk or branch), the extent (intrahepatic or extrahepatic), the degree (partial or complete) and the nature (benign or malignant) of PVT [18]. Upper gastrointestinal endoscopy was performed for all cirrhotic patients to screen for gastroesophageal varices, and to assess the variceal size and the stigmata of recent hemorrhage [19].
For laboratory evaluation of some factors of the coagulation and fibrinolysis cascades, 10 ml of blood was collected after fasting for at least 12 hours. Platelet count was determined by a Sysmex XE-2100 automated analyzer (Sysmex, Kobe, Japan). Prothrombin time (PT) and international normalized ratio (INR) were determined by a Sysmex CA6000 automated analyzer (Sysmex, Milton Keynes, UK) using routine coagulation methods with a coagulation detector. Aliquots of blood samples were centrifuged at 2000 ´ g for 10 minutes in plastic tubes containing 0.109 mol/l of the anticoagulant sodium citrate. The resulting plasma samples were stored at –80°C or directly subjected to enzyme-linked immunosorbent assay (ELISA)-based quantification of PC, PS, and D-dimer concentrations using the corresponding kits and strictly following the manufacturer’s instructions (Sun Biotech, Shanghai, China) [20].
Statistical analysis
Data were fed to the computer and analyzed using SPSS Statistics software version 20.0 (SPSS, Armonk, NY: IBM Corporation). Qualitative data were described as number and percentage. Quantitative data were described as range, mean ± standard deviation, median, and interquartile range. The Kolmogorov-Smirnov test and Shapiro-Wilk test were used to verify the normality of data distribution. The chi-square (χ2) test or Fisher’s exact (FE) test was used for comparison between two groups with respect to categorical variables as appropriate. Monte Carlo (MC) corrected significance was applied for the χ2 test when more than 20% of the cells had an expected count less than 5. Student’s t-test was used to compare between two groups for normally distributed numerical variables. The Mann-Whitney test (U) was used to compare between two groups for non-normally distributed numerical variables. Comparison between more than 2 groups as regards normally distributed numerical variables was performed by the one-way analysis of variance (ANOVA) test with post hoc Tukey’s analysis. Comparisons between more than 2 groups as regards non-normally distributed numerical variables was performed by the Kruskal-Wallis test (H) with post hoc Dunn’s analysis. The receiver operating characteristic (ROC) curve was plotted to determine the optimal cut-off value of the tested variables with the highest sensitivity and specificity for prediction of the outcome. The area under the curve (AUC), the positive predictive value (PPV) and the negative predictive value (NPV) were calculated for this cut-off value. The optimal cut-off value was established at the point of maximum accuracy. Statistical significance of the obtained results was judged at the p < 0.05 level. All calculated p values were two-tailed.
Results
Baseline clinical and biochemical data of patients included in the study are shown in Table 1.
Table 1
Distribution of clinical and biochemical data in cirrhotic patients of the study groups
There was a statistically significant difference between the patient groups in terms of the presence and the grade of esophageal varices, ascites and HE (p = 0.015, p = 0.003, and p = 0.014 respectively) (Table 2). All of the patients of the PVT group exhibited mild to severe ascites, but 32% of patients of the non-PVT group did not have ascites. In terms of HE, none of the patients of the non-PVT group experienced grade 3 or 4 HE as per the West-Haven Criteria. However, there was a statistically non-significant difference between the patient groups in terms of the occurrence of variceal hemorrhage (p = 0.072) (Table 2).
Table 2
Distribution of the liver disease-related consequences in cirrhotic patients of the study groups
There was a statistically significant difference between the patient groups in terms of PT and INR values (p = 0.001) (Table 3). The mean PC and PS blood levels were significantly lower in patients of the PVT group compared to patients of the non-PVT group (46.72 ±21.870 vs. 94.12 ±10.163, and 47.48 ±13.666 vs. 94.28 ±19.943 respectively) (p < 0.001). The mean D-dimer level was considerably higher in patients of the PVT group than in patients of the non-PVT group (1161.60 ±693.383 vs. 194.72 ±78.358) (p < 0.001) (Table 3).
Table 3
Comparison of the markers of coagulation, anticoagulation and fibrinolysis in cirrhotic patients of the study groups
Prothrombin time and INR were significantly increased in patients with higher CTP score of both the PVT group (p = 0.045) (Table 4) and the non-PVT group (p = 0.001) (Table 5). The mean PC and PS blood levels were significantly decreased in patients with higher CTP score of both the PVT group (p = 0.036 and p = 0.019) (Table 4) and the non-PVT group (p < 0.001) (Table 5). The mean D-dimer blood level did not differ significantly with the CTP score among patients of either the PVT group (p = 0.779) (Table 4) or the non-PVT group (p = 0.294) (Table 5).
Table 4
Differences of the markers of coagulation, anticoagulation and fibrinolysis in cirrhotic patients of the portal vein thrombosis (PVT) group with various degrees of liver dysfunction
Table 5
Differences of the markers of coagulation, anticoagulation and fibrinolysis in cirrhotic patients of the non-portal vein thrombosis group with various degrees of liver dysfunction
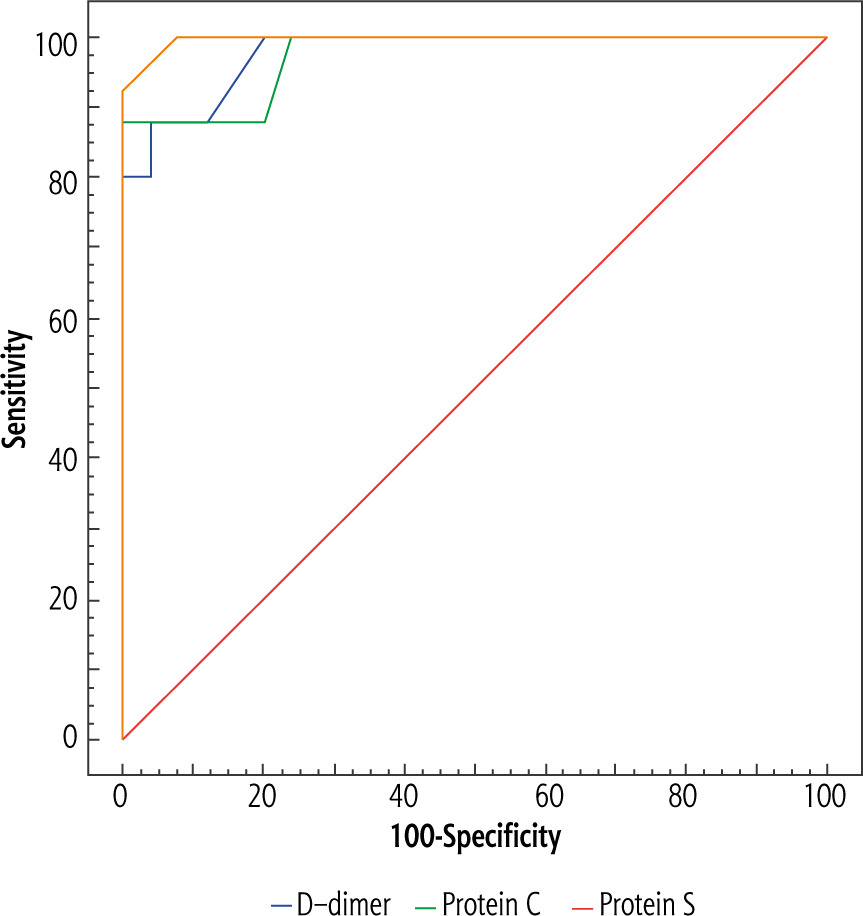
By plotting the ROC curve, PC level at the cut-off value of ≤ 77 IU/dl yielded significant prediction of PVT in cirrhotic patients (AUC = 0.974, p < 0.001) at diagnostic accuracy of 94% with sensitivity of 88% and specificity of 100% (Table 7, Fig. 1). For this cut-off value, the PPV and the NPV were 100% and 89.3% respectively. Additionally, PS level at the cut-off value of ≤ 63 IU/dl performed significantly for prediction of PVT in cirrhotic patients (AUC = 0.997, p < 0.001) at diagnostic accuracy of 96% with sensitivity of 92% and specificity of 100% (Table 7, Fig. 1). For this cut-off value, the PPV and the NPV were 100% and 92.6% respectively. Moreover, D-dimer level at the cut-off value of > 300 ng/ml significantly predicted PVT in cirrhotic patients (AUC = 0.982, p < 0.001) at diagnostic accuracy of 92% with sensitivity of 88% and specificity of 96% (Table 7, Fig. 1). For this cut-off value, the PPV and the NPV were 95.7% and 88.9% respectively.
Table 6
Comparison of the markers of coagulation, anticoagulation and fibrinolysis in cirrhotic patients of the study groups in relation to the different Child-Turcotte-Pugh classes
Table 7
Performance of D-dimer, protein C, and protein S for the diagnosis of acute non-malignant portal vein thrombosis (PVT) in cirrhotic patients included in the study
Discussion
Portal vein thrombosis is a well-known consequence of liver cirrhosis [21, 22]. It is more commonly seen in end-stage liver disease, particularly in those who have HCC [23]. It could possibly cause downstream hepatic decompensation and lead to life-threatening complications [24]. So, early diagnosis and treatment of PVT in patients with liver cirrhosis may save lives. Many studies have demonstrated that advanced imaging techniques have yielded 5% to 27% of patients with liver cirrhosis being diagnosed with PVT [2, 9, 25], and others have reported that prevalence of PVT ranges from 0.6% to 26% in liver cirrhosis [21, 22]. The prevalence of PVT in cirrhosis goes against what was previously recognized as cirrhosis-related auto-anticoagulation [26, 27].
The present study showed that most cirrhotic patients of the PVT group were classified in CTP classes B and C and had higher CTP scores than the control group. This finding could be explained by the more profound liver dysfunction in cirrhotic patients with PVT as evidenced by a lower albumin level, and prolonged PT [28]. Cirrhotic patients of the PVT group showed higher incidence and grades of esophageal varices, ascites and HE. Also, variceal hemorrhage was experienced more commonly, though non-significantly, among patients of the PVT group compared to the control group in this study. These findings reflect that the degree of portal hypertension is higher in patients with PVT. Portal hypertension has been reported to contribute to the pathogenesis of thrombosis by causing a disturbed hemodynamic state characterized by increased portal blood flow with decreased velocity [2].
The liver plays an important role in the coagulation process as it synthesizes and metabolizes the majority of fibrinolytic factors, as well as proteins which favor and inhibit the process of coagulation and fibrinolysis [29]. Liver failure may disrupt the hemostatic system, leading to severe bleeding or thrombotic complications [29, 30]. Following the earlier observations that variations of thrombolytic, fibrinolytic and coagulation factors are associated with liver dysfunction, we conducted the current study in an attempt to identify factors that are specifically associated with the development of PVT.
The present study found that PT and INR were significantly prolonged in cirrhotic patients of the PVT group compared to the control group, but the platelet count was not significantly different among the groups. Also, PT and INR, but not the platelet count, correlated significantly with the degree of liver dysfunction in this study. Interestingly, a study found that PT and platelet count displayed significant correlations with liver dysfunction, but did not correlate with the formation of PVT [9]. It is speculated that the coagulation function of cirrhotic patients was generally suppressed due to hepatic failure, which is usually reflected as decreased coagulants and significantly prolonged PT, and the platelet count was decreased possibly from hypersplenism, increased immune-mediated platelet destruction and/or impaired thrombopoietin synthesis in the liver [9, 20, 31, 32]. All of these abnormalities may prevent thrombus formation; however, this claimed auto-anticoagulation did not guarantee against PVT in cirrhotic individuals, and this confirms the complexity of the pathogenesis of cirrhosis-related PVT [26, 27]. There is some evidence suggesting that antithrombotic therapy effectively induces recanalization of the thrombosed portal vein without increasing the risk of bleeding [25]. However, the clinical data for the safety and efficiency of anticoagulant medications in cirrhotic patients with PVT are still lacking in published reports. In acute variceal hemorrhage, correction of coagulopathy, reflected as prolonged PT and INR, by the administration of fresh frozen plasma or recombinant factor VIIa showed no clear benefit and is not recommended [33].
Both PC and PS are major physiological anticoagulant proteins synthesized in the liver [6, 7]. The thrombin-thrombomodulin complex activates PC, which inhibits the blood coagulation cascade by selective degradation of the procoagulant factors Va and VIIIa [6, 8]. PS enhances the activity of PC and contributes to the process of PC-catalyzed inactivation of factor Va [9, 24]. In the current study, both PC and PS blood levels were significantly lower in patients of the PVT group compared to the control group. It is not totally surprising that PC and PS blood levels were both inversely correlated with the formation of PVT, since these two factors are mechanistically connected. Moreover, the present study found that both PC and PS blood levels were significantly decreased in patients with higher CTP score of both study groups, which reflected the progression of liver failure. Similarly, other studies found that PC and PS decreased dramatically as liver function deteriorated [9, 34, 35]. One of the underlying mechanisms may be related to the fact that hepatocytes fail to synthesize adequate amounts of PC and PS under ischemic and hypoxic conditions. Also, the decrease in both proteins may be attributed to the endothelial cell damage caused by portal hypertension, which leads to the activation and subsequent consumption of these proteins in fibrinolytic processes [9]. Consequently PC and PS activities may be used as potential markers of hepatocellular damage [29]. Besides our findings, the roles of PC and PS in other diseases have long been established through previous findings. For example, the occurrence of PC and PS deficiency is relatively high in patients with deep venous thrombosis in the lower extremities [36, 37]. Also, the decline of PC and PS was found to relate to cerebrovascular ischemia [38, 39].
D-dimer is a fibrin degradation product, a small protein fragment present in the blood after a blood clot is degraded by fibrinolysis [10]. Hyperfibrinolysis in cirrhotic patients might represent a state of low grade disseminated intravascular coagulation [40], and has been described as a frequent clinical feature which probably depends on primary clotting activation, impaired synthesis of inhibitors of fibrinolytic protein and delayed hepatic clearance of tissue plasminogen activator by the liver [41, 42]. In the present study, the D-dimer level was considerably higher in patients of the PVT group than the control group. Similarly, a study found that D-dimer displayed significant correlation with the formation of PVT [9]. However, previous studies found that D-dimer level did not distinguish between cirrhotic patients with and without PVT [40, 43-45]. Moreover, the current study did not find a significant association between the D-dimer blood level and the CTP score. Discordantly, other studies found that D-dimer was positively associated with the degree of liver dysfunction [9, 28, 34, 35].
Furthermore, we plotted the ROC curve to identify the best cut-off value of PC, PS, and D-dimer for prediction of PVT in liver cirrhosis. The current study demonstrated that PC level ≤ 77 IU/dl, PS level ≤ 63 IU/dl, and D-dimer level > 300 ng/ml could potentially predict PVT occurrence in cirrhotic patients at remarkable sensitivities and positive predictive values. Another study found that D-dimer lower than 0.52 mg/l and PC higher than 2.78 mg/l may identify a cirrhotic patient in whom PVT is highly unlikely [9]. Some other studies claimed these biomarkers could potentially predict PVT in liver cirrhosis, although at different cut-off points [9, 35].
Although both coagulation and anticoagulation systems in cirrhotic patients are generally suppressed as a result of the functional hepatic failure, the two systems may still be maintained in a relatively balanced fashion, and hence there may not be a tendency for hemorrhage or thrombosis under stable conditions. When cirrhotic patients undergo stressful conditions, such as sepsis or trauma, the latter endures a greater impact and consequently the balance between the two systems is mostly broken [46]. Moreover, endothelial damage, indicated as the increased level of endothelin-1 and thrombomodulin, is very common in cirrhotic patients, with slowed flow and turbulence in the portal vein [47, 48]. All of these factors collectively could lead to the formation of PVT.
Given that all patients included in the present study had already achieved a sustained viral response to direct-acting antiviral therapy, the authors could assume that cure of HCV infection did not guarantee against PVT occurrence. Similarly, a study concluded that the risk of non-tumoral PVT persists after HCV cure in patients with cirrhosis, and the severity of liver disease remains the main determinant [49]. However, another study demonstrated that direct-acting antiviral therapy in HCV-related cirrhotic patients is associated with significant changes in thrombin generation, suggesting a reversal of hypercoagulability, particularly in CTP class A patients [50]. Other researchers reported that direct-acting antiviral therapy in HCV-related cirrhosis resulted in improvement of the individual pro- and anticoagulants, although the net effect did not substantially modify their balance, as shown by the unchanged thrombin generation in the presence of thrombomodulin, but made it more stable and less amenable to be perturbed, as presumably occurs before treatment [51].
Conclusions
Based on the results of the present study, it could be concluded that liver cirrhosis is generally associated with profound alterations of the coagulation, anticoagulation and fibrinolysis systems. Notably, low PC and PS together with high D-dimer were closely associated with PVT formation in cirrhosis, and hence could be considered potential risk factors for such deleterious consequence. Measuring the plasma concentrations of these potential markers may be a helpful tool to suggest the presence of PVT in cirrhotic patients, then specific imaging techniques should be done to confirm the diagnosis and initiate early treatment before the occurrence of serious complications. Moreover, the plasma concentrations of PC, PS and D-dimer could be incorporated into a proposed probability score system to increase its performance for PVT diagnosis.
It may be recommended that the clinical usefulness of anticoagulant proteins and D-dimer blood levels as potential markers of PVT formation should be validated in prospective clinical studies of a large-scale population including patients with different etiologies of liver disease. Monitoring the evolution of liver disease after PVT occurrence is extremely important. Investigation of the other proteins of the coagulation-fibrinolysis cascade as possible predictors of PVT occurrence could be justified. It is imperative to fully investigate the hemodynamic and endothelial alterations in cirrhosis as contributors to PVT formation.
Ethical approval
The study was conducted in accordance with the provisions of the World Medical Association Declaration of Helsinki. The research protocol was approved by the Ethics Committee of the Alexandria Faculty of Medicine (IRB. No.: 00007555). Informed consent was obtained from all subjects included in the study.


