
Introduction
Type 1 diabetes (T1D) is increasingly recognized as a risk factor for reduced bone mineral density (BMD), bone loss, and osteoporosis [1–4]. It often occurs during a critical period of bone development, before the achievement of peak bone mass (< 30 years of age) [5]. Thus, children and adolescents with T1D are at increased risk of alterations in bone mineral acquisition and reduced peak bone mass [6, 7]. Mechanisms accounting for T1D-related bone loss include the following: i) chronic hyperglycaemia, ii) low-grade systemic inflammation, iii) increased urinary excretion of calcium, phosphate, and magnesium, iv) hypovitaminosis D and excessive parathyroid hormone (PTH) secretion by parathyroid glands (secondary hyperparathyroidism), v) insulinopenia, vi) dysregulation of the growth hormone (GH)-insulin-like growth factor (IGF) axis, vii) accumulation of advanced glycation end products, viii) coexistence of celiac disease, and ix) amylin deficiency [1, 2, 8–14]. It has also been suggested that bone disease represents another manifestation of microvascular disease in T1D [15].
During childhood and adolescence, the interpretation of densitometric measurements obtained with dual-energy X-ray absorptiometry (DXA) remains complex due to the wide inter-individual variability in the process of skeletal growth (pubertal development, body size, bone size, hormone action) [16]. In the paediatric population, a “low bone density status” can be diagnosed in the presence of bone mineral content (BMC) or areal bone mineral density (aBMD) Z-score values ≤ –2.0 (adjusted for gender, age, and body size, as appropriate) [16, 17]. However, the diagnosis of osteoporosis in children and adolescents should not be made according to densitometric criteria alone; it requires the concurrent presence of low BMC or BMD, along with history of a clinically significant fracture [16]. Other limitations of DXA use in paediatric patients include exposure to ionizing radiation (although the patient radiation dose is minimal) and the fact that DXA primarily assesses bone mass through BMD measurement, whereas quantification of bone quality is more complex and involves the assessment of bone microarchitecture, texture, and mechanical parameters [18, 19]. In this regard, quantitative ultrasound (QUS) is a safe, easy to use, and cost-effective method that estimates bone mineral status at the peripheral skeleton and provides additional information other than BMD, which regards bone structure and composition and can be useful to determine bone quality and fracture risk [20]. Moreover, QUS represents a non-invasive method because it does not involve exposure to ionizing radiation; also, outcomes of the ultrasound method are less dependent on bone size [21]. These characteristics render QUS a valid imaging technique to assess bone mineral status in children and adolescents. The main variables measured by QUS devices derive from velocity or attenuation of the ultrasound waves through the bone tissue. For each QUS variable, a Z-score value below –2.0 could identify a condition of “low BMD status” [20], as it has been suggested for DXA measurements [22]. The velocity of transmission and amplitude of the ultrasound signal are both influenced by the bone tissue, reflecting bone density, architecture, and elasticity [20].To date, only a few studies have examined the bone status of children and adolescents with T1D through the concomitant use of DXA and QUS techniques. Therefore, we conducted an exploratory retrospective cross-sectional study involving a cohort of children and adolescents with new-onset T1D. Our study aimed to investigate the correlation between DXA and QUS measurements, as well as the relationship between DXA-QUS results and markers of bone turnover (markers of bone formation and bone resorption), glucose homeostasis, and residual β-cell function in this population.
Material and methods
Study design and participants
We conducted a retrospective cross-sectional study including 17 children and adolescents with new-onset T1D, who were consecutively admitted to our institution (Department of Paediatrics, Section of Paediatric Diabetology, Policlinico Umberto I, Sapienza University of Rome) between April 2021 and November 2021. All study participants were recruited within 10 days after the diagnosis of clinical diabetes. Inclusion criteria were the following: age ≤ 18 years and a confirmed diagnosis of T1D according to the American Diabetes Association (ADA) guidelines, including glycated haemoglobin (HbA1c) values ≥ 6.5% (≥ 48 mmol/mol) and/or fasting plasma glucose (FPG) values of ≥ 126 mg/dl (≥ 7 mmol/l), exogenous insulin requirement from diagnosis, and positivity for at least one of the T1D-associated autoantibodies including insulin autoantibodies (IAAs), glutamic acid decarboxylase autoantibodies (GADA), islet tyrosine phosphatase-like protein IA2-antibodies (IA-2A), or zinc transporter 8 autoantibodies (ZnT8A) [23]. Exclusion criteria are listed in the Supplementary Appendix.
Biochemical and hormonal assessment
Serum levels of total alkaline phosphatase (ALP) and osteocalcin were measured as markers of bone formation and osteoblast activity, whereas serum levels of β-CrossLaps (β-CTx) were measured as markers of bone resorption and osteoclast activity. FPG and HbA1c were measured as markers of glucose homeostasis, whereas the fasting plasma C-peptide (FCP) level was measured as a marker of residual β-cell function at the onset of T1D. The types of blood assays and inter-assay coefficient of variation (CV) are described in the Supplementary Appendix.
Clinical assessment and anthropometric measurements
Patients’ parents or legal guardians completed a standardized questionnaire including data on history of bone fractures, medication use, and comorbidities of the study participants. Total daily dose of insulin (TDD, expressed as IU/kg body weight/ 24 hours) was assessed for each patient at the time of hospital discharge. We measured linear height (cm) by a Harpenden Stadiometer, and we calculated Z-scores and percentiles for body mass index (BMI, expressed as body weight in kilograms divided by the square of the height in metres, or kg/m2). We assessed the stage of development of secondary sex characteristics for each participant through the Tanner staging system to distinguish prepubertal and postpubertal subjects. Clinical and laboratory data were collected through a medical record review performed by 2 members of our research team. Clinical data included information on the onset of T1D and on the occurrence of diabetic ketoacidosis (DKA). BMI Z-scores and percentiles were calculated through a Z-Score calculator (Pediatric Z-Score Calculator for patients between 2 and 20 years of age, Children’s Hospital of Philadelphia Research Institute; available at: https://zscore.research.chop.edu/. Accessed: 15 Nov 2021).
Bone diagnostic tools
In the whole cohort, bone status was examined by using both DXA and QUS measurements. DXA and QUS assessment and measurements were performed by the same experienced technician.
Bone densitometry: lumbar spine DXA analysis
Bone densitometry (DXA measurements) of the posterior-anterior lumbar spine (L1–L4) was performed by using a Ho-logic model QDR 4500A dual-energy X-ray absorptiometer (Hologic Inc., Waltham, MA, USA). Z-scores were defined as the number of standard deviations (SDs) from the mean BMD of a healthy population of the same age, ethnicity, and sex [24]. Z-score values for lumbar spine aBMD (expressed in g/cm2) were calculated. For the obtained values, SD values were calculated by using gender- and age-specific reference data from the software provided by the manufacturer (Hologic Explorer™). Based on DXA results, a “low BMD status” was diagnosed if BMD Z-score values were ≤ −2.0 SDs, in the absence of history of clinically significant fractures [25].
Phalangeal QUS measurements
QUS measurements were performed at the distal end of diaphysis (below the condyles) of the proximal phalanges of the last 4 fingers (II to V) of the dominant hand by using a DBM Sonic 1200 device (IGEA, Carpi, Italy). We performed phalangeal QUS of the dominant hand because previous studies reported no significant difference in AD-SoS values between dominant and non-dominant hands in children and adolescents [26], suggesting that it is sufficient to measure the QUS parameters of one hand only. The same device was used for the assessment of QUS parameters in all participants. The calibration and time stability of the device were assessed daily by using a factory Plexiglass cube. A quality control was performed periodically by the IGEA technical team through a cross-calibration procedure comparing different devices with each other. The data obtained from the cross-calibration analysis were completely superimposable. We calculated the main QUS parameters measured by the phalangeal QUS devices [20], namely: age-adjusted, amplitude-dependent speed of sound (AD-SoS, expressed in metres per second or m/s) and bone transmission time (BTT, expressed in microseconds or μs). In order to perform a proper comparison between children and adolescents of different age and sex, we used a standard Z-score transformation with mean values and SDs appropriate for different genders and age groups [26]. The narrow normal range of SD was defined as –1.0 to +1.0, whereas a wide range was defined as –2.0 to +2.0. We calculated mean AD-SoS values and AD-SoS Z-scores, as well as mean BTT values and BTT Z-scores for the analysed fingers.
Statistical analysis
Descriptive statistics were reported as mean and SD for continuous variables, and frequencies and percentages were reported for categorical variables. Inferential statistics to test differences in participants’ characteristics were assessed by Student’s t-test for continuous variables. Correlations between continuous variables were tested by ρ (rho) Spearman coefficient, particularly among DXA and QUS parameters, markers of glucose homeostasis and residual β-cell function, and markers of bone turnover. All statistical analyses were performed using R statistical software for Windows (version 3.5.1; R Foundation for Statistical Computing, Vienna, Austria). A p-value < 0.05 was considered statistically significant in all statistical analyses.
Ethics
The study was reviewed and approved by the Ethics Committee of Sapienza University of Rome (Registration Number: 0323/2021, 31 March 2021). The study was conducted in accordance with all relevant national regulations and institutional policies and with the principles of the Helsinki Declaration (as revised in 2013).
Results
Patients’ demographics and clinical characteristics
A total of 17 children and adolescents (9 males, 8 females; aged between 3 and 18 years) admitted to our Institution with recent-onset T1D were enrolled into this study. Participants’ data were available shortly after the clinical diagnosis of T1D (within 10 days of diagnosis). All participants were Italian, and the mean age of the total study population was 10.16 ±4.54 years (median age: 9.8 years; range: 4.37–18.19 years). Twelve out of 17 participants (70.6%) were in the prepubertal stage, while the remaining 5 subjects (29.4%) were in the postpubertal stage. Participants did not report any history of previous bone fractures, except for one participant who reported a non-vertebral, high-energy fracture due to significant trauma. At the time of the study enrolment, all subjects aged ≥ 11 years had been participating in structured physical activity programs in their secondary and high schools, as established by the Italian Ministries of Health and Public Education (approximately two 60-minute aerobic exercise sessions per week). All participants were generally following a Mediterranean dietary pattern. Demographics, anthropometric measurements, clinical and laboratory characteristics, and DXA and QUS characteristics of the entire study population (with comparison between males and females) are shown in Table I.
Table I
Demographics, anthropometric measurements, clinical and laboratory characteristics (including markers of calcium-phosphate metabolism and bone turnover), and DXA and QUS characteristics of the entire study population
[i] Data are expressed as mean ± standard deviation (SD). P-values refer to the comparison between males and females. 25(OH)D – 25-hydroxyvitamin D; AD-SoS – (age-adjusted) amplitude-dependent speed of sound; ALP – alkaline phosphatase; β-CTx – β-CrossLaps; BMI – body mass index; BTT – bone transmission time; DKA – diabetic ketoacidosis; DXA – dual-energy X-ray absorptiometry; FCP – fasting plasma C-peptide; FPG – fasting plasma glucose; HbA1c – glycated haemoglobin; LS aBMD – lumbar spine areal bone mineral density; n/a – not applicable; PTH – parathyroid hormone; QUS – quantitative ultrasound; T1D – type 1 diabetes; TDD – total daily insulin dose * Lumbar spine DXA measurements ** Phalangeal QUS measurements
Mean age and body weight were comparable between males and females (mean age: 10.98 ±4.69 years vs. 9.22 ±4.48 years, respectively, p = 0.443; mean body weight: 43.52 ±24.24 kg vs. 30.76 ±15.4 kg, respectively, p = 0.222). Also, there was no statistically significant difference in mean BMI values, BMI Z-scores, and BMI percentiles between males and females (Table I).
Only 4 out of 17 participants (3 females) presented with DKA at the onset of T1D, whereas the remaining patients showed other classic symptoms of clinical diabetes such as polyuria, polydipsia, weight loss, polyphagia, fatigue, and/or blurred vision. Nine patients (5 females) showed single islet autoantibody positivity, whereas 8 patients (3 females) showed multiple islet autoantibody positivity. There was no statistically significant difference in age, FPG, FCP, and TDD between males and females (Table I).
With regard to markers of calcium-phosphate metabolism and bone turnover, mean serum 25-hydroxyvitamin D [25(OH)D] levels in the study population (22.54 ±7.86 ng/ml) were indicative of vitamin D insufficiency. In the entire study cohort (17 participants), 8 participants had vitamin D deficiency [25(OH)D < 20 ng/ml], whereas 6 participants had vitamin D insufficiency [25(OH)D between 20 and 29.9 ng/ml], and only 3 participants had vitamin D sufficiency (25(OH)D ≥ 30 ng/ml). None of the participants reported the use of vitamin D supplements at the time of enrolment. Intact PTH levels were within the reference range in the entire cohort and in both sexes (Table I). Mean serum levels of total ALP, β-CTx, and osteocalcin were above the reference range in the entire study cohort, although there was no statistically significant difference in these parameters between sexes. Also, there was no statistically significant difference in serum levels of calcium and phosphate between males and females (Table I).
Lumbar spine DXA measurements
The mean lumbar spine aBMD value of the entire study group was 0.69 ±0.25 g/cm2. There was no statistically significant difference in mean aBMD values between males and females (0.71 ±0.25 g/cm2 vs. 0.67 ±0.26 g/cm2, respectively; p = 0.726; Table I). In the entire cohort, the mean lumbar spine aBMD Z-score value was –0.14 ±1.28. Lumbar spine aBMD Z-scores were indicative of low BMD status (≤ −2.0 SD) in 2 out of 17 patients (11.7%; 1 female). There was no statistically significant difference in mean lumbar spine aBMD Z-scores between males and females (–0.38 ±1.07 vs. 0.12 ±1.51, respectively; p = 0.438; Table I).
Phalangeal QUS measurements
In the entire study group the mean AD-SoS value was 1907.12 ±129.92 m/s, whereas the mean AD-SoS Z-score value was –0.77 ±2.64. In addition, the mean BTT value was 0.95 ±0.37 μs, whereas the mean BTT Z-score value was –0.16 ±1.16. Age-adjusted AD-SoS values were below the reference range in 3 out of 17 subjects (17.6%; all 3 subjects were males) according to the normative values established in healthy subjects by Baroncelli et al. [26]. Additionally, 3 participants (17.6%; all 3 subjects were males) showed AD-SoS Z-score values < −2.0 (−4.67, −6.10, −6.25), whereas 2 participants (11.8%; 1 female) exhibited BTT Z-score values < −2.0 (−2.02, −2.12). No statistically significant difference was observed between males and females in terms of QUS parameters (Table I).
Correlation between DXA-QUS parameters and markers of bone turnover
Spearman’s correlation analysis did not reveal any significant correlation between aBMD values and markers of bone turnover. On the other hand, we found significant inverse correlations between AD-SoS values and circulating levels of β-CTx (ρ = −0.65; p = 0.004), ALP (ρ = −0.53; p = 0.043), and osteocalcin (ρ = −0.76; p < 0.001), as well as a significant inverse correlation between BTT values and phosphate levels (ρ = −0.63; p = 0.007; Table II). Also, no significant correlation between BMI Z-scores and DXA-QUS parameters was found (Table II).
Table II
Spearman correlations between DXA-QUS parameters and markers of bone turnover
[i] 25(OH)D – 25-hydroxyvitamin D; AD-SoS – (age-adjusted) amplitude-dependent speed of sound; ALP – alkaline phosphatase; β-CTx – β-CrossLaps; BMI – body mass index; BTT – bone transmission time; LS aBMD – lumbar spine areal bone mineral density; Intact PTH – Intact parathyroid hormone; p – p-value; ρ – Spearman’s rank correlation coefficient (rho) * Lumbar spine DXA measurements ** Phalangeal QUS measurements
Correlation between DXA-QUS parameters and markers of glucose homeostasis and residual β-cell function
Spearman’s correlation analysis revealed a significant positive correlation between BTT values and FCP levels (ρ = 0.62; p = 0.008). Conversely, there was no statistically significant correlation between DXA-QUS parameters, FPG, and HbA1c values (Table III). Also, no significant correlation between BMI Z-scores and markers of glucose homeostasis and residual β-cell function was found (Table III).
Table III
Spearman correlations of DXA-QUS parameters and markers of bone turnover with markers of glucose homeostasis and residual β-cell function
[i] 25(OH)D 25-hydroxyvitamin D; AD-SoS (age-adjusted) amplitude-dependent speed of sound; ALP – alkaline phosphatase; β-CTx – β-CrossLaps; BMI – body mass index; BTT – bone transmission time; FCP – fasting plasma C-peptide; FPG – fasting plasma glucose; HbA1c – glycated haemoglobin; intact PTH – intact parathyroid hormone; LS aBMD – lumbar spine areal bone mineral density; TDD – total daily insulin dose; p – p-value; ρ – Spearman’s rank correlation coefficient (rho)
Correlation between markers of bone turnover and markers of glucose homeostasis and residual β-cell function
Spearman’s correlation analysis revealed a significant positive correlation between ALP and FPG levels (ρ = 0.61; p = 0.016), as well a significant inverse correlation between TDD and PTH levels (ρ = –0.64; p = 0.006) and a significant inverse correlation between HbA1c and calcium (ρ = –0.544; p = 0.024; Table III).
Correlation between lumbar spine DXA and phalangeal QUS parameters
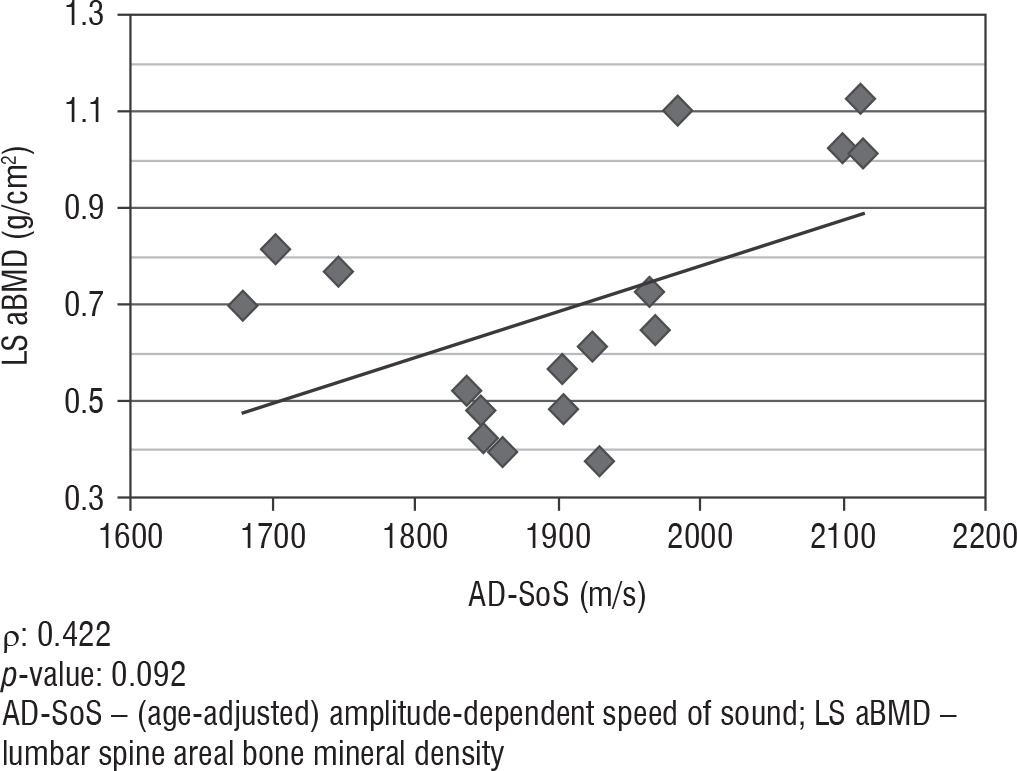
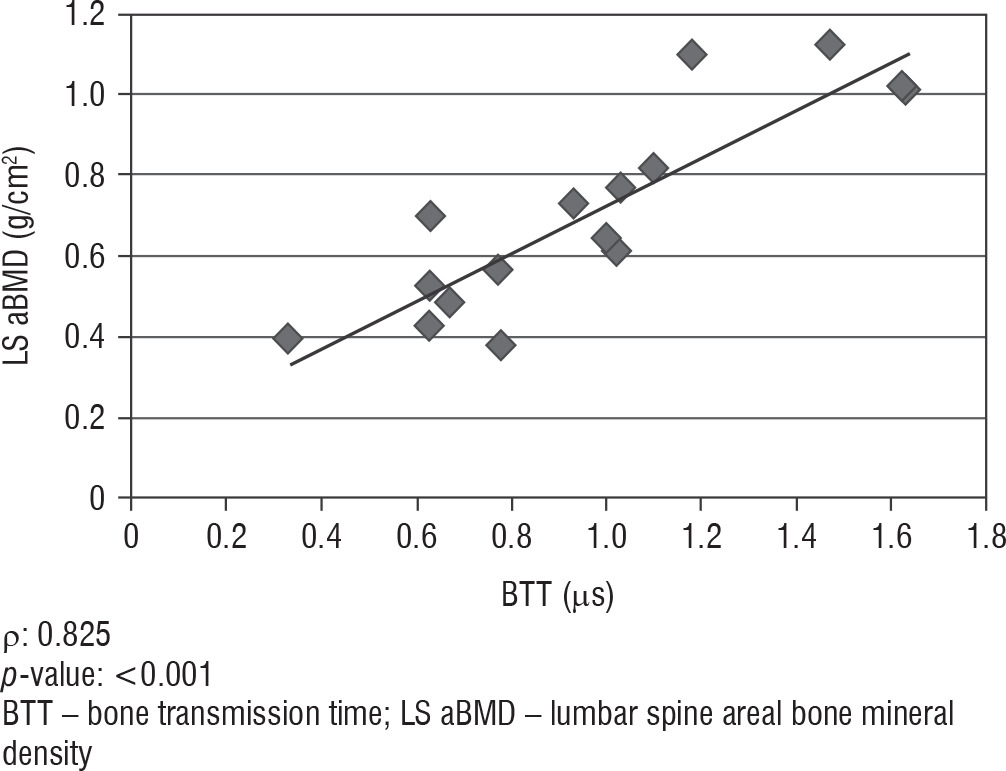
We did not find any significant correlation between lumbar spine aBMD values obtained from DXA analysis and AD-SoS values obtained from phalangeal QUS measurements (ρ = 0.422; p = 0.092). However, there was a significant positive correlation between lumbar spine aBMD and BTT values (ρ = 0.825; p < 0.001). Figure 1 shows the linear correlation between aBMD and AD-SoS, and Figure 2 shows the linear correlation between aBMD and BTT.
Discussion
In our cohort of children and adolescents with newly diagnosed T1D, we did not find statistically significant differences between males and females in DXA and QUS measurements. In our cohort, despite the recent onset of T1D, 11.7% and 17.6% of participants had aBMD Z-scores and AD-SoS Z-scores indicative of low BMD status (< −2.0), respectively. Age-adjusted AD-SoS values were also below the reference range in 17.6% of participants. These results are in line with observational studies conducted in children and adolescents with T1D. A recent meta-analysis of cross-sectional or cohort studies that included BMD measured by DXA and QUS in youths (aged < 20 years) revealed that lumbar spine BMD values were significantly lower in T1D subjects compared to matched controls [27]. Despite being limited by the small number of studies involving the use of QUS, this meta-analysis also found significantly lower AD-SoS Z-scores in the proximal phalanges of the non-dominant hand of the case group [27]. A study conducted by Vale-rio et al. [28] reported findings similar to those observed in our study. The authors evaluated the influence of duration of T1D and metabolic control on phalangeal QUS by consecutively recruiting 86 children and adolescents with T1D (mean age: 11.9 years; mean disease duration: 4.3 years). Although AD-SoS Z-scores did not differ between males and females, the authors found that 9 subjects (10.5%) had AD-SoS Z-score values below −2 SDs. Moreover, a significant negative correlation was found between AD-SoS Z-scores and disease duration or metabolic control (the latter being defined by HbA1c values) [28]. Conversely, in our study there was no significant correlation between DXA-QUS parameters and markers of glucose homeostasis (FPG and HbA1c), although our patients were newly diagnosed with T1D. Our findings are in keeping with those from another study that did not find a significant correlation between speed of sound (SOS) Z-scores and HbA1c in children and adolescents with T1D (disease duration: 5 to 177 months; mean age: 11.3 ±4.6 years), but it is worth mentioning that SOS was measured at the radius and tibia [29].
A recently published 10-year longitudinal study conducted by Chobot et al. [30] assessed bone status in 32 adolescents and young adults with T1D and suboptimal glycaemic control (age: 20.5 ±3.93 years; disease duration: 13.9 ±1.97 years) by using both QUS (performed at the phalanges of the non-dominant hand) and total body and lumbar spine DXA. The authors found that AD-SoS SDS values obtained at baseline in adolescents were significantly lower than those in healthy controls.
However, at 10-year follow-up assessment, no further deterioration was reported; the mean AD-SoS SDS did not significantly change from baseline. Furthermore, there was a significant correlation between the latest and the baseline AD-SoS SDS results, whereas there was no correlation between QUS results and anthropometric parameters or gender. Although DXA parameters at 10 years did not correlate with the QUS measurements at the same time point, DXA and QUS results were both independent of comorbidities, intake of additional medications (other than insulin), and HbA1c [30]. These results, together with our findings, suggest that bone changes leading to a low BMD status and to impaired skeletal health may already occur during the pre-symptomatic stages of T1D and/or at the onset of the disease in a small proportion of T1D children and adolescents. Since most studies indicate that T1D duration does not represent a significant factor affecting bone status [30–32], it is likely that changes in bone in T1D may develop slowly over time independent of glycaemic control and other comorbidities.
In our study, we also found a significant positive correlation between ALP and FPG levels, suggesting an increased bone turnover rate in children and adolescents with T1D as a likely consequence of impaired glucose homeostasis at the onset of the disease. In addition, we observed a significant inverse correlation between AD-SoS values and circulating levels of β-CTx, ALP, and osteocalcin, suggesting that high AD-SoS values are associated with an increase in bone remodelling.
Interestingly, we found a significant positive correlation between BTT values and FCP levels (ρ = 0.621; p = 0.008). These findings suggest that residual endogenous insulin secretion may be a protective factor against diabetes-related detrimental skeletal changes in children and adolescents with new-onset T1D. Indeed, measurement of C-peptide is used as a surrogate marker of β-cell function because C-peptide is secreted from pancreatic β cells at an equimolar ratio to endogenous insulin [33]. It is also worth noting that C-peptide may exert hormone-like activities in different tissues (including bone) by binding to a specific, yet unidentified, C-peptide receptor [34]. Hence, C-peptide may directly counteract diabetes-related bone loss and improve bone quality, as it has been demonstrated in animal models of diabetes such as streptozotocin-diabetic rats [35]. Although this hypothesis needs to be confirmed in clinical trials, it appears to be plausible because C-peptide replacement therapy led to amelioration of micro-vascular diabetes complications in some studies [36–38], and persistence of residual C-peptide secretion after diagnosis of T1D has been associated with reduced risk of retinopathy and nephropathy [39,40].
Importantly, we found a significant positive correlation between lumbar spine aBMD values obtained from DXA analysis and BTT values obtained from phalangeal QUS measurements. Although these findings cannot support the use of DXA and QUS as alternative methods to assess bone status in children and adolescents with T1D, they may suggest that phalangeal QUS is an ideal tool for detecting early skeletal abnormalities and identifying T1D subjects who may be at increased risk of osteoporosis in adulthood. In this context, it is worth noting that early skeletal abnormalities may occur in T1D, as it has recently been demonstrated by Jaworski et al. [41], who showed that T1D children (with a median T1D duration of less than 5 years) undergoing peripheral quantitative computed tomography (pQCT) of the lower leg exhibited a decreased ratio of cortical bone area/muscle area, suggesting a disturbed adaptation of the cortical shaft to the muscle force. Large, long-term prospective studies are therefore needed to ascertain whether QUS and DXA may be used alternatively to evaluate bone status in children and adolescents with T1D.
We acknowledge that our study has limitations, including the small sample size, the heterogeneous study population (including both prepubertal and postpubertal subjects), the lack of a healthy control group, and the retrospective database design. With regard to the DXA assessment, we acknowledge the lack of information on Total Body Less Head (TBLH) measurement, which is often performed in paediatric patients. However, according to the International Society for Clinical Densitometry (ISCD) recommendations for children and adolescents [42], posterior-anterior lumbar spine measurement represents the recommended DXA scanning site for the paediatric population (in combination with, or as an alternative site to, TBLH measurement). We therefore decided to perform only lumbar spine DXA to minimize the radiation exposure in our paediatric patients. The lumbar spine is also considered a preferred site in paediatric patients because of the speed and precision of measurements, the easily identified bony landmarks, and the greater numbers of paediatric normative data [42]. We avoided the measurements of other skeletal sites (such as proximal femur, lateral distal femur, lateral vertebral assessment, and forearm) because these are associated with technical challenges in paediatric patients (due to the skeletal growth) and are recommended for specific paediatric populations only (e.g. children and adolescents for whom standard DXA measurements are difficult to obtain due to joint contractures or metal implants, or children and adolescents who cannot be scanned at the spine or whole body due to obesity) [42]. Another limitation of our study is the fact that we assessed total ALP as a marker of bone formation rather than the more accurate bone- specific alkaline phosphatase (BALP). Finally, we acknowledge that the cross-sectional design of our study and its small sample size do not allow definitive conclusions to be drawn on the true relationship between DXA-QUS measurements and markers of bone turnover, glucose homeostasis, and residual β-cell function. Nonetheless, it is worth underlining that the present study was conducted for exploratory purposes. Thus, it will pave the way for a large prospective cohort study to evaluate the long-term clinical consequences of DXA and QUS alterations observed at time of T1D diagnosis in the paediatric population. The main strength of the present study is that, to the best of our knowledge, it is the first study assessing bone status through both DXA and QUS techniques in children and adolescents with new-onset T1D and correlating DXA-QUS parameters with markers of bone turnover, glucose homeostasis, and residual endogenous insulin secretion in this population.
Conclusions
In conclusion, our study suggests that DXA and/or QUS parameters may already be altered in a small proportion of T1D children and adolescents at the disease onset. In addition, residual β-cell function may represent a protective factor against detrimental skeletal changes in children and adolescents with T1D. However, large and long-term prospective studies are needed to confirm these preliminary findings and hypotheses, because the clinical interpretation of the present study is partly limited by the retrospective cross-sectional design and by its small sample size. Finally, routine assessment of BMD by different modalities (DXA and/or QUS) may be considered in youths with new-onset T1D, in order to diagnose early skeletal abnormalities or to monitor possible detrimental changes in skeletal status over time.


