
Introduction
Preeclampsia (PE) is hypertensive disorder with pregnancy that occurs after 20 weeks` gestation [1]. Preeclampsia is a major cause of foetal and maternal morbidity [2]. Women with PE are at higher risk of preterm labour, intrauterine growth retardation, and perinatal mortality [3].
Preeclampsia occurs in 2–10% of all pregnancies. The incidence of PE is greater in developing countries than in developed countries (2.8% vs. 0.4%, respectively) [4]. The risk factors of PE include nulliparity, family history of PE, previous PE, obesity, hyperlipidaemia, and twin and molar pregnancies [2].
Currently, there is no reliable diagnostic test to predict women at risk of PE [5]. Kazerooni et al. concluded that the single urine calcium-creatinine ratio (CCR) may be an effective method for screening women at risk of PE [6]. Rodriguez et al. suggested the use of CCR ≤ 0.04 as a screening test for the prediction of PE [7]. Therefore, this study aimed to evaluate the accuracy of CCR in a spot urine sample for the prediction of PE.
Material and methods
This prospective comparative study was conducted from December 2018 to October 2020 after approval by the department`s Ethics Committee (OB_30010_31) and registration as clinical trial ACTRN12618000497202.
Two hundred and forty-six pregnant women between 20 and 40 years old, attending the ante-natal clinic (ANC) after 20 weeks` were included in this study after giving informed consent in accordance with the Declaration of Helsinki.
After thorough history taking, and clinical examination, routine antenatal laboratory investigations were done for participants according to the hospital protocol, to exclude any pre-existing chronic renal disease affecting calcium and/or creatinine excretion.
Women > 40 years old and women with chronic hypertension (CH), gestational hypertension, superimposed PE, diabetes mellitus, urinary tract infection, multiple pregnancies (twin and triplet pregnancies), premature rupture of membranes (PROM), pre-existing chronic renal disease affecting the urine output or urine calcium and/or creatinine excretion, and women who refused to participate were excluded from this study.
Midstream spot urine samples were taken from all participants for detection of CCR. The urinary calcium was analysed by Arezano method, and creatinine was estimated by Jaffe’s method [8]. The calcium-creatinine ratio was calculated, and CCR > 0.04 was considered negative, while CCR ≤ 0.04 was considered positive [7].
Participants were followed up in ANC until delivery; women who developed PE were included in the PE group (82 women) and compared with normotensive controls (164 women) to evaluate the accuracy of CCR in the spot urine sample for the prediction of PE.
Preeclampsia was defined as hypertension and proteinuria after 20 weeks’ gestation in a previously normotensive woman, which regresses after delivery [9–11].
The gestational age was estimated from the last menstrual period and confirmed by an ultrasound done ≤ 20 weeks [12].
Hypertension defined as blood pressure ≥ 140/90 mm Hg on ≥ 2 consecutive occasions at least 4 hours apart after 20 weeks’ gestation [9].
Proteinuria was defined as protein ≥ +1 on a dipstick reading using 2 midstream urine samples > 4 hours apart or 24 hours urine proteins ≥ 300 mg [13, 14].
Gestational hypertension was defined as hypertension of new onset after 20 weeks’ gestation in a previously normotensive woman, without proteinuria or manifestations of PE [13, 14].
Chronic hypertension was defined as hypertension either diagnosed before pregnancy or before 20 weeks’ gestation, which persisted after the 12th week postpartum [13, 14]. Superimposed was PE defined as CH complicated with proteinuria and severe PE [9].
Finally, 82 women in the PE group were compared to 164 normotensive controls to evaluate the accuracy of CCR in a spot urine sample in the prediction of PE (main outcome).
Sample size
The required sample size was calculated using previous studies [8, 15] and G Power software version 3.1.9.4, setting the α-error probability at 0.05, power (1-β error probability) at 0.95%, and effective sample size (w) at 0.5. An effective sample size ≥ 210 women in 2 groups (study and controls) was needed to produce a statistically acceptable figure.
Statistical analysis
Collected data were statistically analysed using the Statistical Package for Social Sciences (SPSS) computer software version 20 (Chicago, IL, USA). Numerical variables were presented as mean and standard deviation (±SD), while categorical variables were presented as number (n) and percentage (%).
The chi-square (χ2) and Student’s t-tests were used to compare qualitative and quantitative variables, respectively. Sensitivity: proportional detection of individuals with the disease of interest in the population. Specificity was defined as the proportional detection of individuals without the disease of interest in the population. Positive predictive value (PPV) was defined as the proportion of all individuals with positive tests, who have the disease. Negative predictive value (NPV) was defined as the proportion of all individuals with negative tests, who are non-diseased.
Results
Two hundred and forty-six pregnant women after 20 weeks’ gestation were recruited from the ANC and followed up until delivery; women who developed PE were included in the PE group (82 women) and compared with normotensive controls (164 women) to evaluate the accuracy of CCR in a spot urine sample for the prediction of PE.
Characteristic of the studied preeclampsia group compared to normotensive controls
There was no significant difference between the studied PE group and normotensive controls regarding the maternal age (26.9 ±5.3 years vs. 27.2 ±4.7, respectively) (p = 0.09), gestational age at recruitment (23.2 ±3.6 weeks vs. 25.1 ±4.1, respectively) (p = 0.9), systolic blood pressure at recruitment (119.8 ±6.3 mm Hg vs. 117.6 ±5.5 mm Hg, respectively) (p = 0.07), and diastolic blood pressure at recruitment (73.4 ±7.1 mm Hg vs. 74.1 ±8.8 mm Hg, respectively) (p = 0.9) (Table 1).
Table 1
Characteristics of the studied preeclampsia group compared to normotensive controls
The gestational age at delivery and parity were significantly lower in the studied PE group compared to normotensive controls (36.1 ±4.3 weeks and 1.7 ±2.6, respectively vs. 39.1 ±3.1 and 3.4 ±1.9, respectively) (p = 0.0002 and 0.0003, respectively) (Table 1).
The body mass index (BMI) was significantly higher in the studied PE group (29.3 ±4.1 kg/m2) compared to the normotensive controls (24.6 ±3.3 kg/m2) (p = 0.01) (Table 1).
The systolic and diastolic blood pressure at delivery were significantly higher in the studied PE group compared to normotensive controls (145.6 ±19.4 and 98.7 ±7.7 mm Hg, respectively vs. 112.9 ±14.7 mm Hg and 80.3 ±5.6 mm Hg, respectively) (p = 0.001 and 0.0003, respectively) (Table 1).
The number of women with previous history of PE was significantly higher in the studied PE group (17/82 [20.7%]) compared to normotensive controls (6/164 [3.6%]) (p = 0.0001) (Table 1).
The urinary calcium, urinary creatinine, and calcium-creatinine ratio of the studied preeclampsia group compared to normotensive controls
Although there was no significant difference between the 2 studied groups regarding the urinary creatinine (p = 0), the urinary calcium was significantly lower in the studied PE group (4.45 ±2.9 mg/dl) compared to normotensive controls (8.56 ±2.3 mg/dl) (p = 0.006). The calcium-creatinine ratio was also significantly lower in the studied PE group (0.04 ±0.16) compared to normotensive controls (0.11 ±0.21) (p = 0.002) (Table 2).
Table 2
The urinary calcium, urinary creatinine, and calcium-creatinine ratio of the studied preeclampsia group compared to normotensive controls
Accuracy of the calcium-creatinine ratio in the prediction of preeclampsia
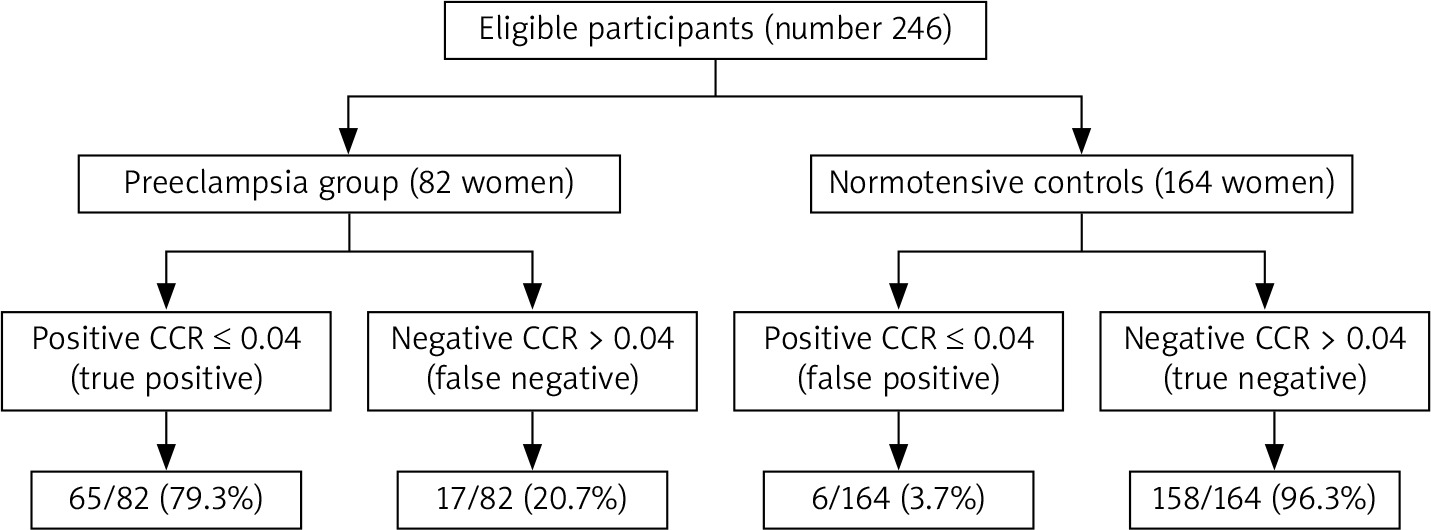
A calcium-creatinine ratio > 0.04 was considered negative, while CCR ≤ 0.04 was considered positive [7]. In the studied PE group, the CCR was true positive (TP) in 79.3% (65/82) while it was false negative (FN) in 20.7% (17/82) in the prediction of PE. In normotensive controls, the CCR was true negative (TN) in 96.3% (158/164) while it was false positive (FP) in 3.7% (6/164) in the prediction of PE (Table 3, Fig. 1).
Table 3
Accuracy of the calcium-creatinine ratio in the prediction of preeclampsia
Fig. 1
Accuracy of the calcium-creatinine ratio in the prediction of preeclampsia
CCR – calcium-creatinine ratio, PE – preeclampsia
A calcium-creatinine ratio ≤ 0.04 had 79.3% sensitivity, 96.3%specificity, 91.5% PPV, 90.3% NPV, and 90.7% overall accuracy in the prediction of PE (Table 3).
Discussion
Currently, there is no reliable diagnostic test to predict women at risk of PE [5]. Rodriguez et al. suggested the use of CCR ≤ 0.04 as a screening test for the prediction of PE [7]. Therefore, 246 pregnant women after 20 weeks’ gestation were recruited from the ANC and followed up until delivery; women who developed PE were included in the PE group (82 women) and compared with normotensive controls (164 women) to evaluate the accuracy of CCR in a spot urine sample for the prediction of PE.
Characteristics of the studied preeclampsia group, gestational age at delivery, and parity compared to normotensive controls
There was no significant difference between the studied PE group and normotensive controls regarding the maternal age, gestational age, systolic blood pressure, and diastolic blood pressure at recruitment.
The gestational age at delivery was significantly lower in the studied PE group (36.1 ±4.3 weeks) compared to normotensive controls (39.1 ±3.1 weeks) (p = 0.0002).
Similarly, Shahbazian et al. found that the mean gestational age at diagnosis of PE was 34.4 ±4.7 weeks [16]. Demirci et al. also found that the mean gestational age at diagnosis of PE was < 34 weeks in 52.6% of women [17]. In addition, Abdelazim et al. found that the gestational age at delivery of PE/superimposed PE was 35.2 ±1.3 weeks [10].
The parity of the studied PE group (1.7 ±2.6) was significantly lower compared to normotensive controls (3.4 ±1.9) (p = 0.0003). Abdelazim et al. found that women with PE/superimposed PE had significantly lower parity compared to women with CH [10]. Demirci et al. also found that 56% of their studied women with PE were nulliparous [17].
The risk factors of preeclampsia
The body mass index of the studied PE group (29.3 ±4.1 kg/m2) was significantly higher compared to normotensive controls (24.6 ±3.3 kg/m2) (p = 0.01).
Similarly, von Dadelszen et al. found that the risk of PE/eclampsia increased in women with high BMI [18]. Boghossian et al. found the pre-pregnancy BMI to be strongly associated with risk of PE either in the first or second pregnancy [19]. Boghossian et al. concluded that in the first pregnancy, the risk of PE for overweight (BMI 25–29.9), obese class I (BMI 30–34.9), and obese class II/III (BMI ≥ 35) women was 1.82, 2.10, and 2.84, respectively, compared to women with normal BMI (18.5–24.9) [19].
The number of women with previous history of PE was significantly higher in the studied PE group (17/82 [20.7%]) compared to normotensive controls (6/164 [3.6%]) (p = 0.0001).
Demirci et al. found that 8.5% of their studied women with PE had previous PE [17]. Hernández-Díaz et al. found that the risk of PE was 14.7% in the second pregnancy for women with PE in their first pregnancy, and 31.9% for women with PE in their previous 2 pregnancies [20]. Hernández-Díaz et al. concluded that having PE in one pregnancy is a strong predictor for recurrence of PE in future pregnancies [20].
The urinary calcium, calcium-creatinine ratio, and accuracy of the calcium-creatinine ratio in predicting preeclampsia
The urinary calcium was significantly lower in the studied PE group (4.45 ±2.9 mg/dl) compared to the normotensive controls (8.56 ±2.3 mg/dl) (p = 0.006). The calcium-creatinine ratio was also significantly lower in the studied PE group (0.04 ±0.16) compared to normotensive controls (0.11 ±0.21) (p = 0.002).
Similarly, Sanchez-Ramos et al. prospectively measured the urinary calcium in 103 nulliparous women at risk of PE. They found that women who later developed PE excreted less urinary calcium than those who remained normotensive throughout gestation [21]. Ozcan et al. also found the CCR to be significantly lower in PE (0.0475 ±0.0260) compared to normotensive controls (0.1466 ±0.1353) (p < 0.0001) [22].
In the studied PE group, the CCR was TP in 79.3% (65/82) while it was FN in 20.7% (17/82) in the prediction of PE. In normotensive controls, the CCR was TN in 96.3% (158/164) while it was FP in 3.7% (6/164) in the prediction of PE.
A calcium-creatinine ratio ≤ 0.04 in this study had 79.3% sensitivity, 96.3% specificity, 91.5% PPV, 90.3% NPV, and 90.7% overall accuracy in the prediction of PE.
Similarly, Sheela et al. found that the CCR had 69.2% sensitivity, 98.2% specificity, 85.7% PPV, 95.8% NPV, and 87% overall accuracy in predicting PE [15]. Sheela et al. concluded that a CCR of 0.04 in a spot urine sample is a good screening test for the prediction of PE compared to microalbuminuria [15].
David et al. also found the CCR had 80% sensitivity, 98.04% specificity, and 96.43% overall accuracy in the detection of hypertensive disorders with pregnancy [8]. In addition, Kamra et al. found that 71.4% of women with CCR < 0.04 developed pregnancy-induced hypertension (PIH) [23].
This study found the gestational age at delivery and parity were significantly lower in the studied PE group compared to normotensive controls. Preeclampsia is more common in women with high BMI and in women with a previous history of PE. A calcium-creatinine ratio ≤ 0.04 had 79.3% sensitivity, 96.3% specificity, 91.5% PPV, 90.3% NPV, and 90.7% overall accuracy in predicting PE.
This study was the first registered study conducted in our region to evaluate the accuracy of CCR in the prediction of PE. Women who refused to participate and/or give consent was the only limitation faced during this study. This study supports that the use of CCR in a spot urine sample for screening and early detection of PE.
Conclusions
A calcium-creatinine ratio ≤ 0.04 had 79.3% sensitivity, 96.3% specificity, 91.5% PPV, 90.3% NPV, and 90.7% overall accuracy in predicting PE. Preeclampsia is more common in women with previous history of PE, low parity, and high BMI. This study supports the use of CCR in a spot urine sample for the screening and early detection of PE.