
Introduction
Menopause is defined as the permanent end of menstruation after a year of full amenorrhoea observed as a result of ovarian function loss [1]. The age of menopause in women around the world of between 40 and 60 years varies from year to year, linked to a variety of factors [2, 3]. The menopause average age is reported as 49 years in Latin America [4]. The average age of menopause in India is 46.2 years [5], 46 years in South Africa, and 51 years in the United States [6]. According to data from the Menopause Society in Turkey, the menopause age is reported as 47 years [7].
Women experience vasomotor, urogenital, psychosomatic, and physiological changes with the transition to menopause [8]. Vasomotor symptoms characterise the menopause transition; however, the general experience is highly variable and is affected by psychological, social, and cultural factors. Hot flushes, night sweats (vasomotor symptoms), genital symptoms (dryness of vagina, dyspareunia), and mood and sleep disorders are included among common symptoms [9, 10].
With the increase in severity of menopause symptoms, studies have shown there is a negative increase in the effect on women’s daily life activities [11, 12]. One study found vasomotor complaints most affected daily life activities, followed by mood, sleep and concentration, and physical and mental exhaustion with eliminating the least affected daily life activity [12]. Another study aiming to research the experience and features of menopause symptoms reported that 84% of women experience hot flushes and 80% have night sweats, with 60% of these being severe symptoms [13].
With the prolongation of life expectancy, a woman spends one-third or more of her life after menopause. As a result, menopause, aging physiology, and process management carry great importance for women’s health [14]. In this period, determining the factors that negatively affect women’s lives and using the results to improve women’s health are among the important responsibilities of health personnel. There are a limited number of studies examining the effects of menopausal symptoms on activities of daily living. Therefore, this study was performed with the aim of determining the effect of menopause symptoms on the daily life activities of women aged 40–64 years.
Material and methods
In this descriptive study, the population comprised women attending a state hospital clinic in the Black Sea region of Turkey. Determination of the number of samples was performed using the unknown population formula because the number of individuals in the target audience was unknown. Using the incidence of menopause symptoms of 55% determined in the study by Yurdakul by et al. [15], it was necessary to include 381 women within the scope of the study.
Inclusion criteria for the research
Women aged 40–64 years, who were married, at least primary school graduates, living with their partner, with no history of psychiatric disease, who were not pregnant, could communicate verbally, and agreed to participate in the research were included in the study.
Data collection
Study data were collected from October 2017 to April 2018. For collection of data, the Personal Information Form prepared by the researchers, the menopause rating scale (MRS), and daily life activities chart were used. Data were collected during face-to-face interviews with women.
Data collection tools
Personal information form
The personal information form containing descriptive features of the women comprised a total of 20 questions created in line with the literature [12, 15, 16]. The personal information form included questions related to the demographic characteristics of the women such as age, weight, height, educational level, partner’s age, partner’s occupation, family type, economic status, body mass index (BMI), and smoking habits. Questions related to obstetric and gynaecological characteristics included the number of pregnancies, number of living children, form of entry into menopause, hormone replacement therapy (HRT) use, the route of entry if menopause was entered, chronic diseases, information known about the menopause, and gynaecological problems.
Menopause rating scale
The menopause rating scale was developed in German by Schneider et al. [17] with the aim of measuring the severity of menopausal symptoms and their effect on quality of life. The scale was adapted to English with reliability and validity performed by Schneider et al. in 1996 [17]. The Turkish validity and reliability for the scale was completed by Gürkan [18]. Likert-type choices about menopausal complaints on the scale are ‘none’ (0 points), ‘mild’ (1 point), ‘moderate’ (2 points), ‘severe’ (3 points), and ‘very severe’ (4 points). Points obtained for each item are used to calculate total points on the scale. The lowest number of points for the scale is 0, and the highest number of points is 44. The scale about menopausal symptoms comprises 11 items and 3 sub-dimensions. The sub-dimensions are somatic complaints (items 1, 2, 3, and 11), psychological complaints (items 4, 5, 6, and 7), and urogenital complaints (items 8, 9, and 10). The increase in total points obtained on the scale shows the increase in severity of complaints experienced. The original form of the scale had a Cronbach α reliability coefficient of 0.84. For subgroups, the Cronbach α value was 0.65 for somatic symptoms, 0.79 for psychological symptoms, and 0.72 for urogenital symptoms [18]. In this study, the Cronbach α values were 0.95 for the whole scale, 0.85 for the somatic symptoms sub-dimension, 0.93 for the psychological symptoms sub-dimension, and 0.93 for the urogenital symptoms sub-dimension.
Daily life activities chart
In this study, the daily life activities chart (DLAC) created to determine the effects of menopause symptoms on daily life prepared by Gözüyeşil and Başer was used [12]. The chart includes items related to work and movement, social activities, free-time activities, sleep, mental state, concentration, physical and mental exhaustion, interpersonal communication, sexuality, eating-drinking, eliminating, enjoyment of life, and general quality of life. The daily life activities chart uses a visual analogue scale (VAS) to transform values which cannot be measured numerically into numerical values. The visual analogue scale has been used for a long time and is accepted in the literature around the world as an easily applied and reliable test. The mean is calculated for values obtained when assessing VAS [19]. The daily life activities chart gives numbers of 0–10 for activities. A value of zero indicates that menopausal symptoms did not prevent daily life activities, while a value of 10 shows they fully prevented activities [12]. The women were asked to mark the extent to which menopausal symptoms affect each of their activities of daily living on a scale numbered 0–10. As the VAS values increased, it is revealed that the menopause symptoms experienced by women prevented daily life activities.
Analysis of data
For analysis of data, the MRS total points of women underwent normality tests. To assess data, descriptive statistical methods like data, number, percentage, arithmetic mean, and standard deviation were used, with Student’s t-test and one-way ANOVA used for independent groups. To analyse which group was the source of difference, the Scheffe test was used. Pearson correlation analysis was used to assess correlations between continuous variables with the MRS and DLAC points. The limit for statistical significance was taken as p < 0.05.
Limitations of the study
There are some limitations to this research. The first of these limitations is that it was completed only in one province and was hospital based. The second limitation is that it included women with the features of being 40–64 years old, who were married, living with their partner, were primary school graduates, not pregnant, could communicate verbally, and volunteered to participate in the research. Due to these limitations, the research results can only be generalised to women in the research.
Results
The mean age of women participating in the research was 54.03 years (SD 6.10) (range 41–64), their mean BMI was 26.75 (range 17.01–46.87), with mean number of living children 1.26 (SD 0.95) (range 0–5). Of these women, 46.7% were in the 50–59-year age group, 33.6% were primary school graduates, 46.2% were housewives, 78.7% lived with a nuclear family, and 61.9% had ‘moderate’ income levels. Regarding their partners, 33.6% were primary school graduates and 37% were self-employed. Of the women, 42.3% lived with ‘one child’ and 22.1% smoked.
Of the women participating in the research, 47.5% had received no information about the menopause, 67.5% had not had a period for more than one year, 95.5% entered the menopause through natural routes, and 77.1% did not use HRT treatment.
The symptoms with highest points on the MRS items were sleep problems 1.77 (SD1.12), hot flushes and sweats 1.75 (SD 1.17), physical and mental exhaustion 1.69 (SD 1.14), depressive mood 1.63 (SD 1.11), and joint and muscular discomfort 1.66 (SD 1.13), which were experienced more intensely than other symptoms (Table 1). The women’s mean points for the MRS and sub-dimensions were 6.28 (SD 3.74) for the somatic symptoms sub-dimension, 6.09 (SD 4.25) for the psychological symptoms sub-dimension, 3.72 (SD 3.08) for the urogenital symptoms sub-dimension, and 16.11 (SD 10.34) for the whole MRS (Table 1).
Table 1
Averages of women’s menopause rating scale items, menopause rating scale, and its sub-dimensions
When the severity levels of menopausal symptoms of ‘mild’, ‘moderate’, ‘severe’, and ‘very severe’ along with incidence rates are considered together, 83.5% of women experienced hot flushes and sweats, 63.2% had heart discomfort (feeling of tightness in the heart, sweating, palpitations that are not normally felt), 86% had sleep problems, 83.8% had a depressive mood, 75.6% were irritable, 65.7% had anxiety/worry, 82.4% had physical and mental exhaustion, 70.1% had sexual problems, 75.8% had urine problems, 66.3% had vaginal dryness, and 55.4% had joint and muscle aches (Table 2).
Table 2
Distribution of menopausal symptoms experienced by women
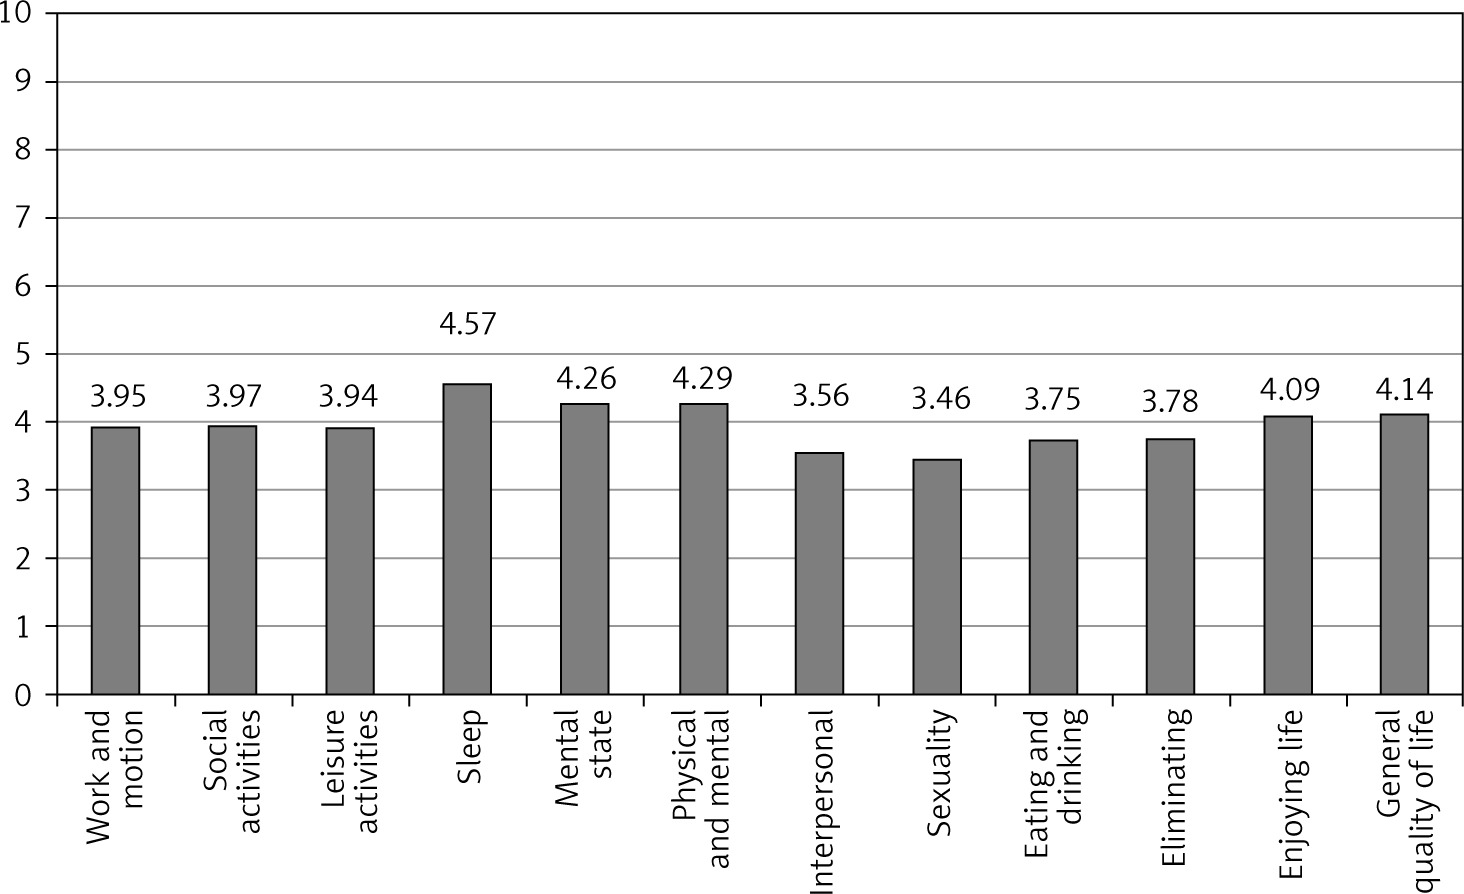
The effect of menopause symptoms experienced by women on daily life activities stated according to VAS with points 0–10 determined that the most affected daily life activities were sleep (4.57 points), physical and mental exhaustion (4.29 points), mental state (4.26 points), general quality of life (4.14 points), enjoying life (4.09 points), and social activities (3.97 points) (Fig. 1).
There were positive significant correlations between the mean number of points for the MRS and somatic symptoms, psychological symptoms, and urogenital symptoms sub-dimensions and mean daily life activity VAS points (p < 0.01). Stated differently, as the severity of menopause symptoms increased, the level of the effect on daily life activities increased (Table 3).
Table 3
Correlations between the daily life activities of women and the menopause rating scale scores
Comparison of demographic characteristics of women included in the research according to MRS mean points found that MRS points increased as age increased and as the educational level fell (p = 0.000), that retirees and housewives had higher points based on working status (p = 0.000), and the differences were statistically significant (p = 0.000). Women with partner education level of ‘primary school graduate’, with ‘retired’ partners, living in ‘extended families’, with ‘low’ income and ‘high’ income had higher mean MRS points compared to others, and the differences were found to be statistically significant (p = 0.035, p = 0.007, p = 0.000, p = 0.000, respectively) (Table 4). It was found that women with “2 children” (12.87 ±10.29) had a lower number of children living together compared to “no children” (19.02 ±8.04), “one child” (16.19 ±9.76), and “3 children or more with them”, and it was found to be statistically significant (p = 0.000) (Table 4).
Table 4
Comparison of the mean scores of the menopause rating scale according to the demographic characteristics of women (n = 381)
When MRS points are investigated according to some other characteristics of women, those with 3 or more pregnancies (p = 0.000), with 3 or more living children (p = 0.000), with chronic diseases (p = 0.000), with body weight perception of ‘overweight’ (p = 0.007), in the ‘overweight’ BMI group (p = 0.016), receiving information about the menopause (p = 0.002), who had not had menstruation for one year (p = 0.000), and receiving HRT (p = 0.028) had a higher mean number of MRS points compared to other women, and the differences were identified to be statistically significant (Table 5).
Table 5
Comparison of the adnexal masses mean points according to some features of women
Discussion
The transition to the menopause and linked symptoms may show large-scale variability. Linked to hormonal changes in this period, vasomotor symptoms, hot flushes, night sweats, cardiovascular system diseases, muscle and skeletal system problems, and atrophy of the breasts and reproductive organs may occur [10, 20]. The effect of menopause symptoms on many systems in a woman’s body directly affect the daily life activities of women in the menopausal period [12].
This study was completed with the aim of assessing the effect of menopause symptoms observed in women 40–64 years old on daily life activities. In this study, the mean number of points for the MRS and sub-dimensions were identified as 6.28 (SD 3.74) for the somatic symptoms sub-dimension, 6.09 (SD 4.25) for the psychological symptoms sub-dimension, 3.72 (SD 3.08) for the urogenital symptoms sub-dimension, and 16.11 (SD 10.34) for the whole MRS (Table 1). Considering that the highest number of points that can be obtained on the MRS is 44, women experienced menopause symptoms at levels below the central value. When the severity of menopausal symptoms was assessed among women in our study, we saw that most were somatic complaints followed by psychological complaints and urogenital complaints. Another study in Turkey reported that women experienced psychological complaints most (8.96 ±4.94), then somatic complaints and urogenital complaints [21]. A study in Iran by Ghazanfarpour et al. identified that women experienced mostly vasomotor complaints, with psychosocial complaints in second place, then physical complaints, and lowest was sexual complaints [22]. We can see that menopausal symptoms display differences in different countries and even in the same country. Despite menopause being a universal case, the effect of different cultures plays an important role in the incidence and severity of menopausal complaints experienced by women.
The points values for the scale assessing menopause symptoms varied from 1.08 (SD 1.04) to 1.77 (SD 1.12) with symptoms with the highest number of points identified as “sleep problems” 1.77 (SD 1.12), “hot flushes and sweats” 1.75 (SD 1.17), “physical and mental exhaustion 1.69 (SD 1.14), “lack of enjoyment” 1.63 (SD 1.11), and “joint and muscular discomfort” 1.66 (SD 1.13). Symptoms with the lowest number of points were identified as “heart discomfort” and “dryness of vagina” (Table 1). When assessed by combining the rates for severity of menopausal symptoms experienced as ‘mild’, ‘moderate’, ‘severe’, and ‘very severe’, 86% of women had sleep problems, 83.8% had lack of enjoyment, 83.5% had hot flushes and sweats, 82.4% had physical and mental exhaustion, 75.6% were irritable, 75.8% had bladder problems, 70.1% had sexual problems, 66.3% had dryness of vagina, 65.7% had worry/anxiety, 63.2% had heart discomfort, and 55.4% had joint and muscular discomfort (Table 2). Mood problems and vasomotor symptoms observed in the perimenopausal period are the most important risk factors for insomnia and disrupted sleep quality in this period [23]. A study by Zolfaghari et al. supporting the results of our study, reported that women experienced sleep problems in the pre-, peri-, and post-menopausal periods, that the time to fall asleep was longer than 30 minutes for postmenopausal women, and that the risk of incidence of obstructive sleep apnoea was higher [24]. Sharma et al., in a study investigating the effect of menopause symptoms on quality of life of women in rural and urban areas, identified that the most severely experienced menopausal symptoms were joint and muscular discomfort, physical and mental exhaustion, and sleep problems. Additionally, despite menopause symptoms being experienced severely by women in both rural and urban areas, higher rates were experienced in rural areas [25]. This difference is thought to be due to culture, nutritional habits, and climate conditions.
Vasomotor symptoms are known as the association of hot flushes, night sweats, and facial blushing, and these are called hot flushes. Hot flushes and sweating in women are stated to cause sufficient discomfort to disrupt sleep in the middle of the night [26–28]. In this study, the second most severe symptom experienced in the menopausal period was hot flushes, affecting 60–90% of women in the transition to menopause and early postmenopausal period, and causing physical discomfort negatively affecting life. The study by Özcan et al. [27] reported that hot flushes were a commonly observed complaint among women in the menopausal period, while Gözüyeşil et al. [12] observed daily hot flushes in 87% of women, and that nearly 30% experienced this problem at least 10 times per day.
In our study, the ‘physical and mental exhaustion’ symptom was among the most severe menopausal complaints (82.4%) (Table 2). A study of menopausal women by Alrashidi et al. [29] assessed symptoms as ‘moderate, severe, and very severe’ along with rates and reported that 95.2% of women experienced joint and muscular discomfort, 88.5% had bladder problems, 84.1% had physical and mental exhaustion, 79.3% lacked enjoyment, 77.8% had sleep problems, 68.2% were irritable, 65.4% had anxiety, 52.2% had hot flushes, 58.7% had heart discomfort, 50.5% had dryness of the vagina, and 51.9% had sexual problems. Aldughaither et al. [30] identified that 64.7% of women had physical and mental exhaustion, while Khan et al. [31] found that 60.2% of women had physical and mental exhaustion. Sharma et al. [25], in studies in northern India, reported that women living in rural areas experienced less physical and mental exhaustion complaints. In our study, ‘joint and muscular discomfort’ held fourth place among menopausal complaints (55.4%) (Table 2). A study by Ahsan et al. [32] stated that 90.53% of women experienced joint and muscle discomfort. The high levels of muscle and joint complaints experienced by women in the menopausal period may be considered to be linked to poor nutrition, insufficient calcium in the diet, and a lack of exercise.
Sexuality is an important part of a healthy life. Changes in the sexual experience during menopause basically linked to the aging process are shaped by underlying biological and psychological changes. Also, a variety of other factors in addition to disease effects, medications, and psychosocial stress factors contribute to sexual function disorder [33]. In our study, the menopausal symptoms of ‘sexual problems’ (70.1%) and ‘dryness of the vagina’ (66.3%) symptoms were observed at lower rates compared to the severity of other complaints (Table 2). Patients should receive training about the causes and available treatments for sexual function disorder. A study by Dinçer et al. [34] reported that women in the menopausal period experience psychological complaints like cooling of sexuality, reduced libido, reduced frequency of sexual relations, and reduced happiness from sexual approaches. Compared to other symptoms in our study, the lower levels of urogenital and sexual complaints lead to the consideration that people in our society may not disclose information due to shyness in relation to talking about these topics.
In this study, it was determined that ‘heart discomfort’ was observed at lower rates compared to other menopausal symptoms (33.8%) (Table 2). Similarly to our study, Alrashidi et al. [29] reported that cardiac symptoms were experienced at lower rates compared to other symptoms in the menopausal period. These findings show that women experience symptoms related to the heart at mild levels.
As a result of points rated from 0 to 10 on the VAS for effect levels on daily life activities of menopause symptoms experienced by women, the effects on daily life activities were determined to be in the order of “sleep problems” (4.57 points), “concentration, physical and mental exhaustion” (4.29 points), “mood” (4.26 points), “general quality of life” (4.14 points), “lack of enjoyment from life” (4.09 points), “social activities” (3.97 points), “work and movement” (3.95 points), “free-time activities” (3.94 points), “eliminating” (3.78 points), “eating-drinking” (3.75 points), “interpersonal communication” (3.56 points), and “sexuality” (3.46 points) (Fig. 1). There are many factors affecting the sleep quality of perimenopausal and postmenopausal women, such as age, previous insomnia episodes, stress, poor health, vasomotor symptoms during the menopausal transition period, and neuropsychiatric symptoms, which are also strongly related to sleep problems [35]. Similarly to our study results, Regestein et al. [26] researched how hot flushes affected the sleep and cognitive performance of middle-aged women and reported that hot flushes in the menopausal period increased anxiety and depression scores, caused sleep problems, and negatively affected cognitive functions. A study in Turkey reported that vasomotor symptoms affected daily life activities of women mostly through mood (6.2 points), followed by sleep and concentration (5.8 points), and physical and mental exhaustion levels, with lowest levels of effect on eliminating habits (4.1 points) [12].
In our study, a positive significant level of correlation was determined between MRS and somatic symptoms, psychological symptoms, and urogenital symptoms subdimension mean points with VAS mean points for daily life activities (p < 0.01). Stated differently, as the severity of menopause symptoms increased, the level of effect on daily life activities increased (Table 3). Studies have proven that as the severity of menopause symptoms increase, there is an increased negative effect on women and on daily life activities [12, 21, 22, 27, 29, 36].
When mean MRS points were compared according to the demographic characteristics of women included within the scope of the research, it was found that MRS points were greater for women who were older and had less education (p = 0.000), with higher points for retired women and housewives (p = 0.000), and the differences were statistically significant (p = 0.000). Women with partners who had the education level of ‘primary school graduate’ (p = 0.035), ‘retired’ partners (p = 0.007), who lived with ‘extended family’ (p = 0.000), and who had ‘low’ and ‘high’ income levels (p = 0.000) had higher MRS mean points compared to other women, and the differences were found to be statistically significant (Table 4). As the number of children lived with increased, the MRS score fell, and the difference was found to be statistically significant (p = 0.000) (Table 4). Study by Shobeiri et al. [37] found that individuals with the lowest scores for complaints in the physical area were university graduates, while individuals with highest scores in the vasomotor area were women with low educational status. Research by Wieder-Huszla et al. [38] stated that women who had a graduate educational level experienced less physical pain compared to women with low education level, and they were better spiritually. Jung et al. [39] noted that many women with a diagnosis of depression in the postmenopausal period were women with a low educational level. It is thought that education creates conscious awareness among women of the process of coping with menopausal complaints, causes changes in their lifestyles, and plays an important role in reducing menopausal complaints. Wieder-Huszla et al. [38] stated that the quality-of-life markers like physical functions and daily activities were positively affected in working women. This study, which supports ours, considered that the attention of women who have a job is focused in different directions and they experience fewer problems related to socializing during the menopause. In contrast to our study findings, a study by Çelik et al. [40] to determine the severity of menopause symptoms and causative factors did not find a significant correlation between the educational levels of women and their partners and menopausal symptoms. Literature findings that are different to those in this study might be due to regional features. It may be interpreted that the partners, being educated, understand their wives’ menopausal complaints and help and supporting them, which positively affects their menopause symptoms.
When mean MRS points are investigated according to some other characteristics of the women in our study, those with 3 or more pregnancies (p = 0.000), with 3 or more living children (p = 0.000), with chronic diseases (p = 0.000), with body weight perception of ‘overweight’ (p = 0.007), in the ‘overweight’ BMI group (p = 0.016), receiving information about the menopause p = 0.002), with longer menopause duration (p = 0.000), and receiving HRT (p = 0.028) had higher mean MRS points compared to other women, and the differences were identified to be statistically significant (Table 5). Kalarhoudi et al. [41] stated that the number of children did not have a significant effect on vasomotor, psychosocial, and physical aspects; however, they stated that women without children had lower values for the sexual aspect compared to women with children. Advanced age with menopause may cause an increase in systemic diseases and is predicted to trigger menopausal symptoms. In a study investigating attitudes to body image, Erbil [20] found that women with an optimistic attitude towards menopause have a more positive body image and have lower levels of depression. The positive effect of positive body image on the mood and attitudes of women is thought to lead to these women experiencing lower rates of menopausal symptoms compared to other women. Some studies related to the effect of BMI on menopausal complaints reported that increased vasomotor complaints were associated with high BMI [42, 43]. In a study by Thurston et al. higher adiposity was associated with fewer physiological hot flashes among older women with hot flashes [44]. There is no consensus about the benefits and side effects of HRT in the menopausal period, while the study by Sylvestre et al. [45] reported that HRT gave no benefit in the treatment of problems related to cognition and mood encountered during the menopausal period.
Conclusions
The research results identified that menopausal symptoms experienced by women negatively affected daily life activities. In line with our research results, the information of women attending menopause clinics should be determined, with education planned for women lacking information about this topic; the number of clinics in which menopausal women can receive easily accessible continuous training and counselling services should be increased; present clinical opportunities should be improved; and educated experienced health personnel should play an effective role in these clinics. However, it is important that training and counselling services pay attention to the individual and sociocultural features of women. Nurses working in clinics should have information about menopausal symptoms and assist women in determining their problems. It is recommended that environments in which women can more easily express problems experienced in the menopause period should be provided and that planning should be performed for interventional studies to reduce menopausal symptoms and hence reduce the effect on daily life activities.