
Introduction
The total body and total marrow irradiation techniques (TBI, TMI) are parts of the conditioning regimen required for haematological malignancies before bone marrow transplantation [1–3]. TBI/TMI methods aim to destroy the remaining cancer cells and prevent the patient from rejecting the transplant [1].
The conventional (non-intensity modulated) TBI schemes used routinely in clinical practice vary depending on the dose, dose rate, fractionation, and irradiation method [4, 5]. The main goal of TBI is to cover the whole body (except the lungs) by the total dose, which is usually 12 Gy and is delivered in 6 treatment fractions. Technically, conventional TBI realisation needs specific geometrical conditions and patient set-up, which differ from routinely used radiotherapy methods [4]. Randomised trials demonstrated that conditioning regimens to bone marrow transplantation, including TBI, have produced better outcomes (i.e. survival rates) than regimens with chemotherapy only [6, 7]. This treatment may have side effects, such as cataracts, infertility, cardiovascular disease, secondary malignancies, nephritis, growth and developmental disorders in children, and most importantly – pneumonitis [8–11]. Treatment-related morbidity and the desire to simplify the conventional TBI method prompted the search for alternatives. One of them is the TMI method, in which the target volume is limited to the bone marrow. TMI is realized by several intensity-modulated techniques (i.e. intensity-modulated radiation therapy, volumetric modulated arc therapy, tomotherapy) that allow the desired dose distribution in the target volume while limiting the dose in the surrounding healthy tissues and/or organs at risk (OAR), which minimizes the side effects of the treatment [12–14]. Increasing the conformity of the dose distributions (i.e. decreasing the dose in the OARs while maintaining the appropriate dose in the tumour) delivered to a large region often leads to longer delivery time and increases treatment complexity [15, 16]. As a result, the treatment plans’ higher complexity can increase the inaccuracies between planned and delivered doses [17–19].
Our previous study [20] evaluated different treatment plan preparation methods for volumetric modulated arc therapy for total marrow irradiation (VMAT-TMI). The examination was focused on the obtained dose distributions and the overall complexity of prepared plans. The current study aims to evaluate the agreement between planned and delivered doses and its potential correlation with the plans’ complexity using γ analysis ArcCHECK (Sun Nuclear Inc., Melbourne, FL, USA) measurements.
Material and methods
Patient data
Ten patients previously treated by TBI were included in the study. All patients had a full-body CT performed by Somatom Definition AS Open (Siemens Medical Solutions, Erlangen, Germany). All patients were scanned with 5 mm slice thickness. Free-breathing mode was used during the extended examination from the top of the head to the mid-thighs. Each patient was placed in a supine position with the arms along the body. The dedicated radiation oncologist outlined all the target volumes and OARs using the Eclipse 15.6 treatment planning system (TPS) (Varian Medical Systems Inc., Palo Alto, USA). Over a dozen OARs were included in the study: brain, eyes, lenses, oral cavity, parotids, thyroid, lungs, heart, liver, kidneys, stomach, spleen, bladder, rectum, bowel, and genitals. The outline of the bones was used to generate the clinical target volume (CTV). The small bony structures for the ribs, clavicular, and shoulders, visible on each CT slice, were included in one general contour. This step allowed us to compensate for respiratory movements and simplify the dose optimization [13]. The planning target volume (PTV) was based on the CTV expanded with a 3 mm margin.
Treatment planning
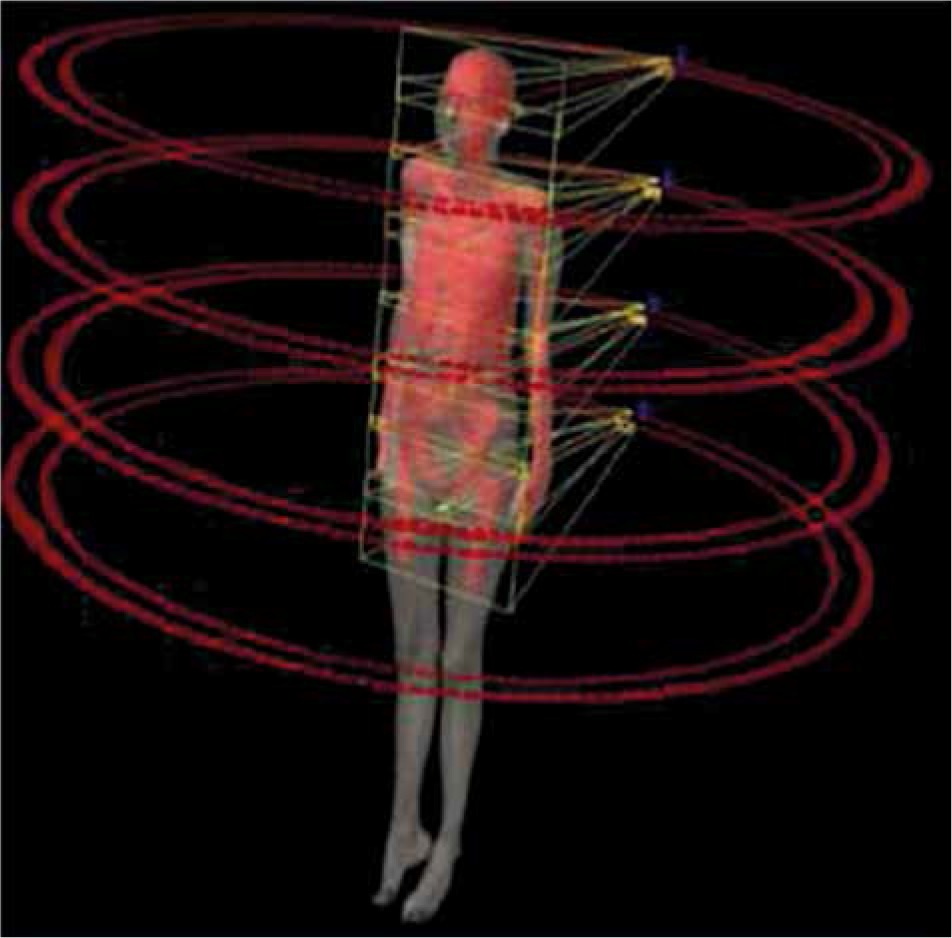
Two different VMAT-TMI plans were prepared for each patient. The first one (P1), previously described by Fogliata et al. [13], assumes the irradiation with 8 full arcs (181–179o) arranged along the patient’s longitudinal axis (Fig. 1). The arcs were grouped around 4 isocentres using asymmetric jaws (2 arcs per isocentre). For each arc, field width (Y direction) was set to 40 cm while the field length (X direction, leaves motion direction perpendicular to the arc rotation) ranged from 14 to 19 cm. Each arc overlapped with adjacent ones by at least 2 cm on each side to prevent hot or cold spots. Isocentre positions and jaw sizes were chosen according to the individual anatomy of the patient. The 8 arcs were optimised simultaneously.
The geometry of the second plan (P2) was the same as that used in P1. The method of P2 preparation involves re-optimisation of P1 with the use of the Monitor Unit Objective (MUobj) tool. The MUobj tool allows control over the number of MUs required to deliver the prescribed dose and is described by 3 variables – minimum MU (MUmin), maximum MU (MUmax), and strength (S). The optimal values of these variables were obtained by us in the previous study [20] and were: 0 (MUmin), 80% of the MUs for P1 (MUmax), and 80 (S).
The dose prescription to the PTV was 12 Gy in six 2-Gy fractions for P1 and P2. It was set to maximise each OAR’s sparing during the optimisation of the dose distribution of each plan. The aim was to obtain in OARs the median doses (D50) below 7 Gy, i.e. around 60% of the prescribed dose. It was also defined to achieve for every PTV the dose lower than 110% of the prescribed dose, limiting the parameter D2 to 13.2 Gy. The second limit for PTV was set to get the dose higher than 90% of the prescribed dose. D98 was defined to have 10.8 Gy at least. Finally, the plans were normalised to the mean PTV dose [21]. VMAT-TMI treatment planning was carried out using RapidArcTM, provided within the Eclipse TPS where the progressive resolution optimization algorithm ver. 15.6 was used to optimize plans. Both plans used 6 MV photon arcs with the maximum dose rate of 600 MU/min. For each arc, collimator rotation was set to 90o, providing the best dose distribution as shown by other authors [12, 13, 22]. The final calculation was performed using AAA (analytical anisotropic algorithm, version 15.6.05) with a calculation grid size of 2.5 mm. Both plans were designed and optimized for the TrueBeam accelerator (Varian Medical Systems Inc., Palo Alto, USA) equipped with a Millennium MLC with leaf width of 5 mm at the isocentre in the inner 40 cm and 10 mm for the peripheral 20 leaves.
As shown in our previous study [20], the planned doses in PTV as well as in OARs were comparable for both planning strategies (i.e. P1 and P2).
Delivery quality assurance
The ArcCHECK cylindrical diode array (Sun Nuclear Inc., Melbourne, FL, USA) was used for pre-treatment dosimetric verification. The treatment planned dose distributions were re-calculated on the ArcCHECK CT (dose grid size: 2.5 mm) for the actual planned gantry and collimator angles. The SNC software ver. 8.2.0 (Sun Nuclear Inc., Melbourne, FL, USA) integrated with ArcCHECK hardware allows us to combine data from 2 exposures of extended fields up to 36 cm and can be used to measure a long field or 2 arcs with a common isocentre. For each isocentre, the entire plan consisting of 2 arcs with the original plan’s parameters was verified, then the ArcCHECK was inverted, and both arcs were delivered again. The software then linked the 2 exposures together to create a single dose map. In the area where the 2 exposures overlap, the dose is averaged on each diode. Before the measurement, the device was checked for short-term reproducibility, dose linearity, dose rate dependence, dose per pulse dependence, field size dependence, out of field dependence, and directional dependence [23].
The dosimetric verification for every plan was based on the evaluation of the agreement between planned and delivered doses for 4 independent regions (i.e. determined geometrically by 2 arcs placed in 1 isocentre), which were, respectively: (I) head and neck, (II) chest, (III) abdomen and upper pelvis, and (IV) lower pelvis and thighs. The evaluation was based on the γ method performed in a global mode for 4 combinations of γ-index criteria (i.e. dose difference [DD] in per cent and distance to agreement [DTA] in millimetres) that were as follows: 2% and 2 mm, 2% and 3 mm, 3% and 2 mm, and 3% and 3 mm. The threshold was 5% and was normalised to the maximum planned dose. The plans where the γ passing rate (GPR) was higher than 95% were considered acceptable.
Data analysis
The GPR for P1 and P2 were compared and analysed relative to the complexity of the plans. The analysis was performed for each region separately, i.e. for head and neck, chest, abdomen and upper pelvis, and lower pelvis and thighs.
In order to facilitate the replication of our research, 3 complexity indices that are easy to extract from the Eclipse TPS were used [20]:
relative monitor units per arc (RMU [MU/Gy]) defined as the total monitor units divided by the number of arcs and the prescribed fraction dose. The total monitor units were the sum of monitor units for all arcs in each analysed region.
mean monitor units per control point (MMU [MU]) calculated as the sum of monitor units for control points divided by the number of control points.
the mean dose rate per control point (MDR [MU/min]) was the sum of dose rates for control points divided by the number of control points.
To detect statistically significant differences between the dosimetric results for P1 and P2, the Wilcoxon test was used. The statistical significance of the results was confronted with their clinical importance, i.e. the number of passed verification (GPR > 95%) was counted for each combination of γ-index criteria and both planning scenarios used in the study. The Pearson correlation was used to check the relationship between the dosimetric results obtained for the examined plans and the complexity of these plans described by RMU, MMU, and MDR indices. All statistics were performed with a 0.05 significance level.
Results
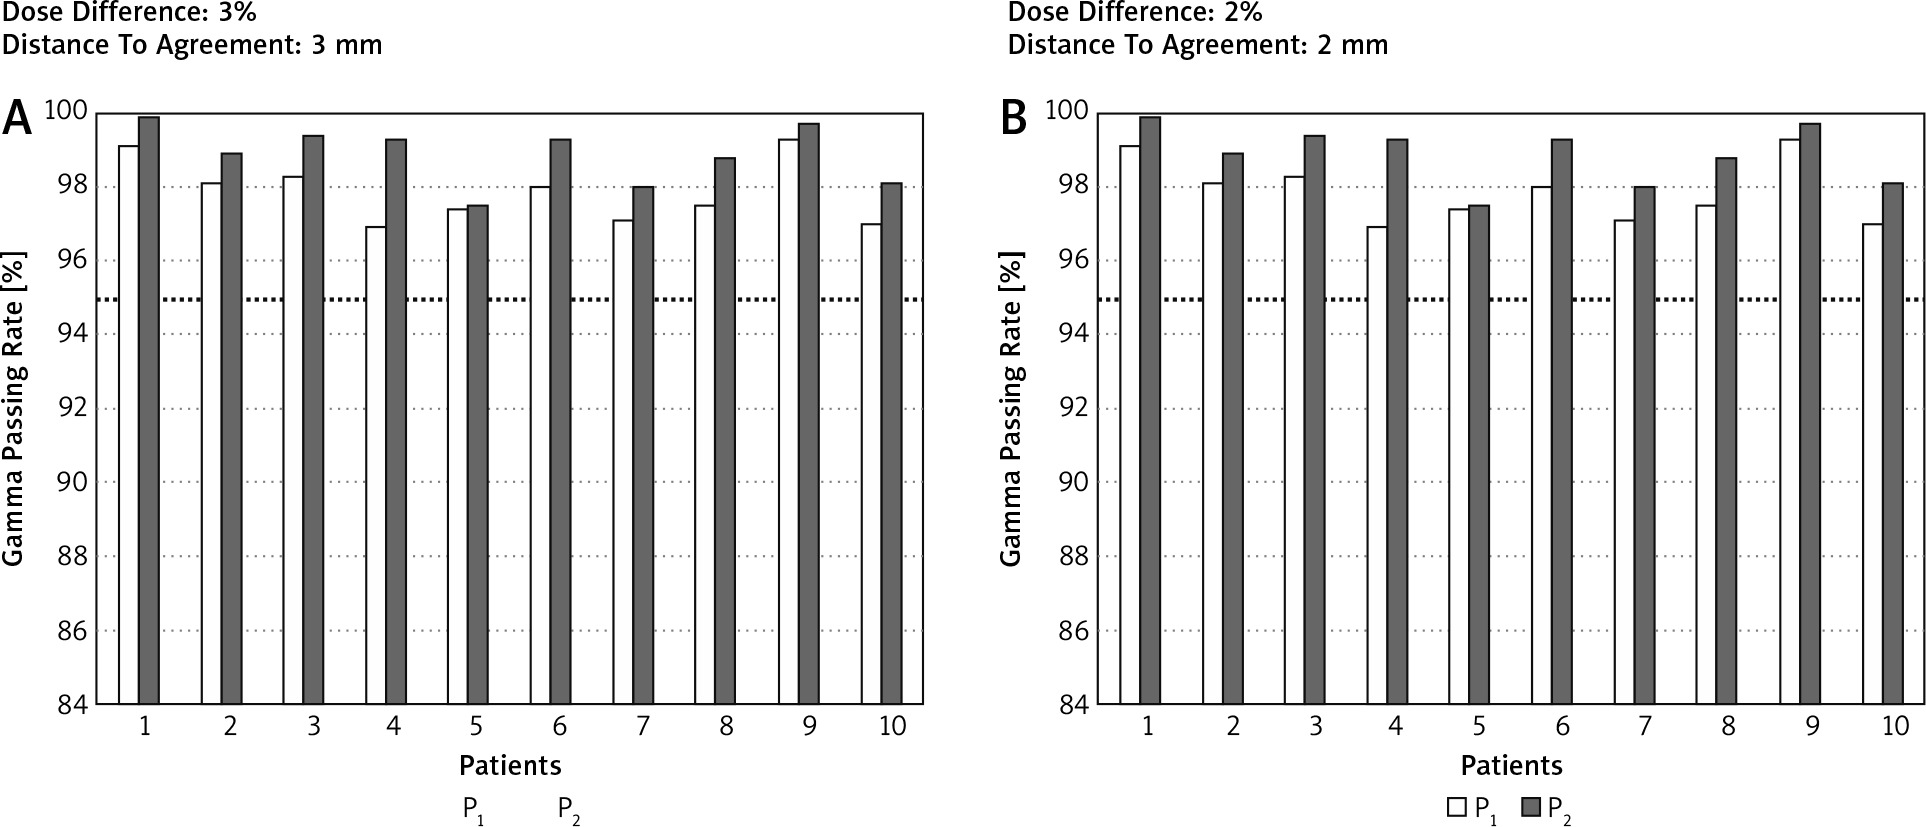
Table 1 shows the comparison of the GPR between P1 and P2. Despite the detection of statistical significance for many comparisons between P1 and P2, only the observations with hard g-index criteria combinations (DD/DTA) were clinically meaningful. For example, the mean GPR in the chest region for 2%/3 mm for P1 was 93.7 while for P2 it was 96.2. In this case, 8 of 10 observations for P2 passed the acceptance criteria (GPR > 95%) while for P1, only 2 of 10 observations were accepted. Figure 2 shows an example of GPR results obtained for the chest region for 2 g-index combination criteria, i.e. 3%/3 mm and 2%/2 mm. Except for the head and neck region, the GPR was always superior for P2. All GPRs obtained for the head and neck region were higher than 95% regardless of the planning scenario or the combinations of g-index criteria, and the differences between GPRs for P1 and P2 were clinically insignificant.
Table 1
The comparison of the g passing rates between 2 planning scenarios (P1 and P2). The bold data show the results where clinical importance between P1 and P2 was noted. Testing performed with a 0.05 significance level for different g-index criteria and 4 anatomical regions
Fig. 2
The g passing rates obtained for the chest region and 2 combinations of dose difference [%] and distance to agreement [mm] values (i.e. 3%/3 mm and 2%/2 mm). Computations of the g passing rates performed in a global mode. The dotted line represents the 95% level of g passing rate
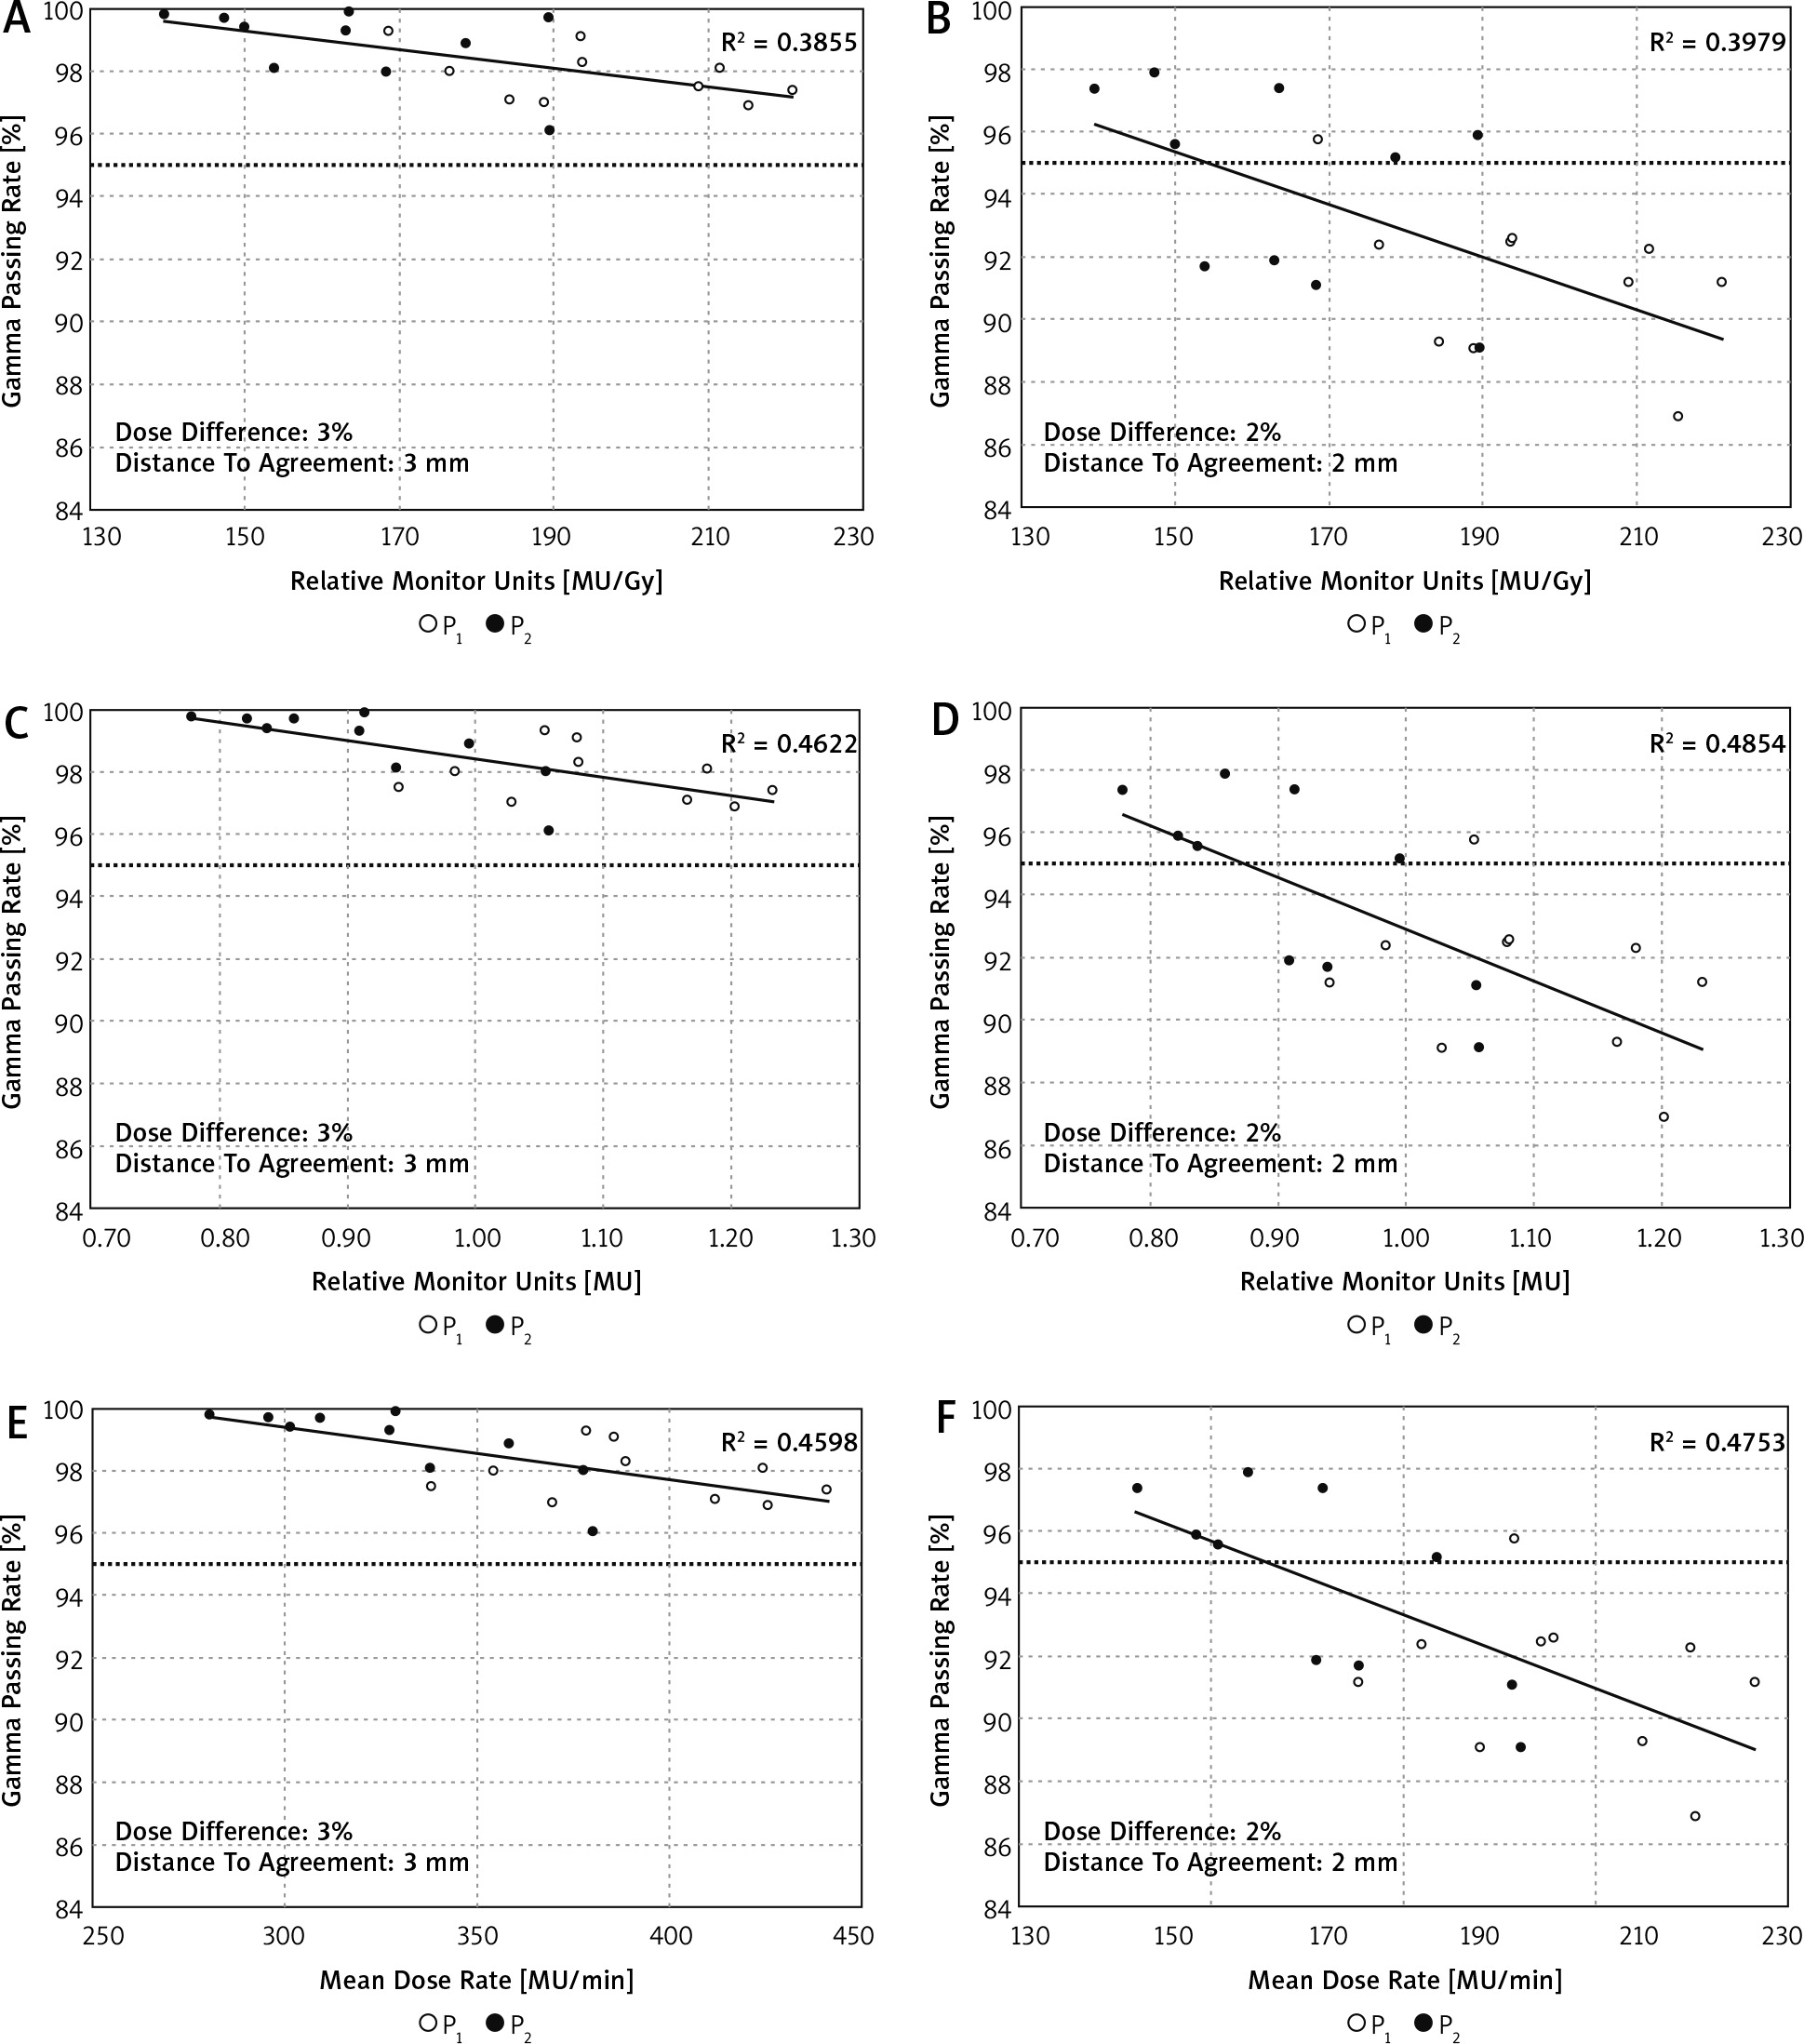
The GPRs obtained for the chest region strongly correlated with the complexity indices of the plans (Table 2). According to the Guilford classification [24], all correlations for this region can be described as high (i.e. 0.5 < R < 0.7) and negative, which means that by increasing the complexity indices, the GPRs decrease (Fig. 2). For other regions, the correlations were not as spectacular as those observed for the chest area. For the abdomen and upper pelvis region, only for hard γ-index criteria (i.e. 2%/2 mm), the GPRs correlates with the MMU and MDR indices. For the lower pelvis and thighs region, we found the correlations between GPRs and the RMU.
Table 2
The correlation between γ passing rate obtained for different g-index criteria and 3 complexity indices (i.e. relative monitor units per arc, mean monitor units per control point, mean dose rate per control point) for four anatomical regions. Pearson correlation performed with a 0.05 significance level
Discussion
The MUobj tool was the main factor determining differences between P1 and P2 plans. As we showed previously [20], usage of MUobj in P2 plans effectively reduces the plan’s complexity without significant changes in the doses in PTV and OARs. The P2 plans require a longer preparation time than P1. However, it allows irradiation to be carried out in a shorter time than P1 [20]. The current study based on the same group of patients complements our previous findings by evaluating GPRs obtained for P1 and P2 and analysing how the reduction of complexity impacts the agreement between planned and delivered doses. The impact of patient positioning accuracy on the accuracy of delivered doses was examined elsewhere [25] as well as the doses deposited in the junction areas of the fields [22, 26].
The comparison of the planned and delivered doses showed statistically significant differences between the GPRs for P1 and P2, regardless of the combinations of DD/DTA values (Table 1). However, a lot of these differences for GPRs ranged from 95 to 100%. According to current dosimetric consensus [27], only the GPRs lower than 95% should be noted as clinically unacceptable. Such GPRs were observed for hard DD/DTA combinations (2%/3 mm and 2%/2 mm) in 3 analysed regions (i.e. chest, abdomen and upper pelvis, and lower pelvis and thighs). The comparisons between P1 and P2, for which we found the differences between the number of passing verifications (GPR > 95%), were noted as clinically important (bolded results in Table 1). In each of the cases, where clinically important differences were reported, the GPRs were better for P2 (e.g. mean GPRs for chest region and 2%/3 mm were 93.73% for P1 and 96.2% for P2).
Several metrics were proposed to describe the complexity of the plan [28]. In many cases, to use them, in-house tools are needed [29]. Miften et al. predicted that more complex plans have greater uncertainties in dose calculation and treatment delivery compared to non-modulated plans [27]. To check this assumption, we analysed the correlations between the results of GPRs and 3 complexity indices (i.e. RMU, MMU, and MDR) that are easy to extract from the treatment planning system. As shown in Table 2, the correlations between GPRs and these indices depend on the analysis region. A better correlation was observed for regions containing structures that are significantly different in densities. We found high correlations between GPRs and every complexity index for the chest region, and no correlations for the head and neck region. Figure 3 shows an example of correlations between GPRs and complexity indices for the chest region and 2 DD/DTA combinations (i.e. 3%/3 mm and 2%/2 mm).
Fig. 3
Correlations between g passing rates and complexity indices for the chest region and 2 combinations of dose difference [%] and distance to agreement [mm] values (i.e. 3%/3 mm and 2%/2 mm). Computations of the g passing rates performed in a global mode. The dotted line represents the 95% level of g passing rate
Conclusions
The plans where the tool for reduction of monitor units was used (P2) were found to have better agreement between planned and delivered doses compared to analogous plans (P1) created without using this tool. The correlation between γ analysis results (GPR) and the plans’ complexity depends on the anatomical region for which the plan is created. For the chest region, we observed high correlations between GPR and each metric used in this study to determine the plan’s complexity, while no correlation was observed for the head and neck region.


