
Summary
An association exists between low socioeconomic status and increased cardiovascular and all-cause mortality worldwide. However, there are no data in patients with aortic stenosis treated with transcatheter aortic valve implantation (TAVI). We found that even though patients in lower and higher educational groups had different baseline characteristics, their periprocedural and mid-term outcomes after TAVI did not differ. The findings of this study underline the importance of early intervention of risk factors in patients with a lower level of education. Once these patients undergo TAVI, their periprocedural and mid-term outcomes are comparable to patients with a higher level of education.
Introduction
An association exists between low socioeconomic status (SES) and increased cardiovascular and all-cause mortality worldwide [1–4]. This relationship has been extensively studied primarily in coronary artery disease (CAD), and many studies have demonstrated increased mortality in acute coronary syndrome (ACS) in patients with low SES [5–9]. Education, rather than wealth, is the socioeconomic indicator most consistently associated with outcomes [4]. Other factors, including income, cardiovascular risk factors, and health behaviors only partially explain this relationship [10].
Aortic stenosis (AS) is the most common primary valve disease leading to intervention in Europe and North America, with a growing prevalence due to the ageing population [11]. Aortic stenosis shares several risk factors with atherosclerosis and CAD [12], although therapy differs [13]. Transcatheter aortic valve implantation (TAVI) is now the method of choice for a wider range of patients and has led to fewer untreated patients [14–17].
Aim
We hypothesized that a lower level of education would have similar adverse effects on prognosis of patients with severe AS as seen in CAD. We conducted this study to evaluate the impact of educational level, as an indicator of socio-economic status, on baseline characteristics and periprocedural and mid-term outcomes of patients with severe aortic stenosis after TAVI.
Material and methods
Design
We conducted a single-center, retrospective observational study comparing outcomes of adult patients with severe AS who underwent TAVI based on their SES. We used educational status rather than wealth as a socioeconomic indicator, because of its stronger association with outcomes [4]. The study was conducted in accordance with the principles of the Declaration of Helsinki.
Patients and procedures
A total of 379 consecutive patients with severe AS who underwent TAVI between 2010 and 2020 were enrolled in this study. Patients were first admitted either as hemodynamically stable for planned diagnostic evaluation or admitted acutely with decompensated heart failure. Diagnosis of severe AS was made according to echocardiographic criteria. The indication for TAVI was established by a consensus of members of the Heart Team. All TAVI procedures were performed by highly experienced interventional cardiologists at a single tertiary center. Clinical, demographic, and echocardiographic data were recorded at baseline and during follow-up. Patients had a clinical and echocardiographic examination 5 days after TAVI, 30 days after TAVI, and 1 year after TAVI. Information on education was obtained on admission or through phone calls. Information on specific events was obtained from follow-up visits and from the National Institute of Health Information and Statistics.
Patients were divided into two groups based on their educational level. The group with a lower level of education (LLE) had a primary school education, and/or vocational school education as a form of secondary education; overall, this group had a total of 12 years of school attendance or less. The group with a higher level of education (HLE) had secondary school education other than vocational and tertiary education; overall, this group had 13 or more years of school attendance.
Outcomes
Primary outcomes were mid-term (I) all-cause mortality and (II) cardiovascular mortality. Secondary outcomes included device success (DS) and early safety (ES) defined according to the “Standardized endpoint definitions for transcatheter aortic valve implantation clinical trials: a consensus report from the Valve Academic Research Consortium (VARC2)” [18]. Device success was defined as the absence of procedural mortality, correct positioning of a single prosthetic heart valve, as well as the intended performance of the prosthetic heart valve. Early safety was defined as a composite endpoint at 30 days including all-cause mortality, all stroke, life-threatening bleeding, acute kidney injury stage 2 or 3, coronary artery obstruction requiring intervention, major vascular complication, and valve-related dysfunction requiring a repeated procedure [18].
Statistical analysis
Data are presented as means ± standard deviations (SD) for normally distributed variables and median ± interquartile range for variables with non-normal distribution. Continuous variables of the LLE and the HLE groups were compared using the Welch two-sample t test for the normally distributed variables and by the two-sample Wilcoxon test for the variables with some outliers. Categorical variables were compared using Pearson’s χ2 test of independence or Fisher’s exact test (in the case of small, expected counts).
The log rank test was used to compare survival times between groups; Kaplan-Meier estimates of the survival curves are presented. A Cox proportional hazards model was used to identify predictors of all-cause mortality and cardiovascular mortality. A multivariate Cox model was built with all potential predictors of survival identified in univariate analysis. The model was used to test the differences between the LLE and HLE groups and to adjust for potential baseline differences between the groups. All analyses were performed using the statistical program R. A p-value < 0.050 was considered statistically significant.
Results
Baseline characteristics
A total of 439 patients with severe AS underwent TAVI at a single tertiary cardiology center between 2010 and 2020. After excluding 46 patients who had missing data on education, and 14 who underwent TAVI for aortic regurgitation or valve-in-valve procedures, 379 were included in the analysis. Mean follow-up was 2.1 ±1.8 years.
We identified 212 patients with LLE and 167 patients with HLE. Baseline clinical and echocardiographic characteristics of the study population are summarized in Table I. Patients with LLE were significantly younger (p = 0.006), more frequently female (p < 0.001), had a higher body mass index (BMI; p = 0.037), a higher prevalence of type 2 diabetes mellitus (p = 0.013), and moderate or severe aortic regurgitation (p = 0.026) compared with patients with HLE. Ten patients, all in the LLE group, required urgent TAVI (p = 0.003).
Table I
Baseline characteristics*
| Parameter | Educational status | P-value | |
|---|---|---|---|
| Low (n = 212) | High (n = 167) | ||
| Age [years] | 77.4 ±7.2 | 79.4 ±6.5 | 0.006 |
| Male, n (%) | 88 (42) | 100 (60) | < 0.001 |
| Follow-up [years] | 2.1 ±1.8 | 2.1 ±1.8 | 0.997 |
| Body mass index | 29.5 ±5.7 | 28.3 ±4.8 | 0.037 |
| NYHA class† | 3.0 ±1.0 | 2.5 ±1.0 | 0.113 |
| NYHA class ≥ III, n (%) | 112 (53) | 74 (44) | 0.061 |
| Diabetes mellitus, n (%) | 91 (43) | 51 (31) | 0.013 |
| Arterial hypertension, n (%) | 170 (80) | 136 (81) | 0.760 |
| Atrial fibrillation, n (%) | 64 (30) | 65 (39) | 0.075 |
| Coronary artery disease, n (%) | 93 (44) | 76 (46) | 0.750 |
| Creatinine [µmol/l]† | 87.0 ±34.5 | 89.0 ±35.0 | 0.246 |
| Hemoglobin [g/l] | 125.4 ±17.1 | 124.9 ±17.0 | 0.752 |
| Platelets [× 109/l] | 209.1 ±70.0 | 188.0 ±60.6 | 0.002 |
| Pacemaker, n (%) | 23 (11) | 23 (14) | 0.387 |
| STS score† | 2.6 ±2.6 | 2.3 ±2.1 | 0.273 |
| Acute procedure, n (%) | 10 (5) | 0 (0) | 0.003 |
| Agatston score† | 2428 ±1418 | 2994 ±2058 | 0.054 |
| Peak velocity [m/s] | 4.1 ±2.2 | 4.2 ±2.3 | 0.290 |
| Mean gradient [mm Hg] | 41.0 ±13.6 | 43.1 ±14.3 | 0.149 |
| Aortic valve area [cm2] | 0.7 ± 0.2 | 0.7 ±0.2 | 0.741 |
| Aortic regurgitation grade ≥ 3, n (%) | 16 (8) | 4 (2) | 0.026 |
| LVEF (%)† | 57.5 ±13.3 | 60.0 ±13.3 | 0.360 |
| Septal wall thickness [mm] | 12.6 ±2.2 | 12.7 ±1.8 | 0.612 |
| Posterior wall thickness [mm] | 11.9 ±1.7 | 11.9 ±1.5 | 0.917 |
| Mitral regurgitation grade ≥ 3, n (%) | 20 (9) | 14 (8) | 0.857 |
| Bicuspid aortic valve, n (%) | 30 (14.2) | 23 (13.8) | 1.000 |
Periprocedural outcomes
During TAVI, Acurate (Boston Scientific, USA) valves were implanted more often in the LLE group (p = 0.007), and Evolut R (Medtronic, USA) valves were more often implanted in the HLE group (p = 0.001). After TAVI, it was necessary to implant a permanent pacemaker more often in the HLE group (p = 0.030). All other procedural and postprocedural parameters were comparable between the two groups (Table II).
Table II
Procedural and postprocedural characteristics*
| Variable | Educational status | P-value | |
|---|---|---|---|
| Low (n = 212) | High (n = 167) | ||
| Device, n (%): | |||
| Acurate | 84 (40) | 44 (26) | 0.007 |
| CoreValve | 25 (12) | 17 (10) | 0.620 |
| Evolut | 57 (27) | 71 (43) | 0.001 |
| Lotus | 46 (22) | 35 (21) | 0.862 |
| Balloon valvuloplasty, n (%) | 83 (40) | 69 (41) | 0.724 |
| Open surgical access, n (%) | 100 (47) | 92 (55) | 0.126 |
| Contrast dye [ml]† | 120 ±60 | 120 ±70 | 0.806 |
| Troponin in 24 h [ng/l]† | 511.9 ±886.9 | 504.0 ±743.2 | 0.733 |
| Creatinine [µmol/l]† | 77.8 ±38.8 | 77.0 ±43.5 | 0.394 |
| Hemoglobin [g/l] | 113.5 ±18.4 | 111.9 ±17.1 | 0.390 |
| Platelets [× 109/l] | 138.5 ±57.7 | 127.8 ±48.6 | 0.052 |
| AVB requiring PM implantation, n (%) | 35 (17) | 43 (26) | 0.030 |
| Length of hospital stay after TAVI [days] | 6 ±3 | 6 ±3 | 0.858 |
Mid-term outcomes
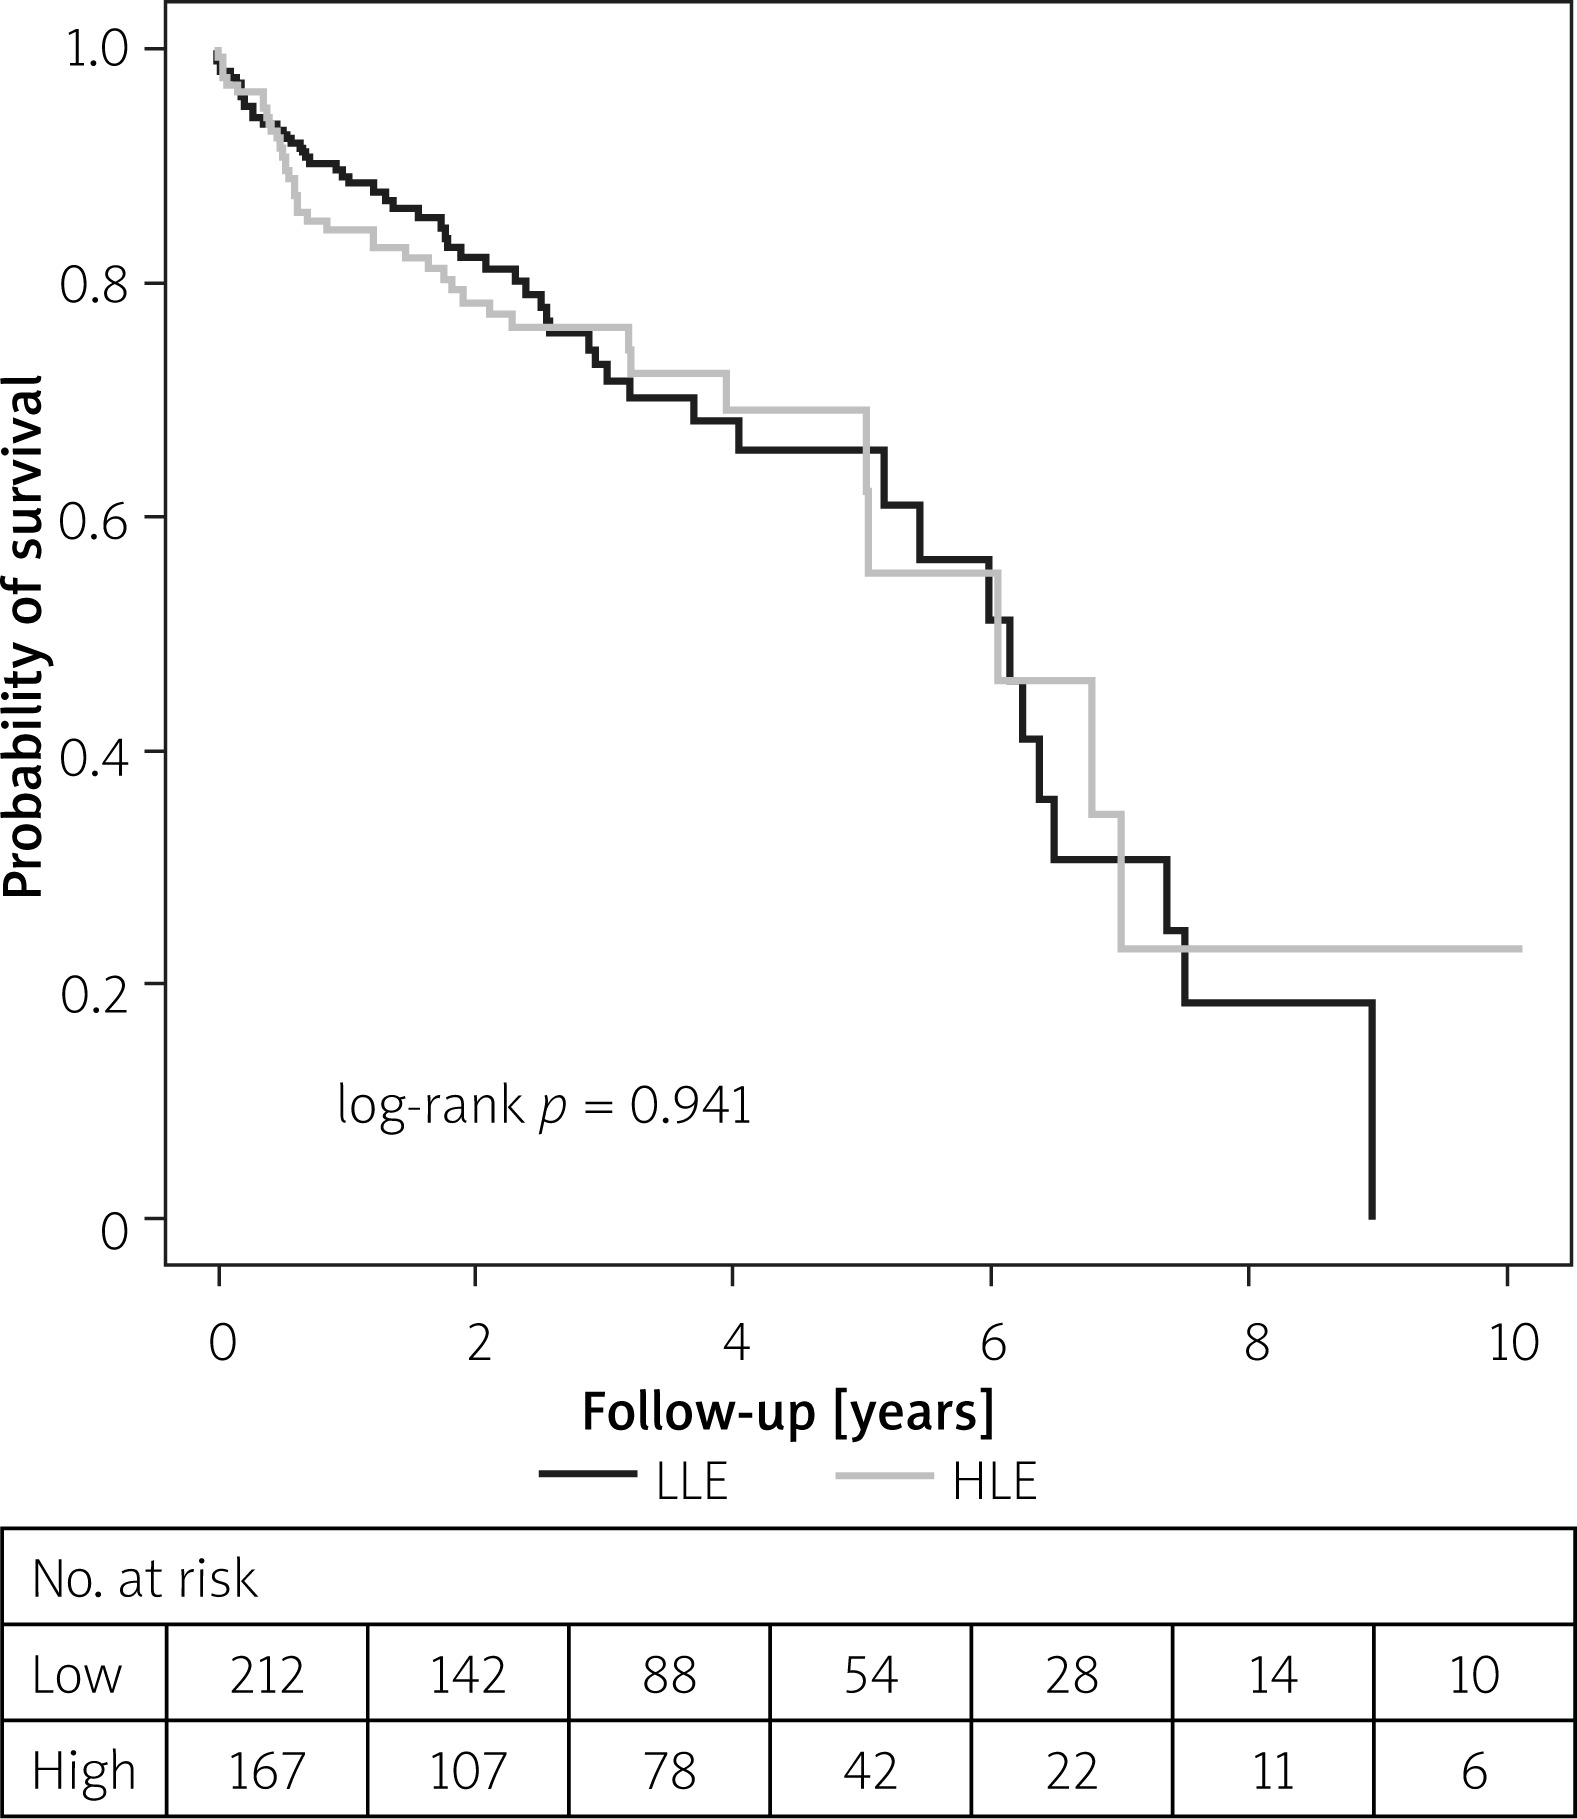
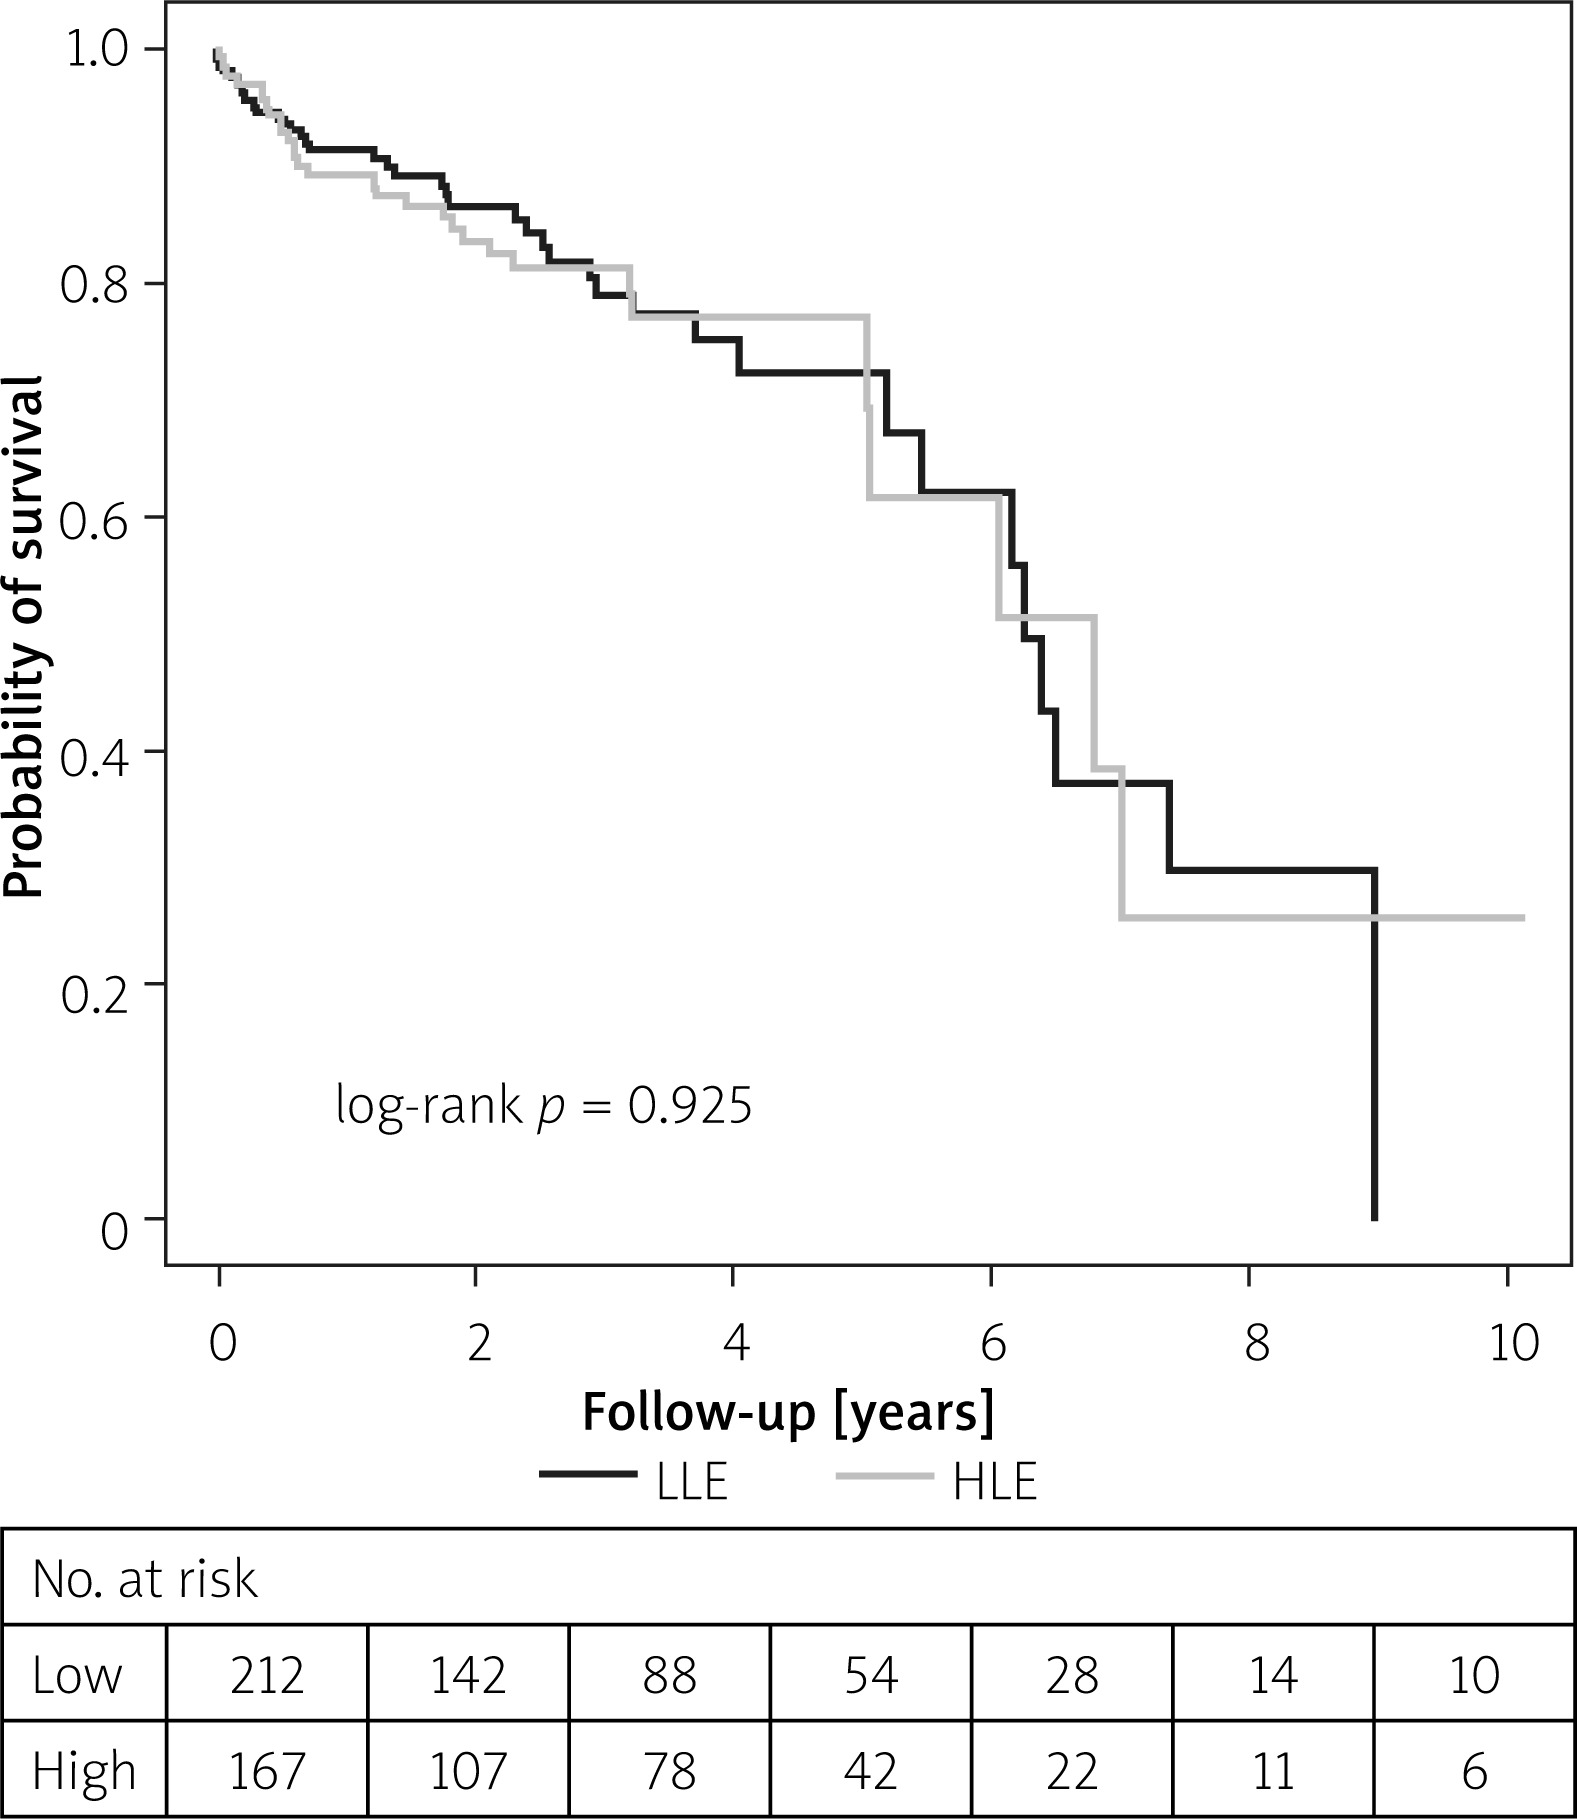
A total of 92 deaths occurred during 796 patient-years, which translates to 11.7 and 11.4 deaths per 100 patient-years in the LLE and HLE group, respectively. Periprocedural, 30-day, first year and all-cause mortality during follow-up were 4/379 (1.1%), 12/379 (3.2%), 44/379 (11.6%), and 92/379 (24.3%), respectively. Cardiovascular mortality rates after the first year and during follow-up were 33/379 (8.7%) and 71/379 (18.7%), respectively. Between study groups, we did not find any difference in mortality evaluated in various time periods (Table III, Figures 1, 2). Relative risk of all-cause mortality for the LLE group compared with the HLE group was 0.984 (95% CI: 0.651–1.489), and relative risk of cardiovascular mortality was 0.978 (95% CI: 0.610–1.566).
Table III
Clinical outcomes and echocardiographic characteristics after TAVI*
| Variable | Educational status | P-value | |
|---|---|---|---|
| Low (n = 212) | High (n = 167) | ||
| All-cause mortality at 72 h, n (%) | 3 (1) | 1 (1) | 0.634 |
| Incorrect positioning of a valve, n (%) | 6 (3) | 6 (4) | 0.674 |
| Myocardial infarction at 72 h, n (%) | 0 (0) | 1 (1) | 0.442 |
| All-cause mortality at 30 days, n (%) | 6 (3) | 6 (4) | 0.674 |
| Major stroke at 30 days, n (%) | 4 (2) | 3 (2) | 1.000 |
| Life-threatening bleeding at 30 days, n (%) | 7 (3) | 3 (2) | 0.523 |
| Acute kidney injury – stage 2 or 3, n (%) | 1 (1) | 2 (1) | 0.586 |
| Major vascular complications at 30 days, n (%) | 9 (4) | 7 (4) | 0.979 |
| Device success, n (%) | 200 (94) | 159 (95) | 0.707 |
| Early safety, n (%) | 197 (93) | 154 (92) | 0.805 |
| All-cause mortality during follow-up, n (%) | 52 (25) | 40 (24) | 0.941 |
| Cardiovascular mortality during follow-up, n (%) | 40 (19) | 31 (19) | 0.925 |
| Peak velocity before discharge [m/s] | 2.2 ±1.4 | 2.1 ±1.4 | 0.242 |
| Mean gradient before discharge [mm Hg] | 10.2 ±4.9 | 9.6 ±4.4 | 0.198 |
| Aortic regurgitation grade ≥ 3 before discharge, n (%) | 2 (1) | 3 (2) | 0.659 |
| Peak velocity at 1 year [m/s] | 2.2 ±1.3 | 2.1 ±1.4 | 0.532 |
| Mean gradient at 1 year [mm Hg] | 9.7 ±3.7 | 9.6 ±4.4 | 0.921 |
| Aortic regurgitation grade ≥ 3 at 1 year, n (%) | 1 (1) | 0 (0) | 1.000 |
| LVEF at 1 year (%)† | 60.0 ±5.0 | 60.0 ±5.0 | 0.702 |
Subanalysis
In a univariate analysis, all-cause mortality was associated with NYHA ≥ III, atrial fibrillation, and increase in creatinine levels after the procedure (Table IV). Similar results were also seen for cardiovascular mortality with the exception of increase in creatinine levels (Table IV). P-values were < 0.050 for all above – mentioned variables.
Table IV
Univariate analysis of all-cause and cardiovascular mortality and its association with categorical and continuous variables*
| Variable | All-cause mortality | Cardiovascular mortality | ||
|---|---|---|---|---|
| RR (95% CI) | P-value | RR (95% CI) | P-value | |
| Categorical variables: | ||||
| Male gender | 1.339 (0.880–2.036) | 0.171 | 1.224 (0.758–1.976) | 0.408 |
| NYHA ≥ III before TAVI | 1.605 (1.022–2.520) | 0.038 | 2.203 (1.276–3.802) | 0.004 |
| Diabetes mellitus | 1.357 (0.897–2.054) | 0.147 | 1.362 (0.849–2.184) | 0.198 |
| Arterial hypertension | 0.877 (0.523–1.472) | 0.619 | 0.951 (0.520–1.739) | 0.870 |
| Atrial fibrillation | 2.108 (1.395–3.188) | < 0.001 | 1.901 (1.185–3.050) | 0.007 |
| Coronary artery disease | 1.329 (0.879–2.010) | 0.176 | 1.284 (0.802–2.056) | 0.297 |
| Pacemaker before TAVI | 1.243 (0.714–2.164) | 0.441 | 1.279 (0.688–2.381) | 0.436 |
| Pacemaker after TAVI | 0.994 (0.598–1.651) | 0.980 | 0.771 (0.429–1.385) | 0.730 |
| Balloon valvuloplasty during TAVI | 0.844 (0.537–1.327) | 0.463 | 0.974 (0.584–1.625) | 0.920 |
| Open surgical access | 1.329 (0.837–2.111) | 0.226 | 1.344 (0.794–2.276) | 0.270 |
| Creatinine worsening after the procedure | 1.606 (1.042–2.473) | 0.030 | 1.572 (0.959–2.578) | 0.071 |
| Continuous variables: | ||||
| Age | 1.050 (1.011–1.090) | 0.011 | 1.049 (1.005–1.095) | 0.028 |
| Body mass index | 0.942 (0.903–0.982) | 0.005 | 0.958 (0.915–1.002) | 0.063 |
| Creatinine before TAVI† | 1.029 (1.012 - 1.047) | 0.001 | 1.029 (1.008–1.050) | 0.006 |
| Creatinine after TAVI† | 1.029 (1.015–1.045) | < 0.001 | 1.030 (1.013–1.047) | < 0.001 |
| Hemoglobin before TAVI† | 0.759 (0.669–0.861) | < 0.001 | 0.750 (0.650–0.867) | < 0.001 |
| Hemoglobin after TAVI† | 0.826 (0.722–0.945) | 0.005 | 0.818 (0.701–0.956) | 0.011 |
| Platelets before TAVI† | 1.007 (0.977–1.040) | 0.643 | 1.007 (0.972–1.044) | 0.699 |
| Platelets after TAVI† | 1.003 (0.961–1.045) | 0.902 | 0.984 (0.935–1.036) | 0.543 |
| Troponin after TAVI‡ | 1.000 (0.995–1.006) | 0.874 | 1.001 (0.996–1.007) | 0.564 |
| Agatston score‡ | 1.000 (0.978–1.022) | 0.980 | 1.002 (0.971–1.026) | 0.901 |
| STS score | 1.047 (1.022–1.073) | < 0.001 | 1.047 (1.020–1.075) | < 0.001 |
| Mean aortic valve gradient before TAVI | 1.001 (0.986–1.017) | 0.901 | 1.002 (0.984–1.020) | 0.843 |
| Mean aortic valve gradient after TAVI | 1.012 (0.967–1.060) | 0.600 | 0.999 (0.946–1.055) | 0.967 |
| Aortic valve area before TAVI | 1.523 (0.492–4.172) | 0.466 | 1.085 (0.297–3.973) | 0.901 |
| Left ventricle ejection fraction | 0.991 (0.976–1.006) | 0.222 | 0.991 (0.974–1.008) | 0.297 |
| Septal wall thickness | 1.091 (0.989–1.204) | 0.081 | 1.115 (1.000–1.244) | 0.050 |
| Inferior wall thickness | 1.185 (1.047–1.342) | 0.007 | 1.253 (1.088–1.442) | 0.002 |
We also studied the association between all-cause and cardiovascular mortality and continuous variables. We observed a significant association between all-cause mortality and increased age, lower BMI, higher creatinine levels before and after TAVI, lower hemoglobin level before and after TAVI, higher STS score and higher wall thickness (Table IV). Similar results were also seen for cardiovascular mortality with the exception of BMI (Table IV). P-values were < 0.050 for all above - mentioned variables.
Multivariate analysis, using variables identified as significantly associated with mortality in univariate analysis (Table IV), revealed that lower BMI, lower hemoglobin before TAVI, higher STS score, higher inferior wall thickness, higher creatinine after TAVI, and atrial fibrillation were independently associated with mortality risk. Similar results were also seen for cardiovascular mortality, with addition of NYHA ≥ III. P-values were < 0.050 for all above-mentioned variables. Addition of educational level into this model that controls all studied characteristics shows no significant effect on all-cause or cardiovascular mortality (p = 0.462 and p = 0.716).
Discussion
To the best of our knowledge, this is the first study evaluating the association between educational level and outcomes in patients with aortic stenosis who underwent TAVI. Here, we report essential findings: (I) patients with a lower educational level were more often females, required a TAVI procedure at a younger age, and had higher BMI, a higher prevalence of type 2 diabetes mellitus, and concomitant aortic regurgitation; (II) all urgent TAVI procedures were performed in patients with a lower educational level; (III) early safety and device success were comparable in both groups; (IV) there were no significant differences between patients in the low and high level of education groups in all-cause and cardiovascular mortality after TAVI during mid-term follow-up.
Education and risk factors
Even though SES is a multidimensional construct related to both adequate financial resources and educational attainment, education is the most widely used measure of SES in epidemiology studies [19]. In our study we considered only educational attainment as it represents a parameter with less variability throughout a person’s life and has a proven association with the outcomes from previously published studies. Lower levels of education are associated with a higher prevalence of CV risk factors, higher incidence of CV events, and higher CV mortality, independent of other sociodemographic factors [1, 4].
Risk factors for development of AS are similar to those for atherosclerosis [12]. Yan et al. [20] reported that arterial hypertension, diabetes mellitus, and dyslipidemia have independent associations with the incidence of AS in an unselected population of individuals older than 65 years and together accounted for approximately one-third of the incidence of severe AS. A positive dose-response relationship between the number and duration of cardiac risk factors and risk of AS has been observed [20]. Genetically increased body mass index was causally associated with higher risk of aortic valve stenosis and replacement [21].
The above-mentioned findings are consistent with the results of our study. Patients with an LLE, although younger, had significantly higher BMI and a higher prevalence of type 2 diabetes mellitus (Table I). These findings could explain the earlier occurrence of AS in the LLE group observed in this study.
The results of our study showed there was no significant difference between the groups in terms of prevalence of arterial hypertension, atrial fibrillation, or CAD. Comparing our findings to previously published studies that included the general population as well as patients with the first clinical manifestation of CAD, the overall prevalence of arterial hypertension, atrial fibrillation, and CAD was higher in our study [4, 22]. We hypothesize that these findings might be explained by the higher mean age of patients in our study.
Education and awareness
Some recent studies have explained that lower educational level might directly impair an individual’s ability to obtain effective care in several ways, including low awareness of the importance of seeking timely care or reduced access to information on how and where to obtain it [4]. Despite the prognostic significance of severe AS, awareness and concern is very limited in the general population. Research shows that people are most concerned about non-cardiac diseases such as cancer or neurological entities (and among heart conditions, the concern is 5 times higher with heart attack). This is despite the fact that mortality of untreated AS is considerably higher than that of most malignancies [23]. We assumed that once patients are well aware of their condition they will actively participate in their healthcare and therefore optimal timing of TAVI can be planned. In this study, patients in the LLE group were more often admitted in a severe condition requiring urgent procedures (Table I), whereas patients in the HLE group were all admitted for diagnostic hospitalization, indicated by an outpatient specialist, who made a diagnosis through screening or at annual visits.
Socioeconomic status and outcomes of TAVI
The interaction between outcomes following TAVI and SES has not been studied in detail thus far. Mohee et al. [24] studied the association of low SES with outcomes following TAVI in 387 patients. In contrast to our study, they evaluated SES mainly by income and concluded that social deprivation was not associated with adverse outcomes. In the present study, during 2 years of follow-up, mortality was not affected by education compared with BMI, creatinine, hemoglobin, STS score, wall thickness and atrial fibrillation, which were identified as independent prognostic factors. Our study suggests that TAVI had a positive effect in attenuating worse baseline clinical conditions.
Limitations
This study has several limitations. First, the retrospective, observational, single-center design has its own inherent limitations that should be considered before generalization of the results. A second limitation is the unequal gender representation between groups. This reflects the historical situation in the Czech Republic and unequal availability of education in the past favoring men [25].
We found a significant difference between implanted valves in HLE and LLE groups (Table III). We believe this is an accidental finding, because valve choice was based on patient’s anatomy and the availability of the valve. Currently, we are not aware of any evidence that would suggest that valve type affects mortality.
It is not known how many patients with severe AS were sent for surgery or were discouraged from TAVI, and therefore we cannot evaluate our selection bias. Although we had patients referred from different locations and almost all districts of the country, our cohort is rather small and can potentially give biased results. On the other hand, data on outcomes after TAVI based on SES or education are rather scarce [24], and therefore we believe that our current data carry considerable weight.
Conclusions
Patients with lower educational level and severe AS were indicated for TAVI at a younger age, had more comorbidities and had a more risky profile compared with patients with a higher educational level. After TAVI, there were no significant differences in all-cause and cardiovascular mortality during mid-term follow-up.


