
Introduction
Melanoma is a malignant neoplasm with a poor prognosis. Its incidence increased in recent years by around 3% annually, especially in light-skinned populations, apparently due to increased exposure to ultraviolet radiation [1, 2]. In Mexico, an incidence of 1.01 per 100,000 inhabitants is estimated [3]. There are clinicopathological prognostic factors with great predictive power for the prognosis of these patients. Within these parameters, there are few studies, with contradictory results, that have analysed the prognostic role of obesity with the prognosis of patients [4–6].
Obesity is a health problem because it is the main risk factor for the development of type-2 diabetes, cardiovascular disease, high blood pressure, dyslipidaemia, osteoarticular diseases, and cancer (like breast and prostate); all the aforementioned diseases are the main causes of mobility and mortality in the population, and obesity is considered the most preventable cause of cancer [7, 8].
In melanoma, several works have detected an association between the presence of obesity and the risk of developing melanoma [9]; however, the evidence that analyses the impact of obesity at the time of diagnosis with the prognosis of Melanoma is scarce and controversial because the only published study demonstrated improved survival in women with overweight/obesity versus normal weight; however, this study was based on Caucasian populations in whom thin melanomas and sun exposure melanomas predominate [6].
Mexico has a particular situation. According to national self-reports and surveys, 65–72% of adult patients are overweight or obese [10, 11]. On the other hand, the melanomas in our population differ from the melanomas that appear in the Caucasian population because there is a clear predominance of acral subtypes [12].
Our objective was to determine if there is an association between overweight/obesity and the 5-year overall survival (OS) of melanoma patients in a population with a predominance of the acral subtype. Our working hypothesis is that overweight and obesity at the time of diagnosis are associated with a shorter OS rate due to melanoma.
Material and methods
This study was approved by the ethics committee of our institution with an exemption from informed consent due to its retrospective nature (Research and Ethics Institution Board No. REV/18/523). A cross-sectional study of patients collected consecutively from 2005 to 2015 with a diagnosis of melanoma, who were diagnosed and treated in our institution and who had clinical follow-up was carried out. Cases in whom there was no histopathological diagnosis were excluded.
The ideal sample size was calculated based on the log-rank test, to establish a difference in survival of 20%, based on the known global survival at 5 years (70%) to test the hypothesis of equal rates. The sample size was 379 individuals (calculated two-tailed, with a confidence level of 95% and a power of 80% with the procedure described in the literature) [13]. We identified 707 melanoma patients who met the inclusion criteria, so we decided to use the entire sample.
The following variables were collected from the files: age, sex, clinical stage, sentinel node status, tumour location, clinicopathological subtype, Breslow depth, ulceration, mitosis, surgical margin, tumour size, body mass index (BMI), neutrophil-lymphocyte ratio (NLR), adjuvant therapy, outcome, and follow-up time.
The BMI was calculated at the time of the diagnosis and based on the height and weight measured in their first visit to our centre. Once the BMI was determined, the sample was divided into groups according to the WHO cut-off points to contrast the clinically pathological variables between the groups. At the last follow-up visit of the patient, the BMI was also recorded to compare the initial and final BMI. The Kolmogorov-Smirnov test was performed to determine the normality of the numerical data. The numerical variables were summarized with mean and standard deviation or with median and interquartile range (IQR), according to their normality, and were compared with the ANOVA test or the Kruskal-Wallis test. For categorical variables, count and percentages were used as summary measures, and the variables were compared with the χ2 test. For comparison of the BMI at the time of the treatment and the BMI at the last visit or death, the Wilcoxon signed-rank test was performed. Univariate survival analysis was carried out using the Kaplan-Meier and log-rank tests. Multivariable analysis was carried out using Cox’s proportional hazards regression analysis after the verification of proportional hazards assumption and hazard ratio (HR) with 95% CI were obtained to determine the prognostic effect of each index considering in the model the statistically significant variants in the univariate analysis. SPSS version 22.0 (IBM) software was used for all statistical analyses, and a 2-tailed p-value < 0.05 was considered statistically significant for all tests.
Results
Of the 707 patients, 432 (61.1%) were women and 275 were men. The mean age at diagnosis was 57 ± 15.7 years (range 18 to 91 years). Regarding melanoma-related factors, the subtypes were acral melanoma in 392 (55.4%) patients, nodular in 155 (21.9%), superficial spreading in 100 (14.1%), and lentigo malignant in 60 (8.5%) cases. The clinical stage at presentation was stage I in 196 (27.7) cases, stage II in 233 (33%) cases, stage III in 255 cases (36.1%), and stage IV in 23 (3.3%) cases. The median diameter of the primary lesion was 20 mm (IQR 12–35 mm), the median Breslow was 3 mm (IQR 1.14–7 mm), and the median mitotic count per square millimetre was 0 (IQR 0–2 mitosis/mm2).
Regarding BMI, the median BMI was 26.63 kg/m2 corporal surface (IQR 23.85–29.73 kg/m2), the basal neutrophil/lymphocyte ratio had a median of 2 (IQR 1.53–2.6), and the median follow-up was 78 months (IQR 16–85.5 months). Data grouped by BMI are summarized in Table 1, which highlights that age is minor in patients with overweight/obesity, nodular melanomas are most common in the overweight/obesity group, and lentigo maligna are most common in patients with normal weight. In all the other variables the groups are similar. The median BMI change in the patients did not differ with time (median of change 2.21, 95% CI: 0.89–3.21, p = 0.652).
Table 1
Clinicopathological features of 707 patients with melanoma according to body mass index
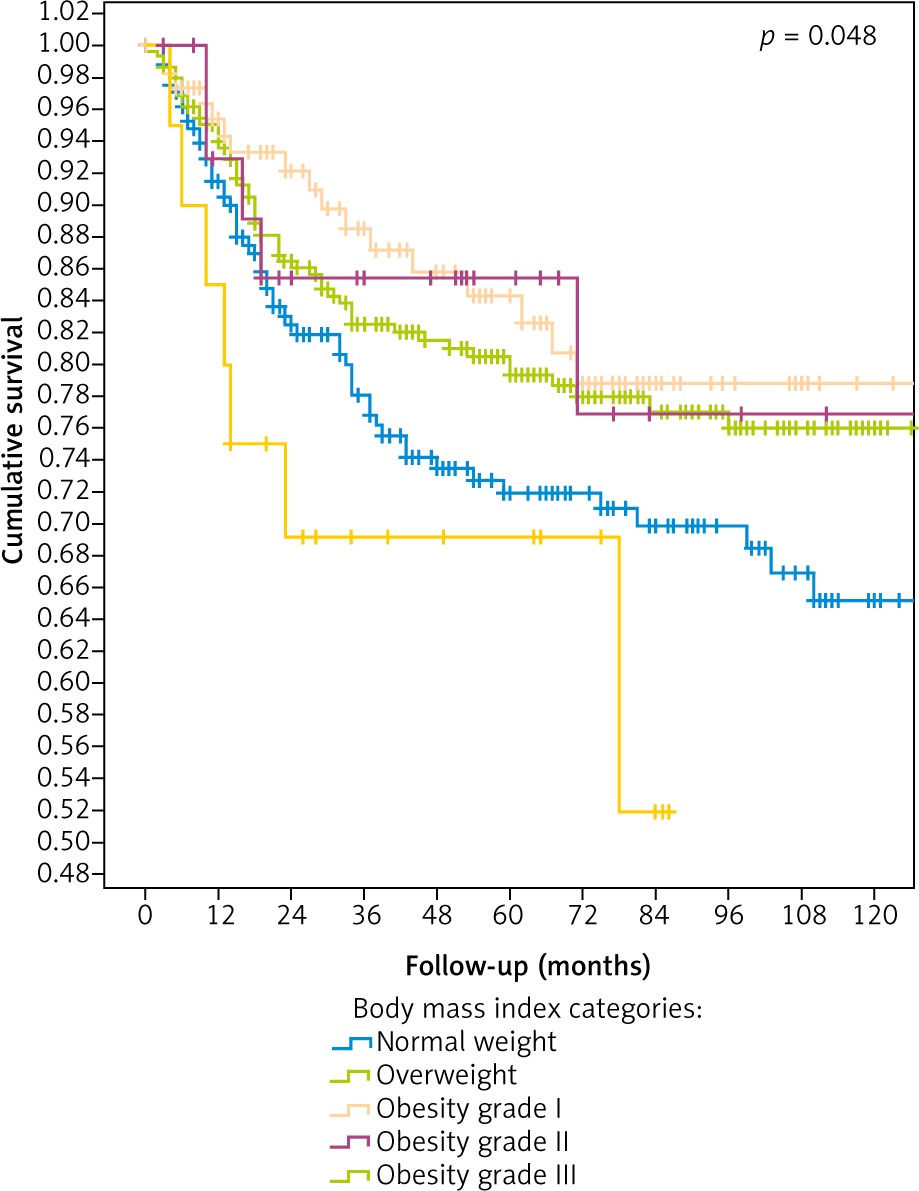
The median follow-up time was 78 months. In the survival analysis (Table 2), the variables associated with decreased survival were the acral subtype, advanced clinical stages (stages III and IV), a high neutrophil/lymphocyte ratio, presence of mitosis, vertical growth phase, ulceration, positives surgical margins, and normal weight. However, in multivariate analysis (Table 3) the factors that remained independently associated with decreased survival were a positive surgical margin (HR 3.475, 95% CI: 1.829–6.600), clinical stage (HR 2.565, 95% CI: 2.020–3.257, per switch to the upper stage), ulceration (HR 3.475, 95% CI: 1.829–6.600), and BMI (Fig. 1). We repeated all the analyses stratifying by sex and found similar results.
Table 2
Characteristics associated with 5-year overall survival of 707 patients with melanoma
Table 3
Multivariate analysis of factors associated with survival from 707 patients with melanoma
Discussion
In this study of 707 Mexican patients with melanoma we identified that all the classical poor prognostic factors in melanoma were associated with decreased overall survival, but, interestingly, BMI > 25 kg/m2 was associated with improved survival.
Obesity is a known risk factor for the development of various cancers, but the relationship between obesity and survival in different malignancies seems more complex and may depend on the type of tumour, the clinical stage, the treatment, and even the sex of the patient. Several observational studies in different types of tumours have shown that a moderately increased BMI compared to an optimal BMI is associated with better results, both at the time of treatment and in subsequent years of follow-up [14]. However, this protective effect is almost universally reversed as the BMI increases to the level of morbid obesity, an effect known as the obesity paradox. Many possible explanations have been cited to explain this effect, some of which relate to observational biases and the poor performance of BMI as an accurate representation of obesity, while other suggestions support an underlying biological mechanism in moderately obese patients undergoing cancer treatment, which could explain the observed beneficial effect.
Recently, a study showed that obesity (BMI > 30 kg/m2) was associated with better progression-free survival and longer OS in male patients with metastatic melanoma treated with targeted and immune therapies, but this effect was not seen in women [6]. However, this study has received criticism for the imbalance in prognostic factors (baseline characteristics at the methodological level) in the BMI groups; for example, the study data suggest that patients with normal BMI had less favourable clinical and tumour markers. At the start of the study that obese patients, in addition to possible biases in the statistical subanalysis [15]. Also, it is warned that the BMI should be examined over time in these patients, because a patient during the clinical course of their disease may have migration in the BMI categories, so theoretically we can think that the patients with the worst prognosis lose weight and they migrate to normal weight, and this would explain the differences. Another criticism is that BMI is an imperfect substitute for body composition, incapable of differentiating muscle mass from adipose tissue, a proportion that varies according to sex and could explain some interactions between sex and BMI from the McQuade study [16]. The presence of greater musculature could be a reasonable explanation of why a patient with a higher BMI would have better oncological results; some authors even point to data in colorectal carcinoma that support this hypothesis [17]. However, debating this last perception, there is no published study that shows that the BMI is modified by the musculature; moreover, this is a theoretical assumption based on empirical data of people (real or hypothetical) who have good musculature, such as athletes or bodybuilders, and who are not representative of the population. Even granting this point, what proportion of patients with this musculature do we treat on a daily basis? What proportion of patients whose BMI may be high due to large musculature has cancer? Considering this, are they representative of the population? Although the BMI is not a perfect parameter that evaluates adiposity, it is the most practical and reproducible, and is the parameter that has led us to make decisions about the health of patients and populations. For this reason, we do not believe that it is the explanation for the best prognosis in patients with obesity in our study.
A hypothesis that we think may influence in some way the prognosis of patients with melanoma and obesity is the inflammatory or imbalance status of these patients. Inflammatory cells in adipose tissue, especially macrophages, create an environment that recruits inflammatory cells such as lymphocytes that, along with adipocytes, secrete more than 50 different cytokines, hormones, and chemokines, all of which contribute to the chronic inflammation associated with obesity [18] and could somehow regulate the inflammatory microenvironment in melanoma, favouring a better prognosis. Although most of the evidence indicates that this is a risk factor for carcinogenesis, in a patient with a settled melanoma, a tumour in a closer relationship with subcutaneous adipose tissue, this could be different.
A limitation of our study is that the BMI cut-off points are applicable only to the Caucasian race because the others present a different corporate composition, which implies making an adjustment in the classifications, so for an equal BMI value we find a different amount of fat. It is necessary to emphasize the importance of this indicator; it should be taken as a guideline, and its use is applicable to population studies rather than individuals.
Conclusions
In this study we found that melanoma patients who had a BMI between 25 and 54.9 kg/m2 had better survival. In addition, we demonstrated that there is no significant change in BMI during their clinical course, so the mechanism to explain this paradox remains unknown, but we postulate that the inflammatory microenvironment in the adipose tissue of patients with obesity may be the key.


