
Summary
The aim of this study was to determine the natural history of high-risk coronary plaques. Eigthy-nine patients with suspected coronary artery disease (CAD) underwent two computed tomography angiography examinations within an interval of at least 24 months. High-risk plaque was defined by the presence of a low-attenuation area adjacent to the coronary lumen, surrounded by a ring of higher attenuation – napkin-ring sign (NRS). At the baseline 53 NRS were observed in 22 (25%) patients, 7 (8%) patients had single NRS and 15 (17%) had multiple NRS. After the follow-up period, there were 68 NRS in 32 patients. In 18 patients progression was observed with 23 additional NRS. Presence of single NRS and diabetes were independent predictors of NRS progression. The number of NRS plaque tends to increase over time in patients with suspected CAD. The progression may be predicted by the presence of diabetes or single NRS.
Introduction
In 50% of cases acute coronary syndrome (ACS) or sudden cardiac death is the first manifestation of coronary artery disease (CAD), owing to limitations of current primary prevention strategies based on evaluation of traditional risk factors [1–3]. In the development of ACS, both systemic and local biological processes are involved, and there is a debate over which of them constitutes a more effective therapeutic target [4, 5]. One of the critical substrates for ACS is the vulnerable coronary atherosclerotic plaque [6–8]. However, despite its significance, the prevalence and the incidence of vulnerable plaques, as well as their natural history, remain poorly known. This is due to the fact that in vivo identification and monitoring of the evolution of vulnerable plaques over time is extremely challenging, and is hazardous when based on invasive methods such as intravascular ultrasound (IVUS) or optical coherence tomography (OCT).
Recent developments in coronary computed tomography angiography (CTA) allow the identification of a rupture-prone plaque – lipid-rich fibroatheroma, associated with future adverse clinical outcomes [6, 8, 9]. The presence of so-called “napkin-ring sign” (NRS) on coronary CTA allows non-invasive diagnosis of advanced, lipid rich atheroma, which is highly specific, though less sensitive than the reference histopathological examination [9]. The overall level of the diagnostic accuracy of CTA in this respect can be compared to invasive methods, such as intravascular ultrasound (IVUS-VH) or OCT [10, 11]. The advantages of the non-invasive study, including not only greater safety but also imaging of all coronary arteries in a single scan, make it suitable for studying the natural history of vulnerable plaques.
Aim
The purpose of our study was to evaluate the prevalence, incidence and evolution of NRS, and to establish factors associated with their presence, progression, or regression, in patients with suspected CAD. Better understanding of these phenomena may spark novel diagnostic and therapeutic strategies, leading to improved patient outcomes.
Material and methods
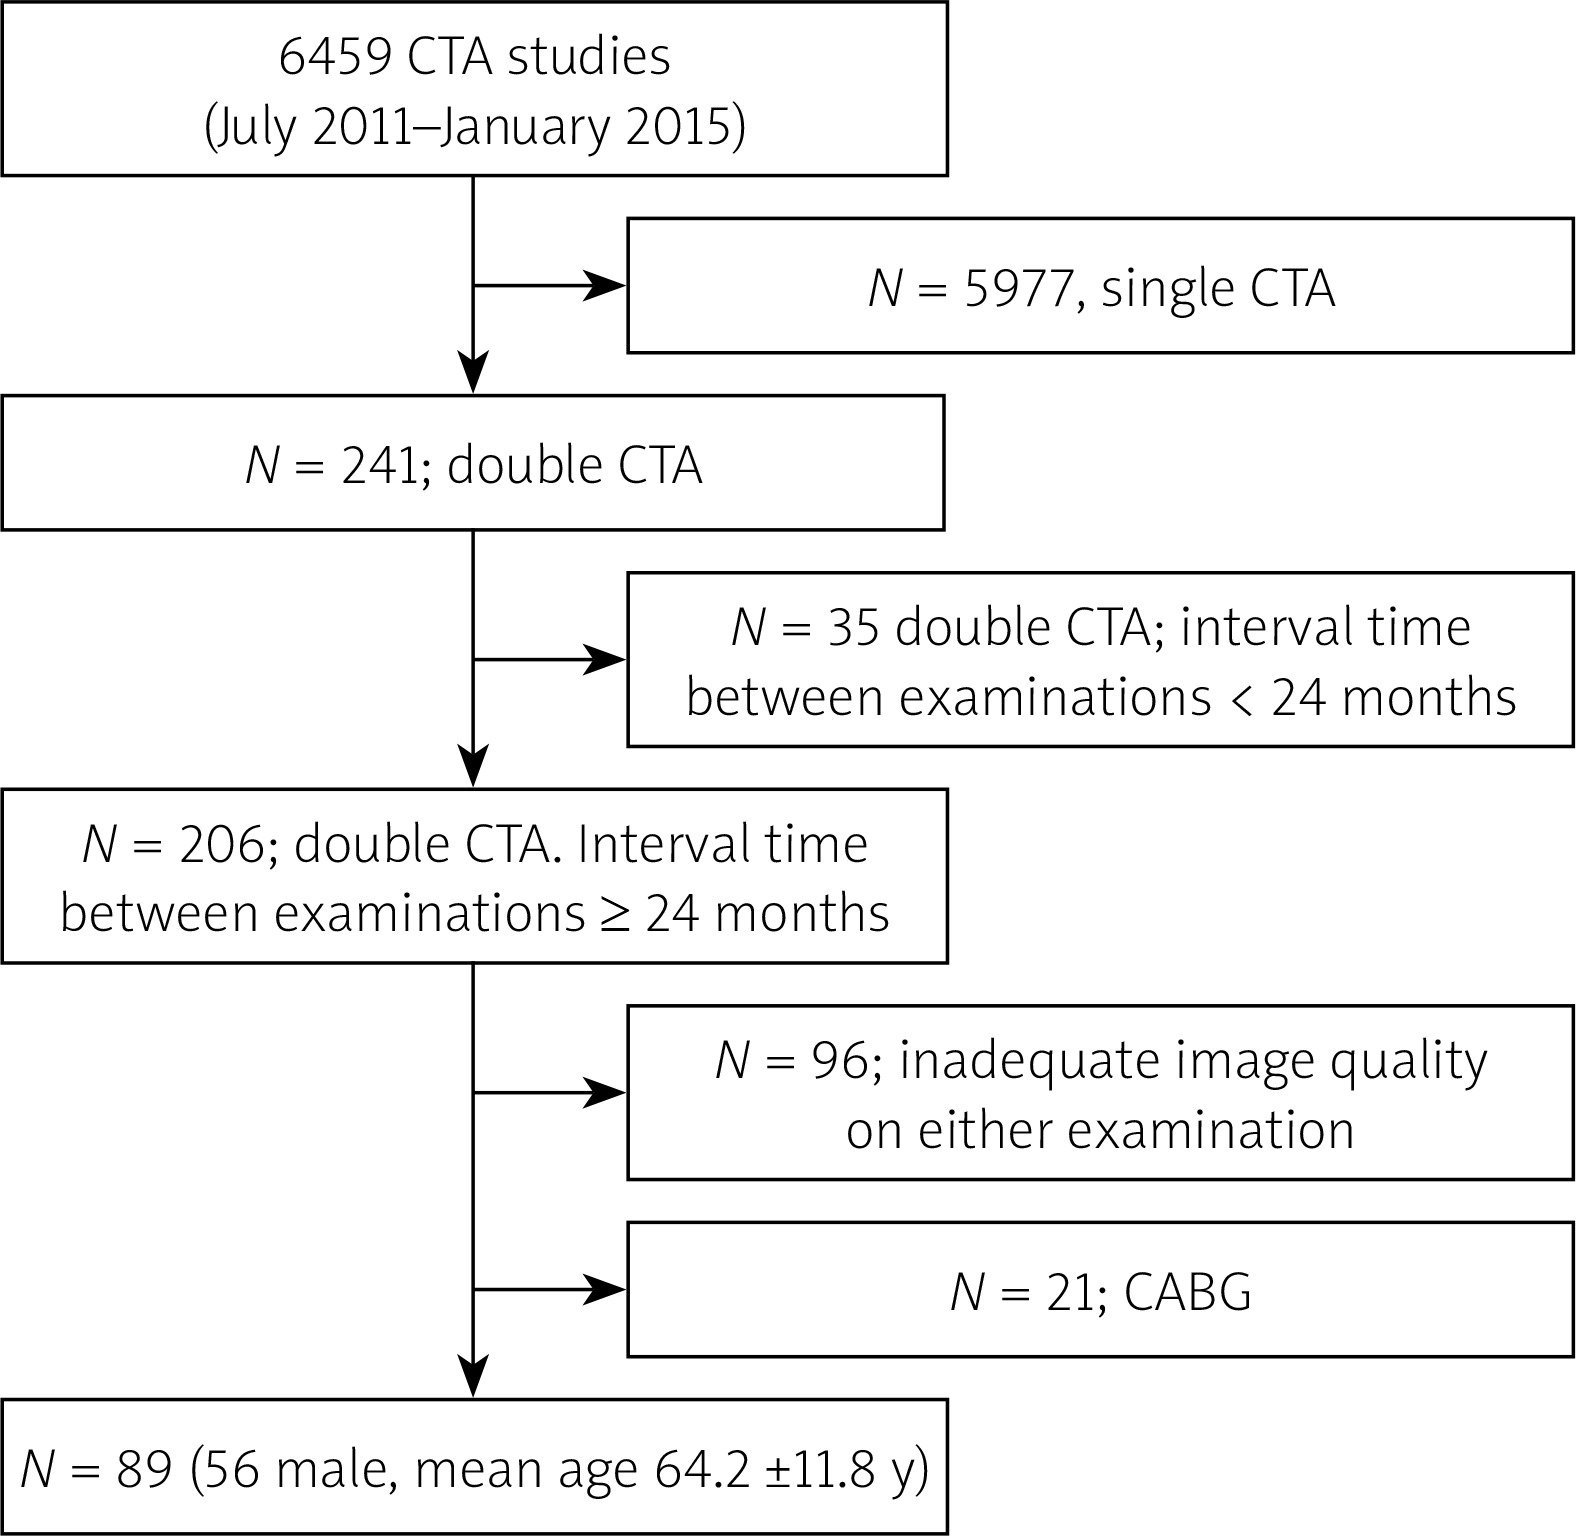
The study is based on a single-center prospective registry. Between July 2011 and January 2015, we performed 6459 coronary CTA studies at the Institute of Cardiology in patients with intermediate probability of significant coronary stenosis. Of these, we ultimately included 89 patients (56 male, mean age: 64.2 ±11.8 years) who had two good quality CTAs performed within an interval of at least 24 months and no intervening coronary artery bypass grafting (CABG). We did not exclude patients who underwent stenting following the first CTA. Segments which were stented between the two CTAs were treated as no progression/no regression segments. The detailed selection process is presented in Figure 1. Coronary CTA studies were performed with a dual source 2 × 128-slice CT scanner (Somatom Definition FLASH, Siemens Medical Solutions, Forchheim, Germany) with 280 ms gantry rotation time. In all patients, sublingual nitrates (0.8 mg) were administered prior to the scan, and in the case of heart rate ≥ 70 beats/min, intravenous metoprolol (up to 20 mg) was given. A 60- to 80-ml bolus of iomeprol (Iomeron 400, Bracco, Italy) was injected intravenously at 6.0 ml/s. A retrospective, ECG-gated acquisition was used, with 128 × 0.6-mm collimation, and 80 to 120 kV tube voltage adjusted manually depending on the patients’ body mass. Coronary arteries were reconstructed in mid-diastole (60% to 70% of R-R interval) and systole (40% to 50% of R-R interval) with 0.6-mm slice thickness and 0.4-mm increment. Image reconstruction was performed using routinely filtered sinogram-affirmed iterative reconstruction I36f, strength 3.
Figure 1
Study enrollment
CABG – coronary artery bypass grafting, CTA – computed tomography angiography, N – number.
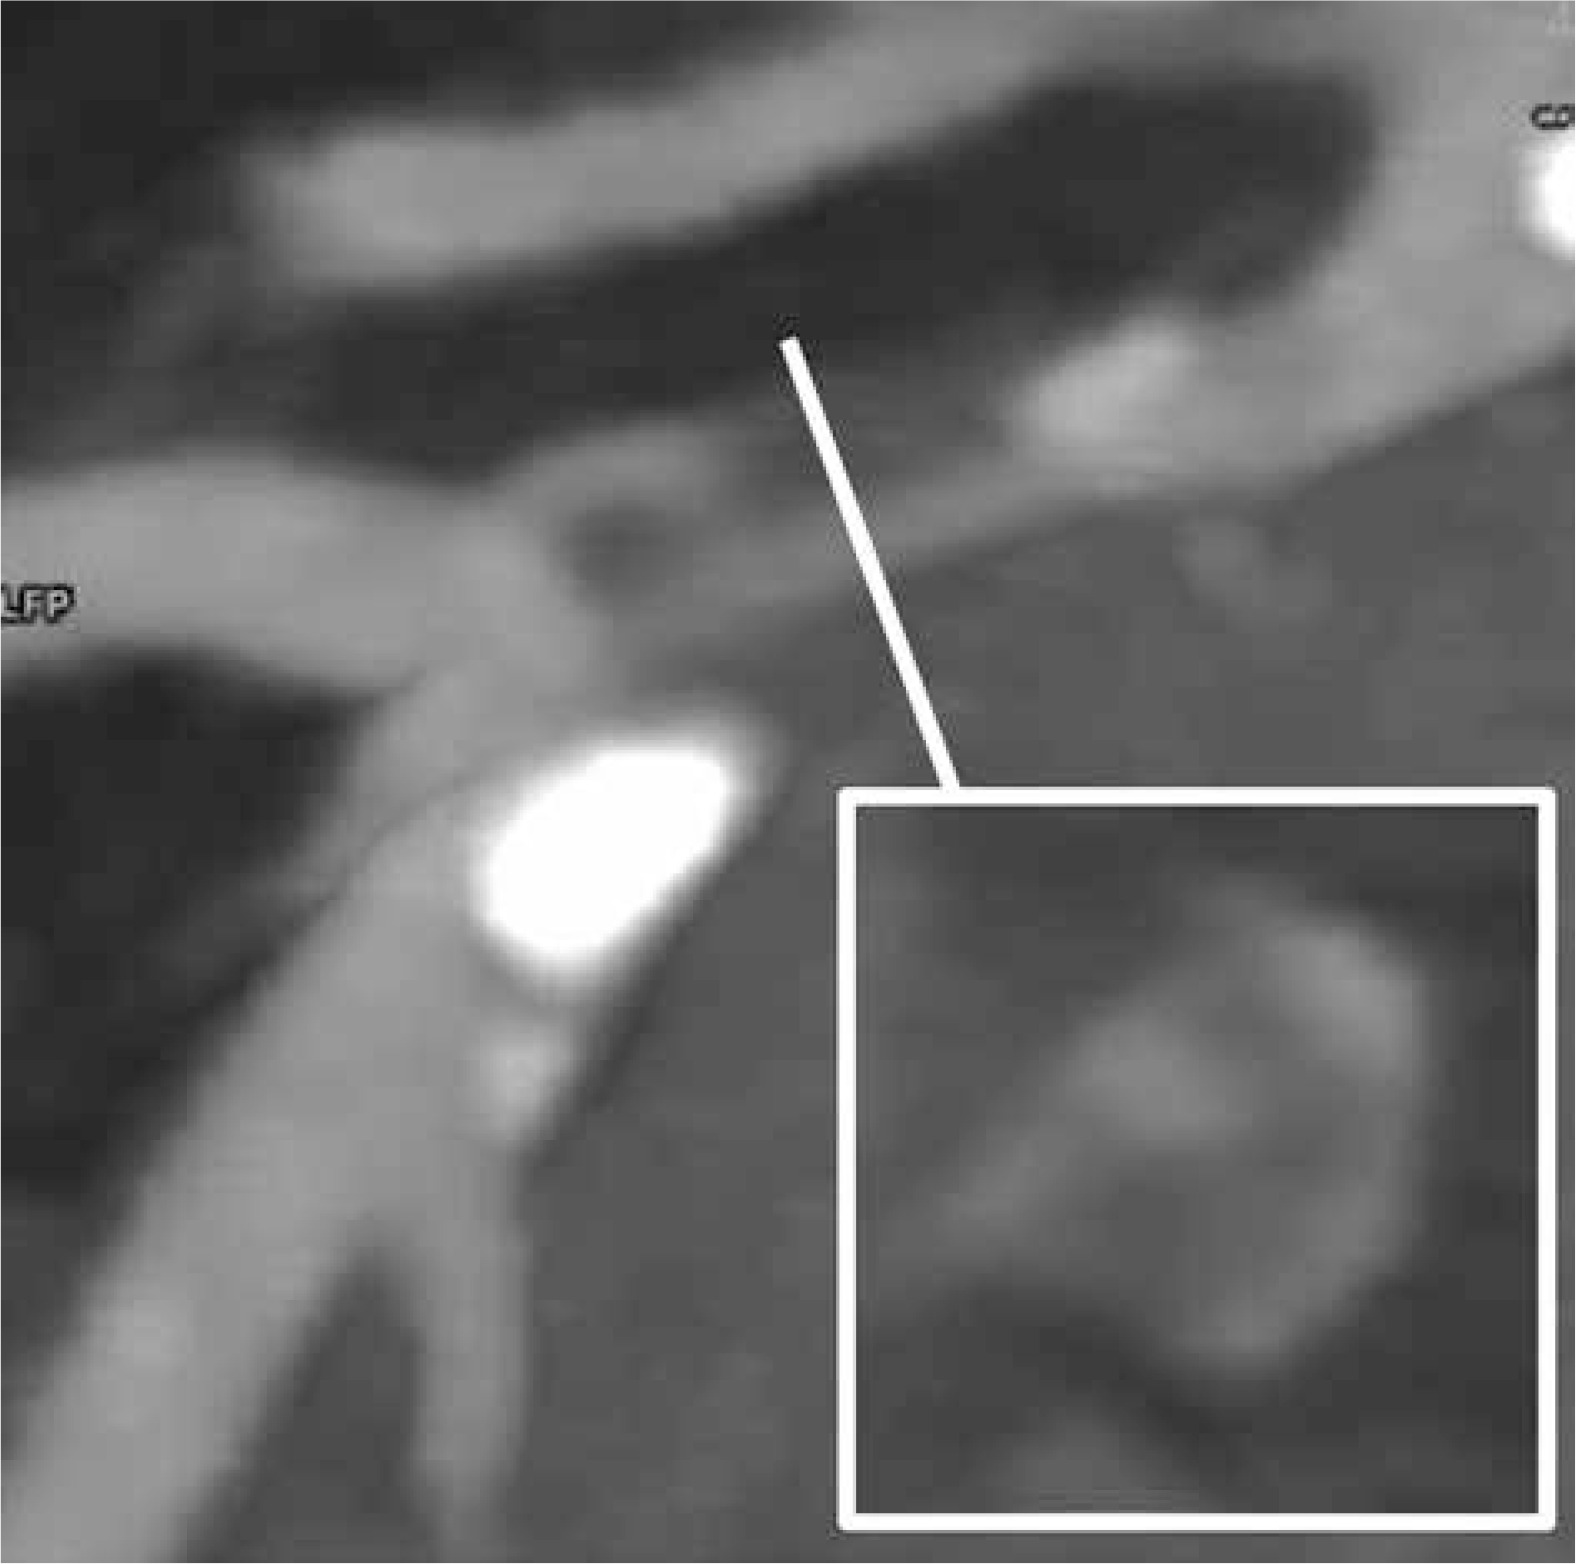
NRS was identified as the presence of a lower attenuation area adjacent to the coronary lumen with an external ring of higher attenuation (Figure 2) [11]. Progression and regression were defined respectively as the net appearance or disappearance of at least one NRS in the follow-up examination as compared to the baseline. Coronary segments were depicted according to ACC/AHA classification, and were further sub-divided into proximal [1, 5, 6, 11] and distal segments [2–4, 7–10, 12–15].
Figure 2
Exemplary figure of napkin-ring sign defined as the presence of a lower attenuation area adjacent to the coronary lumen with the external ring of higher attenuation, in left anterior descending (LAD) artery. The white line indicates the site of LAD cross-section
Significant coronary stenosis was defined as > 50% on CTA. All the baseline and follow-up CTA examinations were reviewed by a single reader unaware of the identity or the sequence of the studies. The sections of arteries with implanted stents were excluded from the analysis. The two cases of NRS identified on the baseline examination, which were subsequently covered with stents due to significant stenosis, were not considered as regression. In 3 patients acute coronary syndromes were recorded within the examinations. Two of these patients had progression in follow-up. However, only one of them had NRS at the baseline. The third ACS was recorded in a patient with no NRS. All of the ACS were NSTEMI.
The baseline clinical data were obtained from medical records.
For the purpose of our analysis, HMG-CoA reductase inhibitor doses were determined on the basis of atorvastatin equivalents with respect to their low-density cholesterol-lowering abilities [12]. The study protocol was approved by the ethics committee of the Institute of Cardiology.
Statistical analysis
Data were expressed as numbers/proportions, mean ± SD or median (interquartile range), as appropriate. Categorical variables were compared using χ2 testing. Between-group comparisons were made using either the independent-samples t test or the Wilcoxon test as appropriate.
Cox proportional hazard analysis was performed to identify predictors of NRS progression/regression on a per-patient basis. Baseline variables that were considered clinically relevant (statin equivalent dose) or showed a univariate relationship with the outcome at p < 0.10 were entered into the multivariable analysis. The Kaplan-Meier survival method was used to compare progression rates according to the existence of independent predictors, using the log-rank test.
Intra-observer variability was determined by repeated analysis of 93 segments by the same observer at > 4 weeks time points, blinded to the previous results. The κ test result was 0.90 (95% CI: 0.79–1.00), showing very good agreement [13].
P-values < 0.05 were considered to be statistically significant. Calculations were performed with MedCalc Version 13.1.2.0 (MedCalc Software, Mariakerke, Belgium).
Results
Prevalence of NRS and baseline clinical characteristics
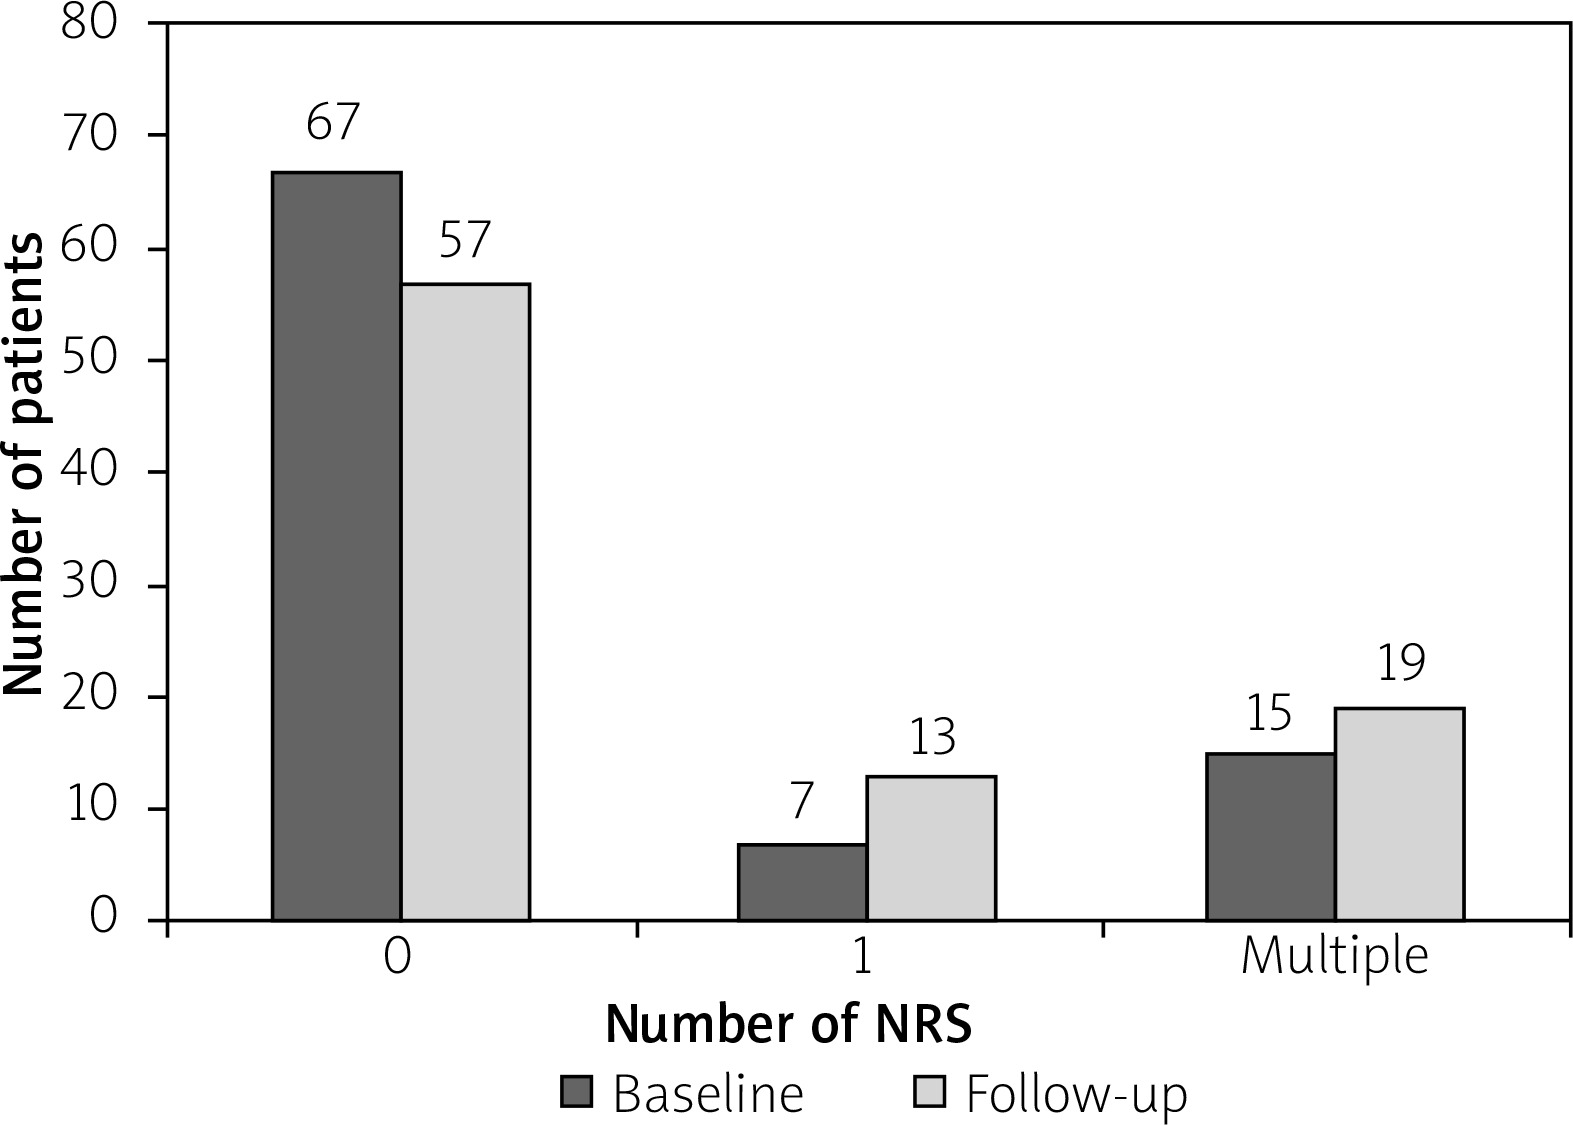
At the baseline, NRS was identified in 22 of 89 patients. Overall, there were 53 NRSs. Most patients (n = 67, 75%) had no NRS, a single NRS was observed in 7 (9%), and multiple NRSs (range: 2–6) in 15 (16.8%) subjects (p = 0.136 for the prevalence of patients with single versus multiple NRS; p < 0.001 for the presence of single versus clustered NRS).
The baseline clinical characteristics of the study patients is presented in Table I. Patients without as compared to those with single and multiple NRS had a lower dose of atorvastatin equivalent between the CTAs, corresponding to less significant CAD, tended to be more often females, less often had a history of ACS, and had higher high-density lipoprotein (HDL) (Table I).
Table I
Baseline patient characteristics
At the baseline, the distribution of NRS across the arteries was uneven, with more than half located within the left anterior descending (LAD), and more NRSs were observed in the proximal as compared to distal coronary segments (total proximal vs. distal: 39 vs. 14, p = 0.001; the right coronary artery: 9 vs. 7, the left anterior descending: 24 vs. 5, and the left circumflex artery: 6 vs. 2).
Incidence
Following the mean of 34 ±9 months of follow-up, there were 68 NRS observed in 32 patients, as compared to 53 NRS in 22 patients at the baseline (p = 0.0736 for increased median number of NRS (Wilcoxon paired samples test), p = 0.037 for increased proportion of patients with NRS (McNemar test)). In 18 (20%) patients progression was observed with 23 additional NRSs, including 10 (11%) patients without prior NRS (significant progression, p < 0.001 for proportion of patients with NRS progression, McNemar test). In 9/22 (41%) patients with baseline NRS no change in the number of NRS was observed, and in 5/22 (23%) patients NRS regression (lower number of NRS) was observed (non-significant regression, p = 0.063 for proportion of patients with NRS regression, McNemar test).
The prevalence of NRS (according to segment distribution) at the baseline and follow-up examinations is presented in Figure 3.
Figure 3
Changes of NRS in proximal and distal segments of coronary arteries on the baseline and follow-up CTA examinations. A – Majority of NRSs tend to localize in proximal segments (p = 0.001) and the number of NRS tends to increase over time (p = 0.074). B – Changes in NRS number in proximal and distal segments of individual coronary arteries. Separate graphs show how many NRSs disappeared and how many new NRSs appeared in the particular segment during follow-up
CX – circumflex, LAD – left anterior descending, LMCA – left main coronary artery, NRS – napkin-ring sign, RCA – right coronary artery.
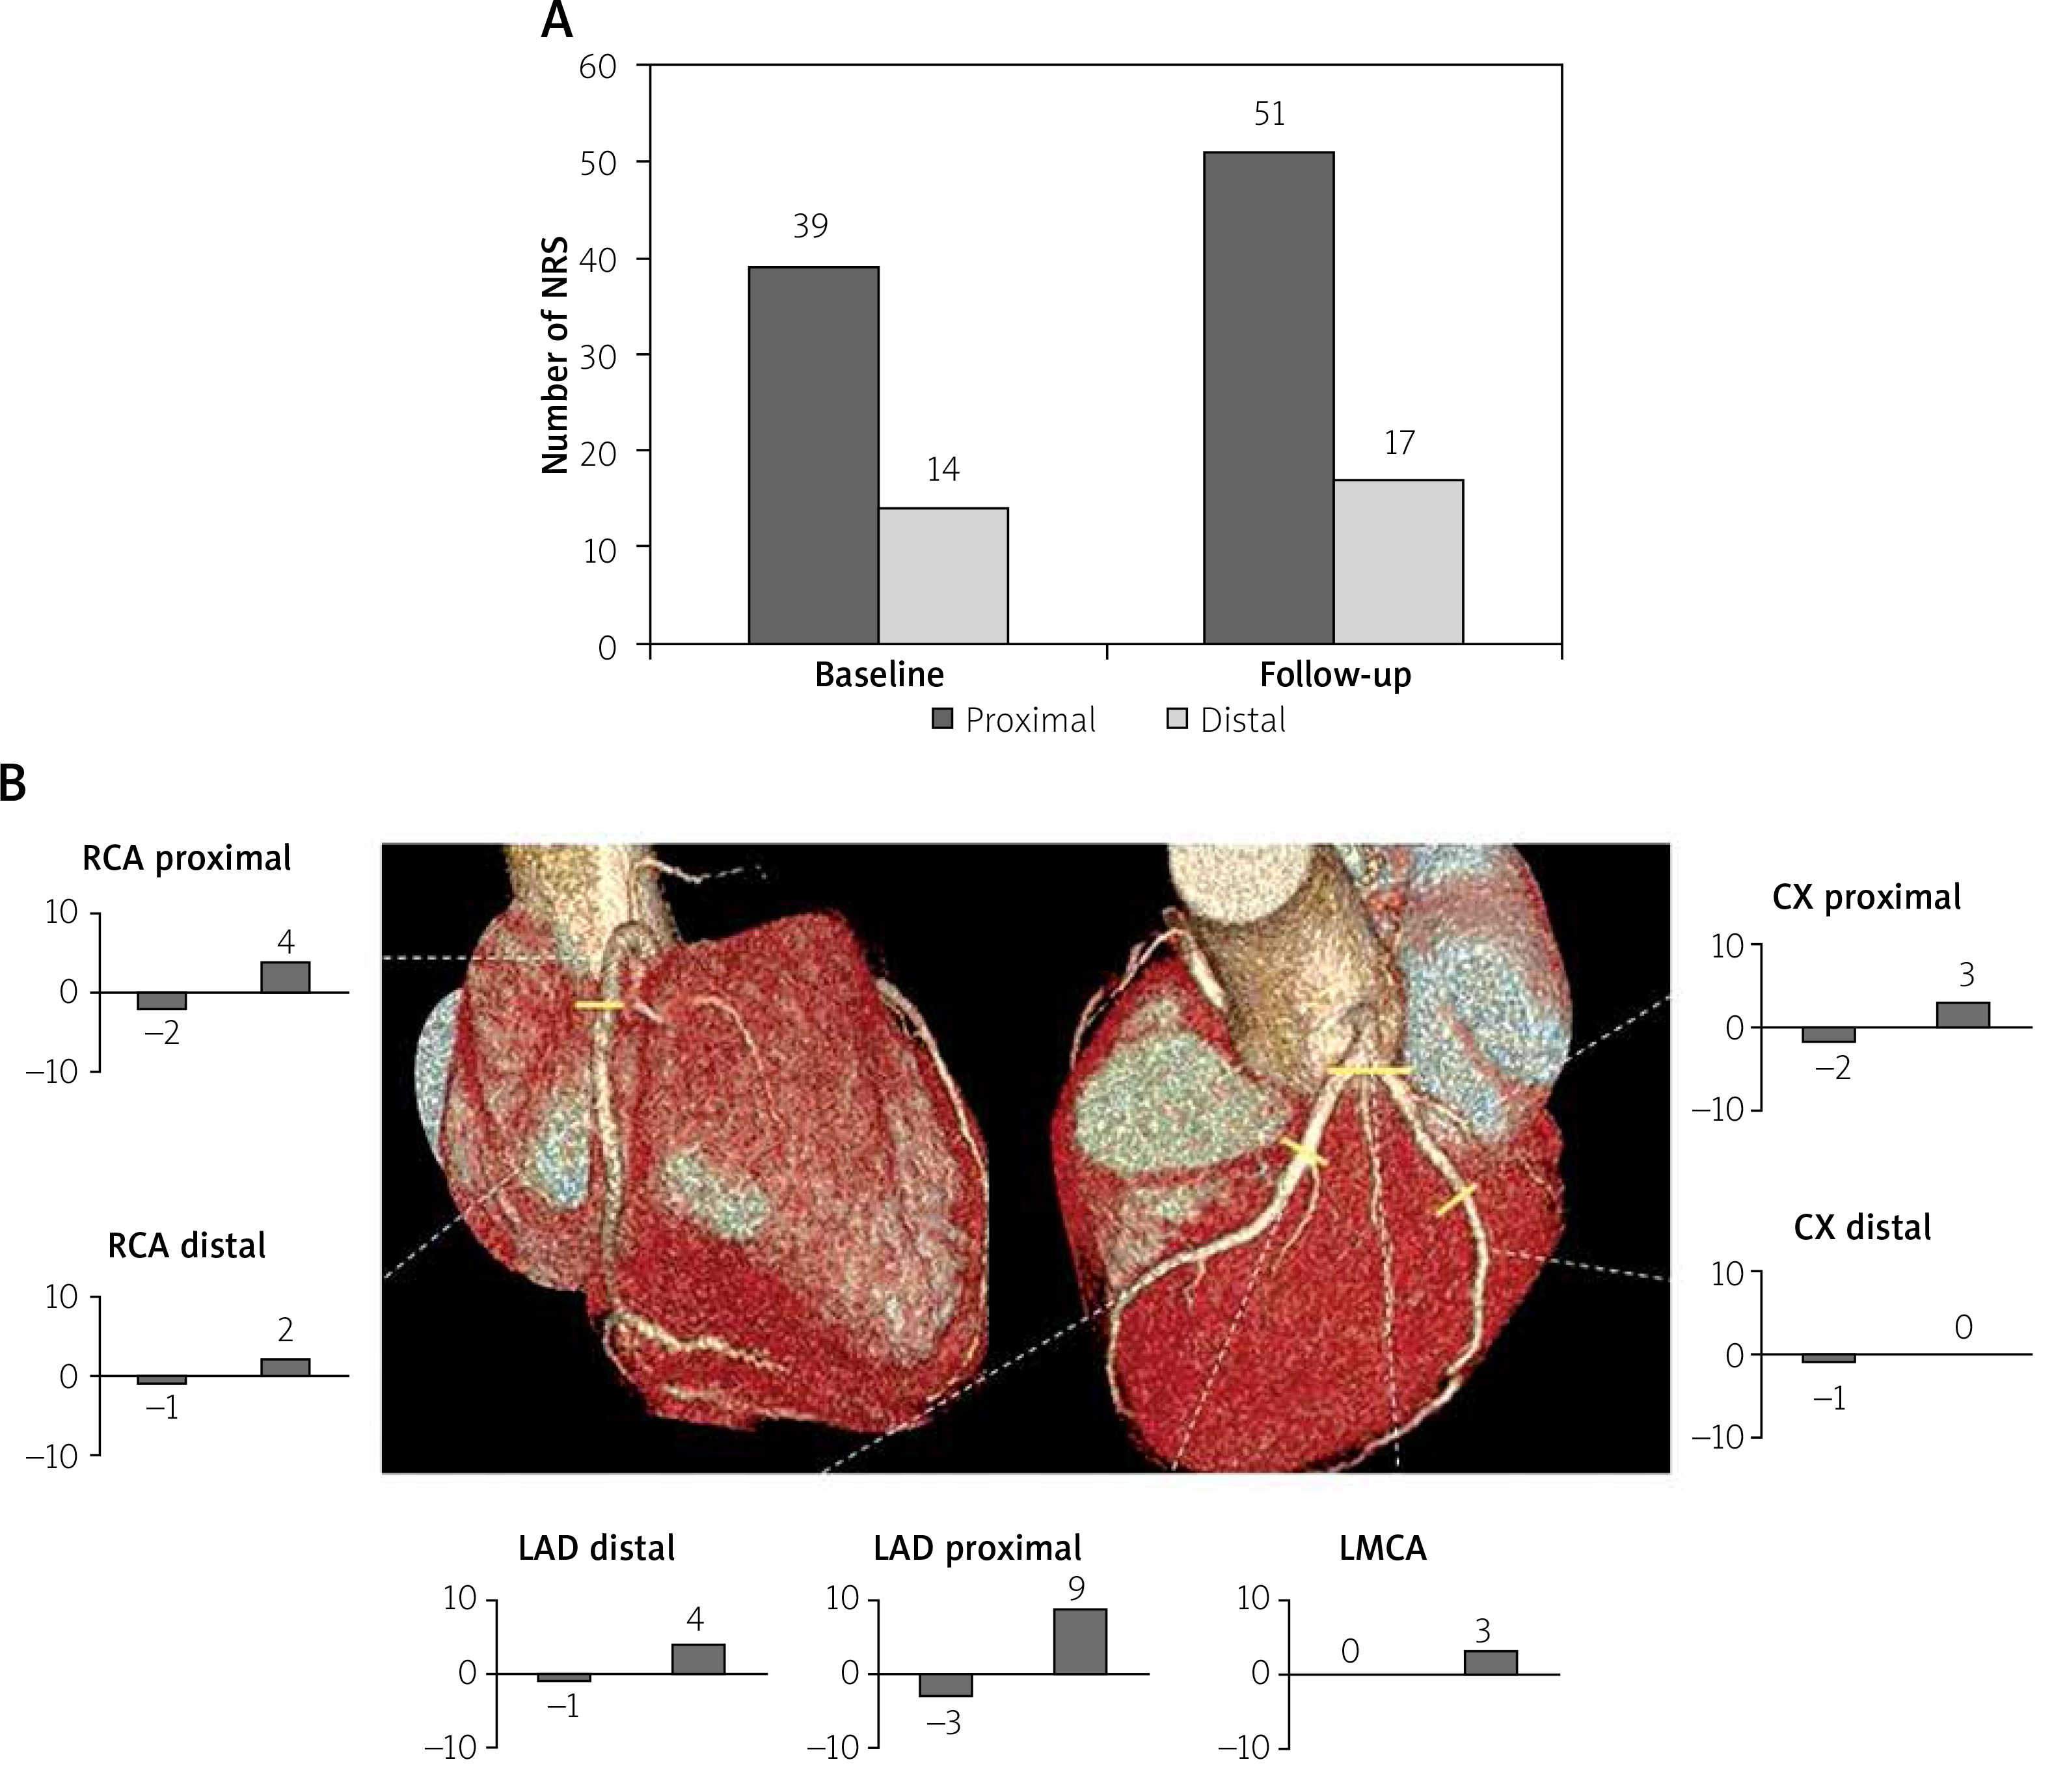
New NRS tended to occur more often within the proximal as compared to the distal segments (respectively 10 (77%) vs. 3 (23%), p = 0.093). New NRS occurred more often in LAD than in RCA or LCx (7 vs. 3 vs. 0, respectively, p = 0.006). The detailed dynamics (appearance/disappearance) of NRS, including analysis of coronary segments, is depicted in Figures 3 and 4.
Factors associated with progression/regression of NRS
Cox regression analysis is presented in Table II. According to multivariable Cox regression analysis (adjusted for: statin treatment between the two CTAs examinations, the number of significant coronary stenoses), only the presence of single NRS and diabetes were independent predictors of NRS progression during follow-up (Table II).
Table II
Cox proportional hazard analysis to identify predictors of occurrence of new napkin-ring sign during follow-up
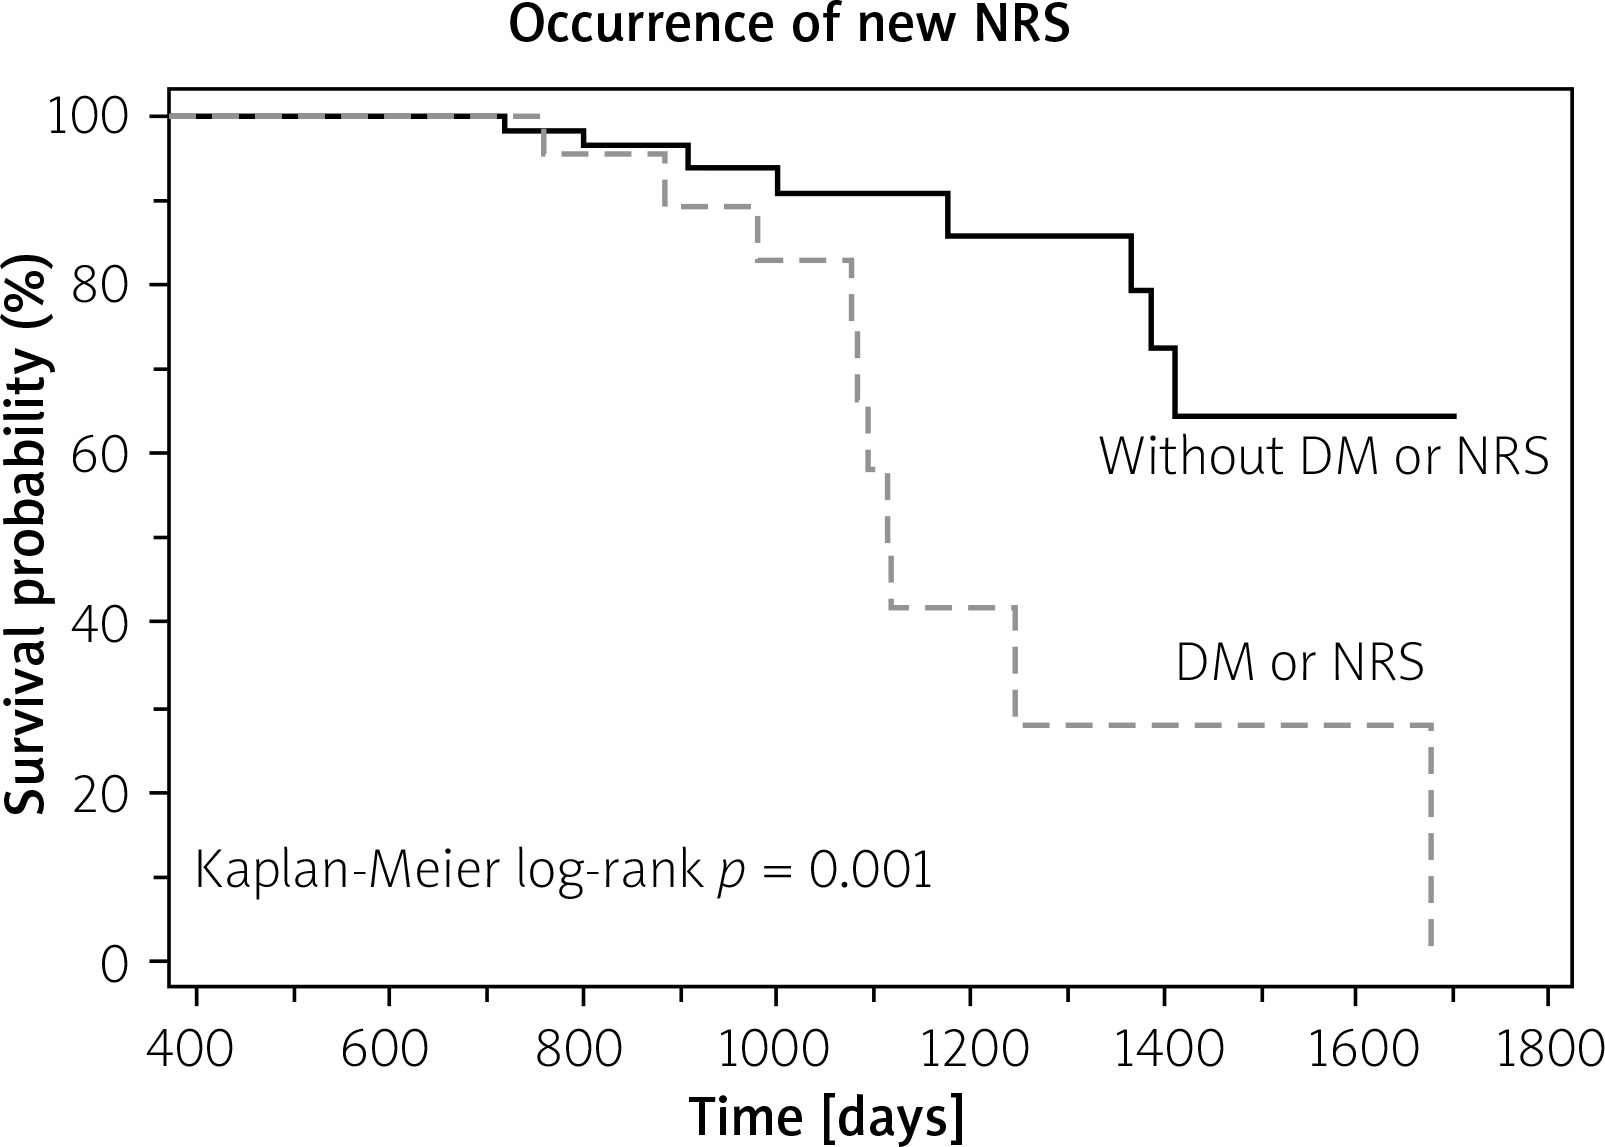
Ten out of 22 patients with either NRS or diabetes had progression as compared to 8 of 67 remaining patients (Kaplan Meier log-rank p = 0.001) (Figure 5).
Figure 5
Ten out of 22 patients with either napkin- ring sign (NRS) or diabetes (DM) had progression as compared to 8 of 67 remaining patients
No clinical variables were correlated with NRS regression.
Discussion
Our data indicate that the number of high-risk-plaques increases over time and that progression can be predicted based on the baseline patient characteristics. Our data also challenge the significance of the specific vulnerable plaques as potential targets for local preventive intervention. Instead, the emerging picture suggests increased systemic vulnerability in some patients, with new vulnerable plaques developing at a distant time and site [4].
NRS is a specific marker of a lipid-rich fibroatheroma, the archetype of vulnerable plaque [6–9, 14]. Our results suggest that NRSs, whenever present, tend to occur in proximal coronary segments and in clusters. Just 7 out of 53 NRSs at the baseline examination and 13 of 68 observed on the follow-up comprised solitary NRS. More NRS seemed to be associated with lower HDL. Importantly, despite relatively intensive antiatherosclerotic therapy in the study patients, the number of patients carrying NRS increased over time. The predictors of occurrence of new NRS included the presence of single NRS and diabetes. To the best of our knowledge, these findings have no precedence in prior literature.
In our cohort, 25% of patients carried NRS, numerically slightly more than in the previous report of Kashiwagi et al., in which the prevalence of NRS was 18% [7]. In another study the prevalence of NRS was reported at 2.7%; however, the lower frequency, than in our or Kashiwagi’s studies, may be ascribed to different inclusion criteria, which encompassed patients, of which the majority had no atherosclerosis [15].
The observed predilection of NRS to colonize proximal coronary segments is consistent with previous literature [6, 7]. It may partially explain why the occlusions contributing to ST elevation ACS occur mainly in so-called “hot spots” characterized by proximal locations and presence of multiple plaques [16]. In a previous IVUS study, the most prevalent site of plaque rupture was found also within the proximal LAD [17].
According to our analysis, NRS tended to localize in clusters, which was further highlighted by our follow-up findings, where the single NRS on the baseline examination predicted occurrence of future NRS. The tendency of coronary plaques displaying vulnerable characteristics to herd was previously observed in patients with stable angina [18]. However, the cited work was based on angiographic, ambiguous and non-specific signs of plaque vulnerability, as opposed to the current specific method for detection of high-risk-plaque. Our findings may suggest that plaque vulnerability is rather dependent on systemic (for example low HDL, diabetes, etc.), than the local pathophysiological factors. It may also explain why the risk of future ACS associated with the presence of NRS need not be linked to the baseline NRS itself, as described in a previous report of Otsuka et al. [6]. This fact may have implications for future management of patients with vulnerable plaques, supporting the systemic rather than local therapies, and questioning the concept of preventive stenting of non-significant but vulnerable plaques [5].
Based on previous serial IVUS studies, it can be deduced that coronary atherosclerosis (plaque burden), unless treated with an aggressive statin regimen, tends to progress over time [19, 20]. However, these studies are based on single vessel examinations, and do not analyze plaque vulnerability features, as opposed to our 3-vessel study. Current analysis shows that the number of vulnerable plaques likely increases over time, despite the state-of-the-art statin therapy. Statin treatment intensity was not observed to be correlated with NRS progression in our study, likely due to the relatively low number of patients. However, this finding should not discredit NRS as a possible imaging marker of adequate antiatherosclerotic therapy.
Obviously, the most significant reduction of risk of ACS can be attained by appropriate identification and targeted treatment of patients carrying the substrate for ACS – i.e. vulnerable plaques. Our report, despite its limitations, provides insight into the natural history of vulnerable plaques, with potential implications which may translate into improved patient outcomes. Those considerations may be of particular importance in the era of emerging personalized medicine, novel aggressive antiatherosclerotic therapies, including either systemic drugs or local stenting of presumably vulnerable but nonsignificant coronary stenoses [4].
The main limitation of our study was its non-prospective design, with inherent potential selection bias. Although the indications for the coronary CTA studies were in all instances intermediate probability of the presence of significant coronary stenosis, and we selected consecutive patients fulfilling the pre-defined criteria, other factors, unaccounted for, could contribute to the selection of these patients. The relatively high prevalence of NRS in our cohort may be related to likely selection bias, with more high-risk patients designated to undergo repeated coronary CTA studies. Therefore, our population should be cautiously regarded as representative of patients with suspected CAD diagnosed on coronary CTA. Despite excellent specificity, moderate sensitivity (at around 25%) may have obscured the majority of rupture-prone-plaques in both baseline and follow-up examinations. Since we did not measure markers of diabetes control (HbA1C) we cannot clearly distinguish whether progression of NRS was related to diabetes or rather to its inadequate control. Importantly, we also did not measure inflammatory markers, which could partly explain the progression of NRS. Our findings need validation in prospective studies.
Conclusions
The number of NRSs in patients with suspected significant CAD changes over time, with a tendency to increase. This progression may be predicted by the presence of diabetes or single NRS. These results suggest that diabetic patients may particularly benefit from imaging surveillance of atherosclerosis, and necessary adjustments of antiatherosclerotic therapies.


