
Summary
Current evidence suggests that ECG parameters such as the Tpe interval, QRS interval, and fragmented QRS (fQRS) can predict adverse outcomes in heart failure patients with reduced ejection fraction (HFrEF), yet their relationship with invasive hemodynamic parameters remains unclear. This study found that prolonged Tpe and QRS intervals were signif cantly associated with worse hemodynamic profiles and independently predicted adverse clinical outcomes, including hospitalization and mortality. These findings highlight the potential of ECG parameters as simple, noninvasive tools for risk stratification in HFrEF patients. Further research is needed to validate these results and explore their integration into routine clinical practice for improving patient management.
Introduction
Heart failure (HF) is a common cardiac problem that causes significant morbidity and mortality globally [1, 2]. Despite considerable advances in its diagnosis and treatment during the last decades, heart failure patients with reduced ejection fraction (HFrEF) still have a poor long-term prognosis [1–3]. Most of the hospitalized and ambulatory patients with HF do not survive secondary to cardiovascular causes, mainly sudden death due to electrical disturbances and worsening HF [3]. Numerous prognostic markers of mortality and hospitalization have been identified in patients with HF [4]. However, their clinical applicability is limited, and precise risk stratification in HF remains challenging [3]. This situation requires introduction of new parameters in the risk assessment and in determining the prognosis of HF.
ECG parameters have not been widely developed for use in risk stratification of HF, even though a 12-lead ECG is one of the most accessible tools and is usually available in most healthcare settings [5–7]. Although many ECG parameters such as fragmented QRS (fQRS) [5], Tpeak/Tend ratio [8, 9], width and morphology of QRS [10, 11], and QT intervals [12] have been shown to be related to arrhythmogenic events and prognosis, it is expected that determining the important ECG parameters representing different phases of cardiac electrical activity and evaluating them with a holistic approach will contribute more precisely to the evaluation process of prognosis.
In the management of HF, right heart catheterization (RHC) is crucial for precise hemodynamic evaluation to assess the therapeutic options [3, 13]. Accordingly, it should be performed in eligible patients with severe HF being evaluated for heart transplantation or life support with mechanical circulatory support (MCS) (Class I, Level of Evidence: C) [4, 13]. According to our knowledge, to date, few studies have evaluated both ECG and RHC parameters in patients with severe HFrEF.
Aim
The primary objective of this single-center, retrospective cohort study was to assess the prognostic value of ECG parameters in patients with severe HFrEF who had undergone RHC for evaluation of their candidacy for heart transplantation and/or MCS. The secondary aim was to investigate the relationship between ECG parameters and hemodynamic parameters in these patients.
Material and methods
Study population
Patients with HFrEF who had undergone RHC for evaluation of their candidacy for heart transplantation and MCS between January 2007 and January 2017 were enrolled in the study. HFrEF was defined as left ventricular ejection fraction (LVEF) ≤ 40% [3]. In the case of repeat catheterizations, we only considered previous catheterizations. Data related to baseline demographic characteristics, risk factors for cardiovascular disease, comorbid diseases, New York Heart Association (NYHA) functional classification status, medical treatment, physical examination, ECG parameters, intracardiac device history, echocardiographic and invasive hemodynamic status of the patients were obtained from the medical records of the patients. Patients aged < 18 years, those with ventricular paced rhythms, and those with a history of ventricular tachyarrhythmia (VT/VF) were excluded from the study. Written informed consent was obtained from all patients. The study protocol was approved by the local ethics committee.
All participants were followed up for the occurrence of the primary endpoints of all-cause mortality, and composite end-point (CEP) (2) CEP was defined as combination of recently experienced heart transplantation, MCS, and all-cause mortality.
The primary endpoint was ascertained from the medical records or official e-nabız (e-pulse) website of the Ministry of Health. If not accessible, data regarding participants’ status were collected via telephone follow-up from patients or their close relatives.
Patients were divided into two groups according to the presence of CEP and compared in terms of their baseline clinical characteristics, ECG, echocardiographic, and invasive hemodynamic parameters. Then, the correlations between ECG parameters (heart rate, QRS and, QT intervals, number of fQRS, and Tpe) and hemodynamic data were assessed. Additionally, we sought to determine whether major ECG abnormalities were independent predictors of the primary endpoints in the study cohort.
Echocardiographic examination
All transthoracic echocardiography examinations were performed before the catheterization using a General Electric Vivid 7 2.5 MHz probe in accordance with the guidelines established by the American Society of Echocardiography [14]. LVEF was estimated using the modified Simpson’s rule. Diastolic dysfunction is classified as Grade I (impaired relaxation), Grade II (pseudonormal) and Grade III-IV (restrictive).
Electrocardiographic parameters
A standard 12-lead ECG was recorded during the index hospitalization before application of RHC: using a Nihon Kohden, (Tokyo, Japan) ECG device with the following specifications: high-pass filter: 0.05–20 Hz (usually 0.15 Hz), low-pass filter: 100–150 Hz (usually 100 Hz), AC filter: 60 Hz, paper speed: 25 mm/s and voltage: 10 mm/mV. The QRS intervals were measured with a manual caliper in all 12 leads, and the highest result was considered for further analysis. The heart rate, PR, QRS, QT, Tpeak-Tend intervals, and number of fragmented QRS were noted.
The heart rate (HR) measured while the patient is at rest was taken into consideration. The interval from the beginning of the QRS complex to the end of the T wave was considered the QT interval. Measured values were corrected for HR using Bazett’s formula.
Fragmented QRS was defined as the QRS complexes with the presence of an additional R wave (R′) or notching in the nadir of the R wave or the S wave or the presence of > 1 R′ (fragmentation) in 2 contiguous leads [15]. Anterior fQRS, lateral fQRS, and inferior fQRS were defined by the presence of fQRS in 2 contiguous anterior, lateral, and inferior leads, respectively [10]. The number of leads with fQRS (at least two contiguous leads reminiscent of a significant coronary artery territory) was noted [16, 17].
The ‘tangent’ method for measuring the Tpeak-Tend interval (Tpe) identifies T-peak as the apex of the maximum positive or negative deviation of T wave from the isoelectric line. The T-end is delineated as the point where the isoelectric line intersects with the tangent to the descending slope of the T wave [18]. We employed the tangent method to quantify Tpe in representative beats in lead II and leads V1 to V6 on an electronic display at tenfold magnification utilizing electronic calipers.
Right heart catheterization and invasive hemodynamic data
End-expiratory right atrial (RAP), systolic and end-diastolic right ventricular (RVSP and RveDP, respectively), pulmonary capillary wedge (PCWP), systolic, diastolic, and mean pulmonary artery pressures (sPAP, dPAP, and mPAP, respectively) were measured and assessed utilizing a multipurpose catheter inserted via the right femoral venous approach, with patients in a resting supine position. Cardiac output (CO), cardiac index (CI), and pulmonary vascular resistance (PVR) were computed from the available data utilizing standard formulas. The CO and CI values were determined utilizing the Fick principle, which states that the total uptake of oxygen is equal to the product of the cardiac output and the arterial-venous oxygen content difference [19].
Systolic and end-diastolic left ventricular (LVSP and LVeDP), systolic/diastolic and mean aortic pressures (sAP, dAP and mAP, respectively) were measured using a pigtail catheter inserted through the right femoral artery. Arterial and venous oxygen saturations were measured using blood samples taken from the pulmonary aorta and artery, respectively.
Statistical analysis
Descriptive data were expressed as numbers (n) and percentages (%). The Shapiro-Wilk test was used to test the normality of continuous variables. Values for continuous variables were given as either mean ± standard deviation (SD) or as median (interquartile range [IQR]), based on the normality of distribution. Categorical variables were compared using the χ2 and Fisher’s exact tests. Normally distributed continuous variables were compared using the independent samples t-test. Pearson correlation coefficient or Spearman’s rank correlation coefficient was used to assess the strength of associations between two continuous variables, depending on the distribution pattern of data. Patients with a correlation coefficient of < 0.25 were evaluated as having a ‘weak’ correlation, ≥ 0.25 and < 0.50 as a ‘moderate’ correlation, ≥ 0.50 and < 0.75 as a ‘strong’ correlation, and ≥ 0.75 as a ‘very strong’ correlation.
Predictors of each end-point were further evaluated within stepwise multivariable Cox models, using all variables previously shown as covariates to predict those end-points. Receiver operating characteristic (ROC) curves were constructed to assess the predictive ability of each measurement method.
Cox regression analysis was conducted on all variables. Variables exhibiting unadjusted p-values below 0.10 were deemed potential risk factors and incorporated into the multivariate Cox regression analysis. Variables were chosen utilizing the forward likelihood ratio approach. Efforts were made to develop the most parsimonious model. To mitigate ‘time immortal bias’, we designated advanced heart failure interventions (heart transplantation and/or MCS) as a time-dependent covariate within the multivariate model.
‘Log time-log hazard’ curves were obtained to check the proportional hazards assumption. ROC curve analysis was performed to determine the best predictive cut-off values for ECG parameters that show CEP and all-cause mortality. Kaplan-Meier plots were constructed, and the log-rank test was utilized to compare the cumulative CEP. The p-value below 0.05 was considered statistically significant. All statistical analyses were performed with IBM SPSS version 20.
Results
Characteristics of study samples
During the study period, 550 patients with HFrEF underwent RHC, and 325 met the inclusion criteria. The mean age of the patients was 47.3 ±10.8 years, with a predominance of men (81.2%). Our all-cause mortality rate was 42.5% (n = 138). Twenty-one (6.4%) patients with MCS underwent interventions, including implantation of a left ventricular assist device (n = 17) or biventricular assist device (n = 1), transplantation of a total artificial heart (n = 1), or heart transplantation (n = 9; 2.8%), and 2 patients received life support using an extracorporeal membrane oxygenation (ECMO) device.
Comparison of patients with (n = 156) and without CEP (n = 169) is shown in Table I. Compared to the non-CEP group, patients in the CEP group were older and had higher B-type natriuretic peptide (BNP) levels (p = 0.037 and < 0.001). Presence of rales and pretibial edema on physical examination, NYHA class IV heart failure, and furosemide use were observed at a higher rate in the CEP group (p = 0.01, 0.009, < 0.001, and 0.005, respectively).
Table I
Demographic and clinical characteristics of patients
[i] Data are shown as mean ± SD. ACEI/ARB – angiotensin-converting enzyme inhibitor/angiotensin receptor blocker, BNP – B-type natriuretic peptide, CEP – composite end-point, EF – ejection fraction, fQRS – fragmented QRS, IVCD – intraventricular conduction delay, LBBB – left bundle branch block, LVEDD – left ventricular end-diastolic diameter, LVESD – left ventricular end-systolic diameter, NYHA – New York Heart Association, RBBB – right bundle branch block, SD – standard deviation, sPAP – systolic pulmonary arterial pressure, TAPSE – tricuspid annular plane systolic excursion, Tpe – Tpeak-Tend interval.
According to the echocardiographic examination and ECG characteristics, patients in the CEP group had higher systolic pulmonary artery pressure (sPAP) and left ventricular end-diastolic diameters (LVEDD) and lower EF and tricuspid annular plane systolic excursion (TAPSE) values compared to the non-CEP group (p < 0.001, 0.038, < 0.001, and 0.028, respectively). HR and the prevalence of bundle branch blocks in the CEP group were greater than in the non-CEP group. In the CEP group, QRS interval and Tpe were significantly longer, and the prevalence of fQRS was higher compared with the non-CEP group (p < 0.001, < 0.001, and 0.005, respectively). There were no significant differences between the CEP groups in terms of other echocardiographic and ECG parameters (p > 0.05).
Characteristic features of invasive hemodynamic data
Table II summarizes the invasive hemodynamic data obtained by RHC. Compared with the non-CEP group, patients in the CEP group had higher baseline RAP, right ventricular systolic and diastolic and pulmonary artery pressures, pulmonary capillary wedge pressure (PCWP), left ventricular end-diastolic pressure (LVEDP), and pulmonary vascular resistance (PVR); and lower left ventricular systolic pressure (LVSP), aortic systolic pressure, CO, CI, and venous saturation (p < 0.05). There were no significant differences between the groups in terms of other characteristic features.
Table II
Invasive hemodynamic data obtained by right heart catheterizations
[i] Data are mean ± SD. CI – cardiac index, CO – cardiac output, dAP – diastolic aortic pressure, dPAP – pulmonary artery diastolic pressure, LVEDP – left ventricular end-diastolic pressure, LVSP – left ventricular systolic pressure, mAP – mean aortic pressure, mPAP – pulmonary artery mean pressure, PCWP – pulmonary capillary wedge pressure, PVR – pulmonary vascular resistance, RAP – right arterial pressure, RVEDP – right ventricular end-diastolic pressure, RVSP – right ventricular systolic pressure, sAP – systolic aortic pressure, sPAP – pulmonary artery systolic pressure.
Correlations between ECG and hemodynamic parameters
The correlations between ECG (HR, QRS duration, QT interval, number of fQRS, and Tpe) and hemodynamic parameters were assessed (Table III). QT interval was negatively correlated with CO and CI (p = 0.001 and < 0.001). There was no significant association between HR and hemodynamic parameters (p > 0.05).
Table III
Correlations of ECG parameters with clinical and hemodynamic parameters
[i] BNP – B-type natriuretic peptide, CI – cardiac index, CO – cardiac output, dAP – diastolic aortic pressure, dPAP – pulmonary artery diastolic pressure, LVEDP – left ventricular end-diastolic pressure, LVSP – left ventricular systolic pressure, mAP – mean aortic pressure, mPAP – pulmonary artery mean pressure, NYHA – New York Heart Association, PCWP – pulmonary capillary wedge pressure, PVR – pulmonary vascular resistance, RAP – right arterial pressure, RVEDP – right ventricular end-diastolic pressure, RVSP – right ventricular systolic pressure, sAP – systolic aortic pressure, sPAP – pulmonary artery systolic pressure.
QRS interval was positively correlated with BNP (p = 0.009), NYHA class (p = 0.011), PVR (p = 0.003), RAP (p = 0.043), PCWP (p = 0.038), and RVEDP (p = 0.045), and negatively correlated with CO (p < 0.001), CI (p < 0.001), and sAP (p = 0.039). Similarly, Tpe was positively correlated with BNP value, NYHA class, PVR, RAP, PCWP, and mPAP, and negatively correlated with CO, CI, venous saturation, and sAP. Furthermore, the number of fQRS was positively correlated with RAP, PCWP, and mPAP, and negatively correlated with PVR and CO.
Prognostic value of ECG parameters
Age, NYHA functional class, presence of rales, use of furosemide, EF, sPAP, RAP, mPAP, CI, Tpe, QRS interval, and presence of fQRS were found to be predictors of CEP in univariate Cox regression analysis. Then, hierarchical Cox regression was performed, and we tried to determine whether these parameters had an effect on the CEP predictive power of Tpe, QRS duration, and fQRS (Table IV). Two different models were created to evaluate these three ECG parameters. It was observed that Tpe (Model 1) and QRS interval (Model 2) were independent markers of the CEP. In the multivariate analysis, each 1 ms increase in Tpe and in QRS intervals was associated with approximately 3% and 5% increases in the frequency of CEPs, respectively (HR = 1.027, 95% CI: 1.018–1.037, p < 0.001 and HR = 1.011, 95% CI: 1.004–1.108, p = 0.018, respectively).
Table IV
Univariable and multivariable* Cox regression analysis to determine the predictable risk factor for composite end-point
[i] CI – confidence interval, EF – ejection fraction, fQRS – fragmented QRS, HR – hazard ratio, mPAP – mean pulmonary artery pressure, NYHA – New York Heart Association, PVR – pulmonary vascular resistance, RAP – right atrial pressure, sPAP – pulmonary artery systolic pressure, Tpe – Tpeak-Tend interval. *Model 1 includes Tpeak-Tend (Tpe) interval as an independent variable, while Model 2 includes QRS interval. These two ECG parameters were analyzed in separate models to avoid collinearity and ensure independent assessment of their prognostic value. Other covariates were included in both models.
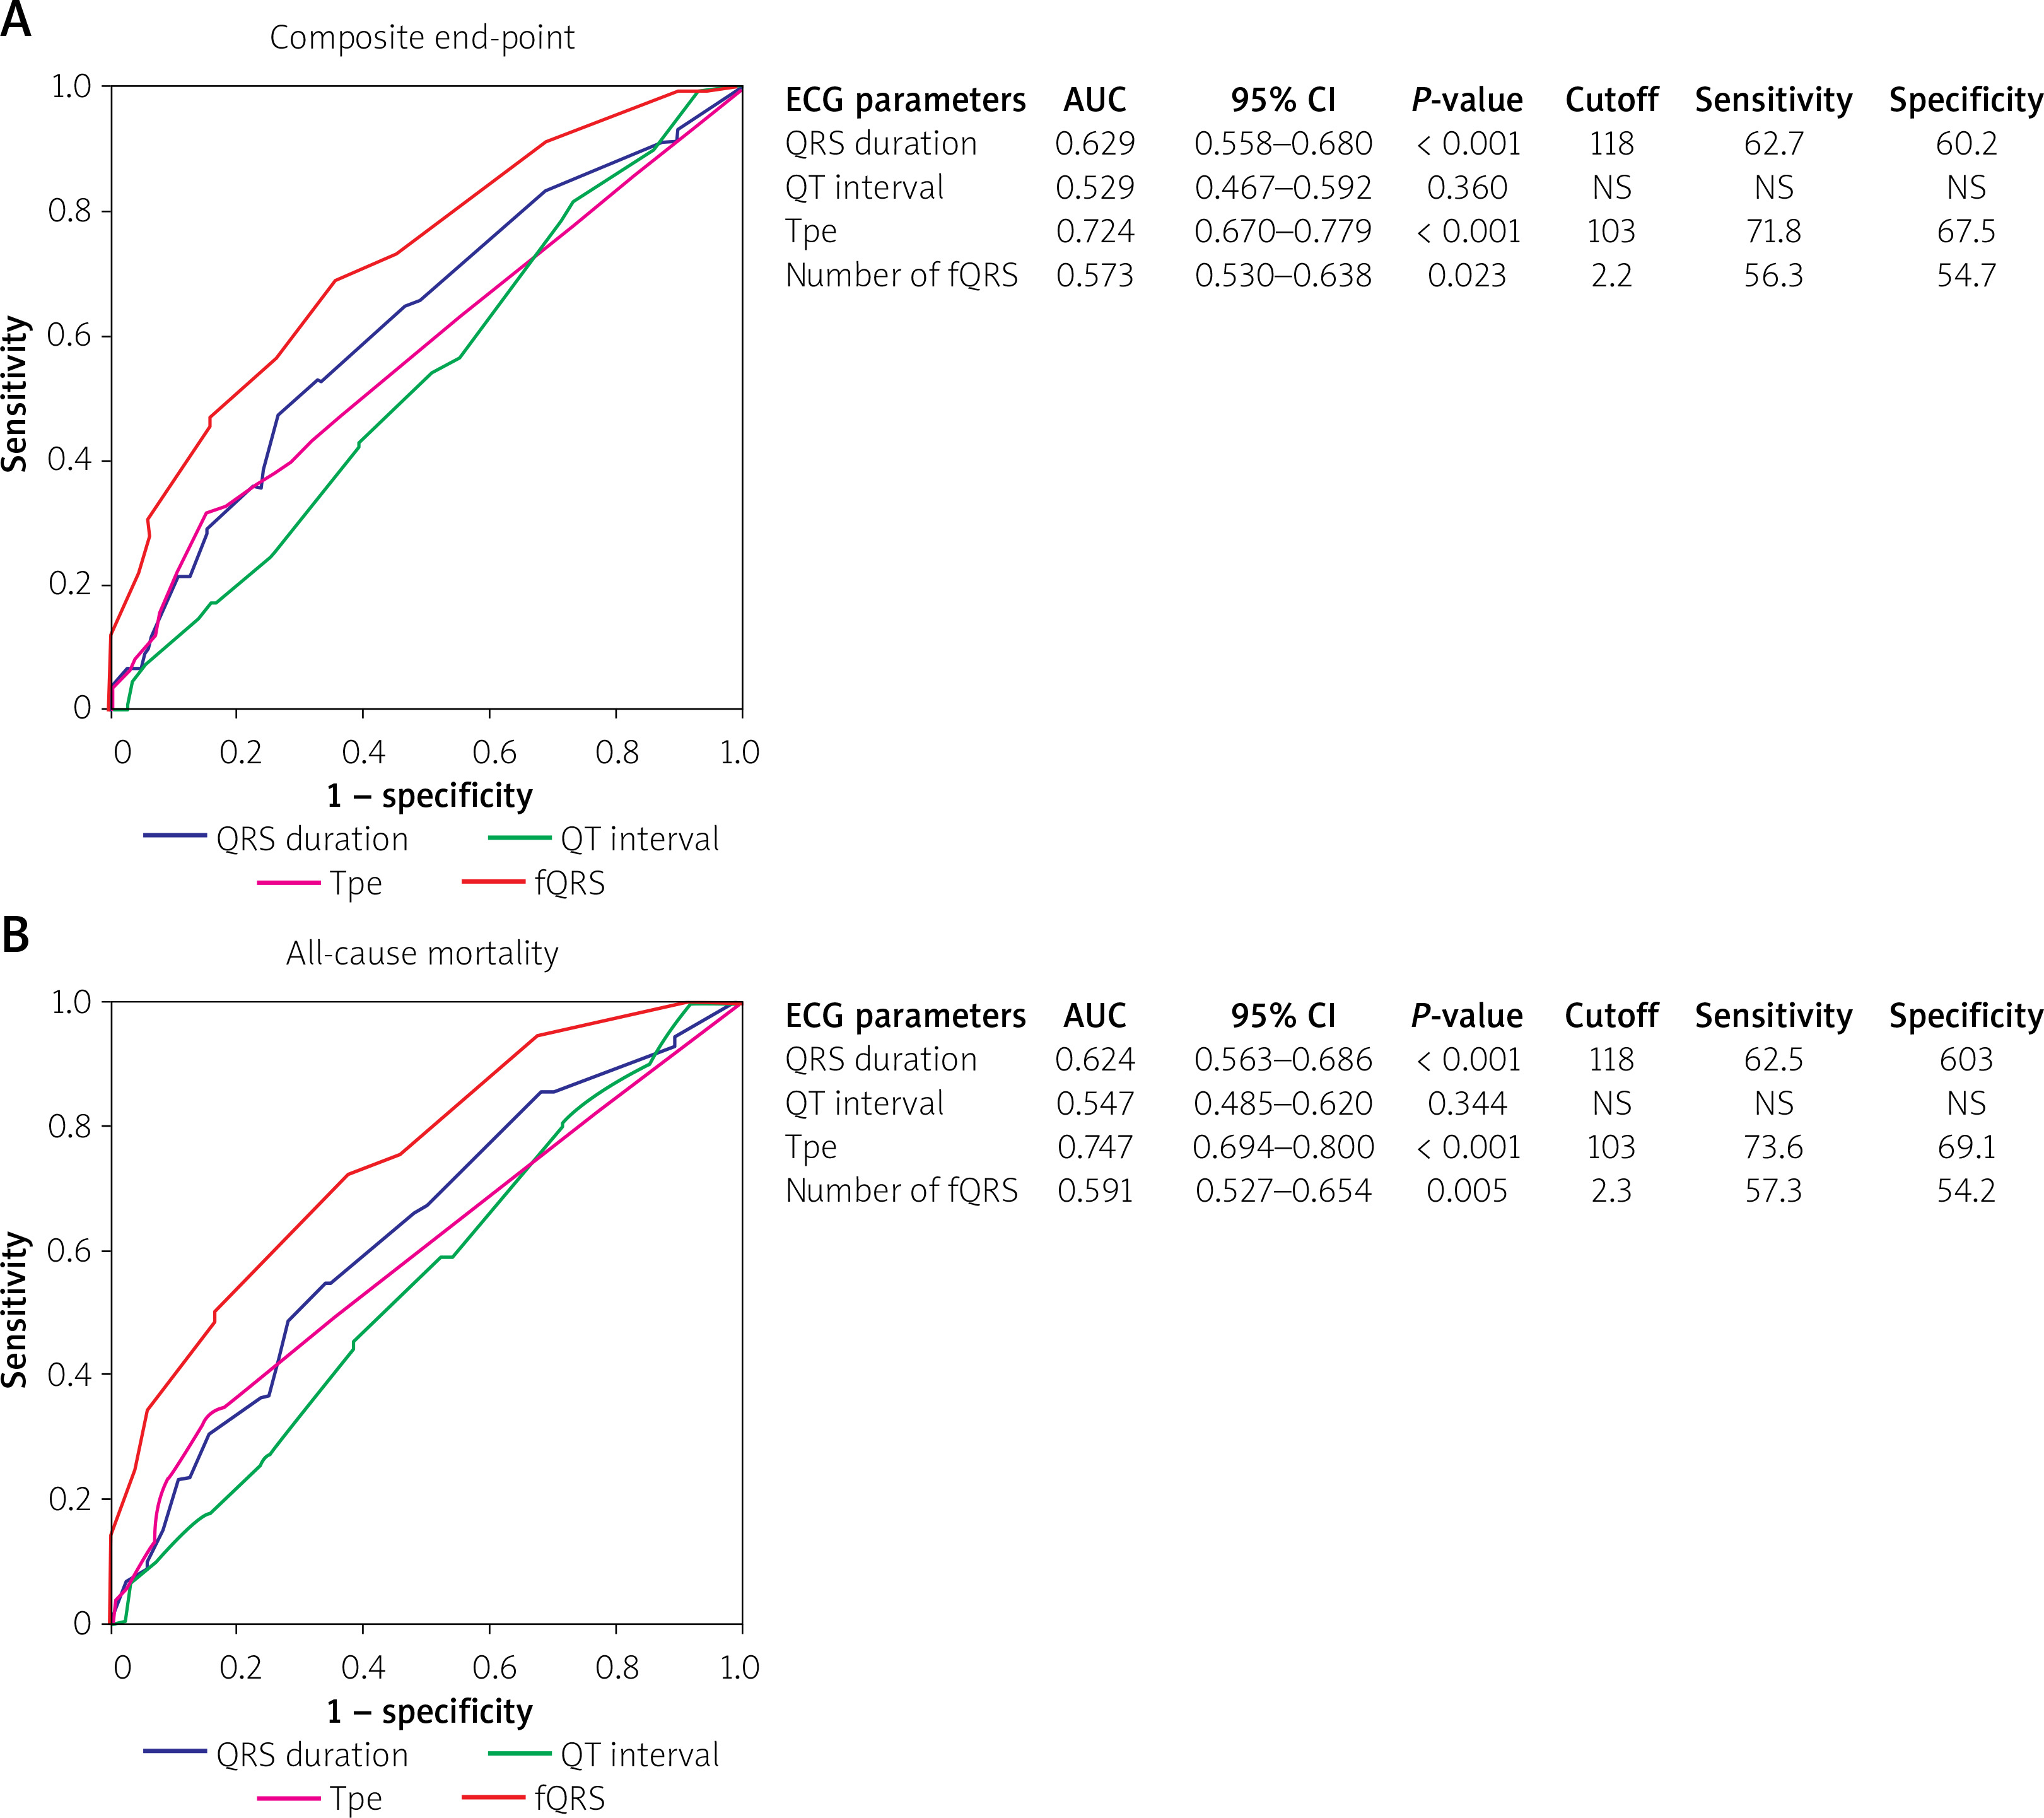
ROC analysis was performed to determine the ECG parameters that best categorize the risk for CEP and all-cause mortality (Figure 1). In the ROC curve, a cut-off value of 118 ms for QRS interval had a 62.7% sensitivity and a 60.2% specificity for the prediction of CEP and all-cause mortality (AUC = 0.629 and 0.624, respectively). Additionally, a cut-off value of 103 ms for Tpe duration had a 71.8% sensitivity and a 67.5% specificity for prediction of CEP and all-cause mortality (AUC = 0.724 and 0.747, respectively).
Figure 1
Receiver operating characteristic (ROC) curves for the prediction of composite end point (A) and allcause mortality (B) based on ECG parameters. ROC curves are drawn in blue for QRS, in green for QT, in red for Tpeak-Tend (Tpe) intervals, and in purple for fragmented QRS (fQRS) complex
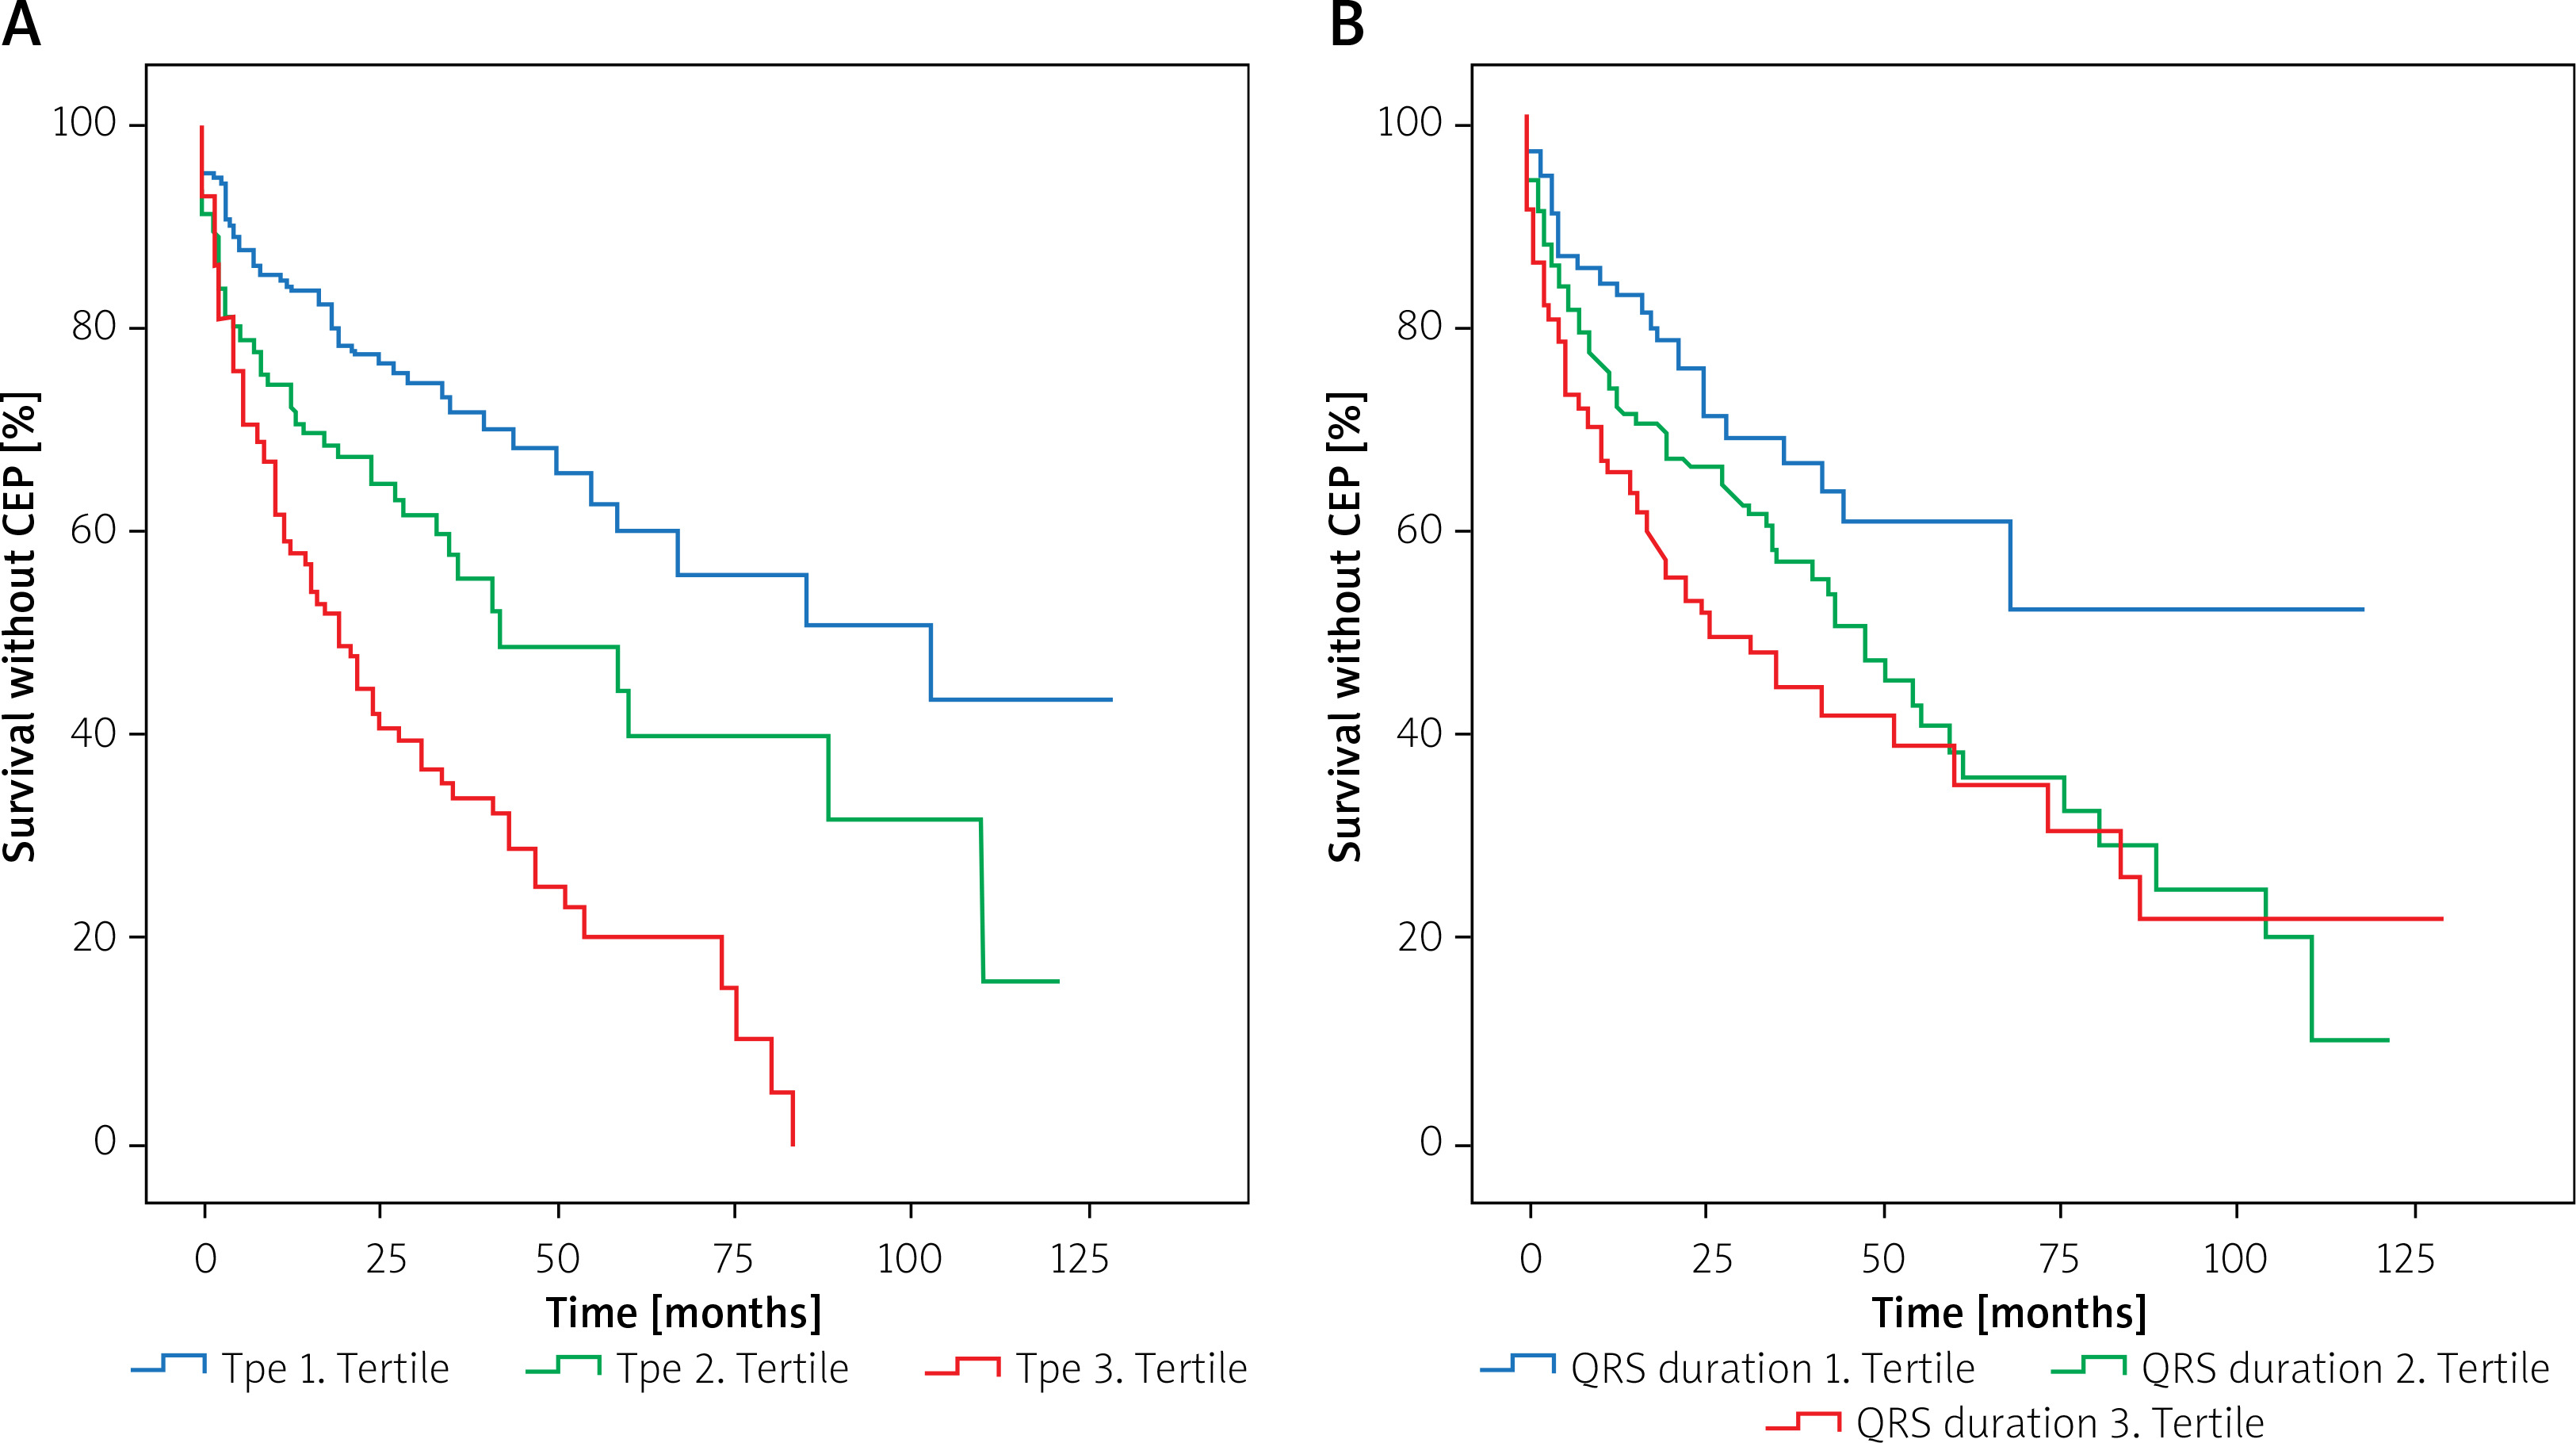
We divided patients into 3 groups according to these ECG parameters: for Tpe, 1st tertile [T1; 64–90], 2nd tertile [T2; 91–122] and 3rd tertile [T3; 123–149]. For QRS interval, 1st tertile [T1; 73–102], 2nd tertile [T2; 102–144] and 3rd tertile [T3; 144–178]. Kaplan-Meier analysis showed that survival without CEP was significantly lower in patients with higher Tpe and QRS tertiles than the other tertiles (log-rank test, χ2 = 43.532, p < 0.001 for Tpe; χ2 = 9.345, p = 0.009 for QRS interval) (Figure 2).
Discussion
Our study demonstrated that the Tpe calculated by the tangent method and QRS interval are independent predictors of CEP and all-cause mortality in patients with HFrEF. Prolongation of Tpe and QRS intervals was associated with a significantly increased risk of CEP, as shown by Kaplan-Meier survival analysis and multivariate Cox regression. By analyzing the significant correlations between ECG and invasive hemodynamic parameters, we have contributed to refining risk stratification and identifying key indicators of adverse outcomes in this high-risk population.
The presence of fQRS has been shown to be associated with myocardial fibrosis and scarring in many cardiovascular diseases, heart failure, and cardiomyopathies [5]. Its association with poor prognosis was confirmed in our study. While the localization of the fragmented QRS has no prognostic significance, the presence and frequency of fQRS have been associated with the mortality risk. fQRS, a marker of myocardial scarring, may indicate advanced structural heart disease, which predisposes patients to adverse outcomes. While fQRS showed significant associations with RAP, PCWP, and mPAP, its predictive power for CEP was less robust than that of Tpe and QRS intervals in multivariate models. This finding suggests that fQRS may serve as a supplementary marker rather than a primary prognostic parameter.
Patients with CEP exhibited more severe clinical and hemodynamic profiles, including higher NYHA class status, elevated sPAP, and lower EF and TAPSE values. Additionally, both QRS and Tpe intervals were positively correlated with NYHA classification, BNP and invasive hemodynamic measures of volume status (RAP, PCWP and PVR); and negatively correlated with CO, CI and systolic aortic pressure. The duration and morphology of the QRS allow us to have an idea about the structural features and functions of the ventricles. Our findings are consistent with prior evidence linking prolonged QRS and Tpe intervals with arrhythmogenic events and worse prognosis in HF populations [10, 11].
The Tpe parameter is a relatively new repolarization indicator introduced in recent studies. Tpe interval on the 12-lead ECG has been used as an index of dispersion of ventricular repolarization [20]. The Tpe interval is defined when the epicardium is repolarized and fully excitable, and M cells are still in the repolarization process and are prone to early post repolarization. QT interval, QT dispersion and T wave alternans are strongly correlated with the Tpe parameter [21, 22]. Prolonged Tpe interval has been shown to lead to VT/VF [23]. Its relationship with VT and VF attacks has been confirmed in various cardiovascular diseases such as long QT [24], Brugada syndrome [25], myocardial infarction [26], cardiomyopathies [27], and increased all-cause mortality in patients with HF [8, 28]. Matusik et al. suggested that the 12-lead ECG parameters may be associated with a diagnosis of Brugada syndrome and provide potential insights for its clinical management [29]. Similar to our study, Rosenthal et al. found that Tpe intervals above the cut-off value > 104 ms have higher predictive values for both CEP and mortality [28]. Notably, the optimal cut-off values for Tpe (103 ms) and QRS (118 ms) intervals identified through ROC analysis further validate their utility in clinical practice. Importantly, the highest tertiles of Tpe and QRS intervals showed the poorest survival outcomes, underscoring their role as potential markers for risk stratification.
The most important aspect that distinguishes our study from others is the relationship between ECG and both clinical and hemodynamic parameters. It was found that with the increase in Tpe intervals, the functional classes of the patients deteriorated, and congestive heart failure and higher BNP levels were more frequently encountered. As for the hemodynamic data, it was found that with prolongation of Tpe and QRS intervals, RAP, PCWP and PVR values increased; conversely CO and CI decreased. These associations reflect the interplay between electrical and hemodynamic abnormalities in advanced HF. Increased Tpe and QRS interval reflect greater ventricular remodeling, conduction delays, and heightened arrhythmogenic risk due to elevated intracardiac pressures and reduced systolic function. These insights emphasize the utility of ECG as a noninvasive and widely accessible tool to complement hemodynamic assessments in the management of HF.
Our study has several limitations. Being a single-center retrospective study, it may not fully account for potential confounders or reflect the diversity of HF populations. However, the relatively large number of patients in our study population and being a tertiary-care reference center with an established cardiac transplantation program are the strengths of our study. Additionally, the study did not address the longitudinal changes in ECG parameters or their responses to therapeutic interventions. There was no end-point reflecting long-term arrhythmogenic events such as sudden cardiac death, VT-VF attacks, or admission with ICD shock. Moreover, evaluation of the presence and extent of fibrosis with cardiac MRI or various biomarkers could greatly strengthen the findings of our study.
Current evidence suggests that ECG parameters such as the Tpe interval, QRS duration, and fragmented QRS (fQRS) can predict adverse outcomes in heart failure with reduced ejection fraction (HFrEF), yet their relationship with invasive hemodynamic parameters remains unclear. In this study, prolonged Tpe and QRS intervals were found to be significantly associated with worse hemodynamic profiles and to independently predict adverse clinical outcomes, including hospitalization and mortality. These findings highlight the potential of ECG parameters as simple, noninvasive tools for risk stratification in HFrEF patients. Further research is needed to validate these results and explore their integration into routine clinical practice for improving patient management.
Conclusions
This study highlights the prognostic significance of ECG parameters, particularly Tpeak-Tend (Tpe) and QRS intervals, in patients with HFrEF undergoing RHC. Both Tpe and QRS intervals were identified as independent predictors of CEP and all-cause mortality, with prolongation of these parameters associated with worse clinical outcomes. The large sample size and comprehensive integration of ECG, clinical, and hemodynamic data strengthen the reliability of these findings. These results underscore the power of utilizing routine 12-lead ECG, a widely available and cost-effective tool, to complement invasive assessments and enhance risk stratification in advanced management of HFrEF. Future multicenter, prospective studies are warranted to validate these findings and explore the dynamic nature of ECG parameters in HF progression.


