
Introduction
Preeclampsia (PE) is a relatively common complication in pregnancy, affecting 2–10% of pregnant women [1, 2]. The incidence of PE is higher in Africa (1.3%) and developing countries than in developed countries (0.5% in Europe) [3–5], and it is the second leading cause of maternal mortality [5].
Preeclampsia is a disease of multiple theories, which include genetic, immunological, uterine vascular, and endothelial dysfunctions [6]. Endothelial inflammation and dysfunction are the main possible mechanisms of PE [6].
Renal perfusion and glomerular filtration are reduced in PE, which subsequently affect the excretion of the urea, creatinine, and uric acid [6].
There is no reliable screening test to diagnose PE [5]. The serum uric acid (SUA) is one of the most sensitive indicators of the severity of PE, and a significant positive relations was observed between the SUA and severity of the hypertensive disorders in pregnancy and maternal outcome [7].
The high SUA in severe PE is associated with an increased risk of complications, i.e. hepatic dysfunction, and it could be a helpful marker for the severity of PE [8].
A large, controlled study and meta-analysis reported a positive linear association between the SUA and PE [9], and Roberts et al. found that high SUA was associated with adverse neonatal outcome including, lower birth weight, preterm deliveries, and small-for-gestational-age infants [10].
There are conflicting data regarding the relation between SUA and severity of PE, and a systematic review found that SUA was a poor predictor of maternal and foetal complications in severe PE [11]. Hence, this study designed to detect the relation between SUA and severity of PE.
Material and methods
A total of 110 women were included in this cross- sectional study, which was conducted over 2 years (2019–2020) after approval of the Maternity Hospital Ethical Committee (No. Obs_1208_19).
Participants were included in this cross-sectional study after informed consent following the Helsinki Declaration.
Inclusion criteria: pregnant women ≥ 20 years old, with mild PE, admitted in labour (mild-PE group) and pregnant women ≥ 20 years-old, with severe PE, admitted in labour or for induction of labour because of the severity of PE (severe-PE group).
ACOG defined PE as hypertension (HTN) and proteinuria after 20 weeks’ gestation without a previous history of HTN [12]. The proteinuria is ≥ 300 mg proteins/24-hr urine and/or protein/creatinine (P/C) ratio ≥ 0.3 [12].
The protein/creatinine ratio of 0.45 corresponds to 300 mg proteins/24-hr urine, while the P/C ratio of 0.9 corresponds to 1000 mg proteins/24-hr urine [13, 14].
The diagnosis of mild PE was based on blood pressure (BP) ≥ 140/90 mm Hg measured twice (≥ 4 hrs apart) after 20 weeks’ gestation without a previous history of hypertension, and proteinuria (P/C ratio ≥ 0.3) [12].
The diagnosis of severe PE was based on BP ≥ 160/ 110 mm Hg, after 20 weeks’ gestation without a previous history of hypertension, and proteinuria (P/C ratio ≥ 0.5) [12].
Women with chronic or gestational hypertension, superimposed PE, diabetes, urinary tract infection, or pre-existing chronic renal disease and those who refused to participate were excluded from this study.
Gestational hypertension is defined as HTN of new onset after 20 weeks’ gestation, without a previous history of hypertension, and/or proteinuria [15].
Chronic hypertension (CH) is defined as HTN diagnosed before pregnancy and persists postpartum [12, 16].
Superimposed PE is defined as HTN diagnosed before pregnancy and superimposed with proteinuria [15].
After a thorough history and clinical examination, renal function tests were done for participants according to the hospital’s protocol to exclude pre-existing chronic renal, followed by spot mid-stream urine samples to measure the P/C ratio [5].
The biuret colorimetric (Cobas Integra Analyzer, Switzerland) method was used to measure the urine proteins [16]. The modified Jaffe (Hitachi Autoanalyzer, Japan) test was used to measure the urine creatinine [13, 14]. The serum uric acid was measured by the enzymatic method. The collected participants’ data were statistically analysed, and the Pearson’s correlation coefficient was used to detect the relation between SUA and severity of PE.
Sample size
The sample size was calculated using G Power 3.1.9.7 software (Heinrich Heine Universität, Germany), setting the α-error at 0.05, power (1-β error probability) at 0.95%, effective sample size (w) at 0.5, and using the t-test for statistical analysis.
Results
A total of 110 pregnant women were studied; 55 wo-- men with mild PE (mild-PE group) were compared to 55 women with severe PE (severe-PE group) in this cross-sectional study to detect the relation between SUA and severity of PE.
Participants’ characteristics
There was no significant difference between the mild-PE group and the severe-PE group regarding the mean parity (1.49 ±1.16 vs. 0.71 ±1.02, respectively), (p = 0.1 [95% CI: 0.37, 0.8, 1.19]), gestational age at delivery (37.72 ±0.34 weeks vs. 34.8 ±1.50, respectively), (p = 1.0 [95% CI: 2.5, 2.9, 3.3]), and the number of women who had a previous history of PE (18.18% (10/55) vs. 21.82% (12/55), respectively), (p = 0.69) (Table 1).
Table 1
Characteristics, systolic and diastolic blood pressures, and serum uric acid of the 2 studied groups
The severe-PE group was significantly younger (27.42 ±5.35 years) than the mild-PE group (29.95 ±4.47 years), (p = 0.01 [95% CI: 0.37, 0.8, 1.2]), and the body mass index (BMI) was significantly higher in the severe-PE group (29.36 ±1.33 kg/m2) compared to the mild-PE group (27.59 ±1.79 kg/m2), (p = 0.01 [95% CI: –2.37, –1.8, –1.2]) (Table 1).
The mean systolic and diastolic blood pressures at delivery were significantly higher in the severe-PE group (176.82 ±2.59, and 116.18 ±2.69 mm Hg, respectively) compared to the mild-PE group (144.55 ±3.34, and 94.64 ±3.42 mm Hg, respectively), (p = 0.03 [95% CI: –33.4, –32.3, –31.1]), and 0.04 [95% CI: –20.7, –19.5, –18.4], respectively) (Table 1).
The serum uric acid and severity of preeclampsia
The serum uric acid was significantly higher in the severe-PE group (7.65 ±0.61 mg/dl) compared to the mild-PE group (5.26 ±0.79 mg/dl), (p = 0.02 [95% CI: –2.7, –2.4, –2.1]) (Table 1).
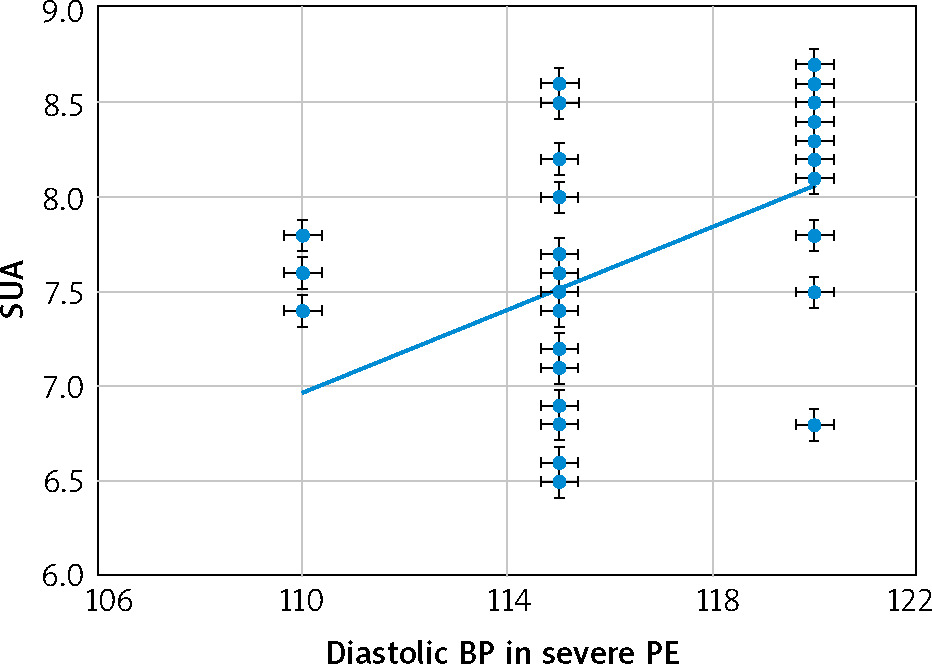
There were significant positive relations between the SUA and both the systolic (Fig. 1) and diastolic (Fig. 2) blood pressures [r = 0.27 (p = 0.045) and r = 0.483 (p < 0.001), respectively] in the severe-PE group.
Fig. 1
The relation between serum uric acid and systolic blood pressure in the severe-preeclampsia group
BP – blood pressure, PE – preeclampsia, SUA – serum uric acid
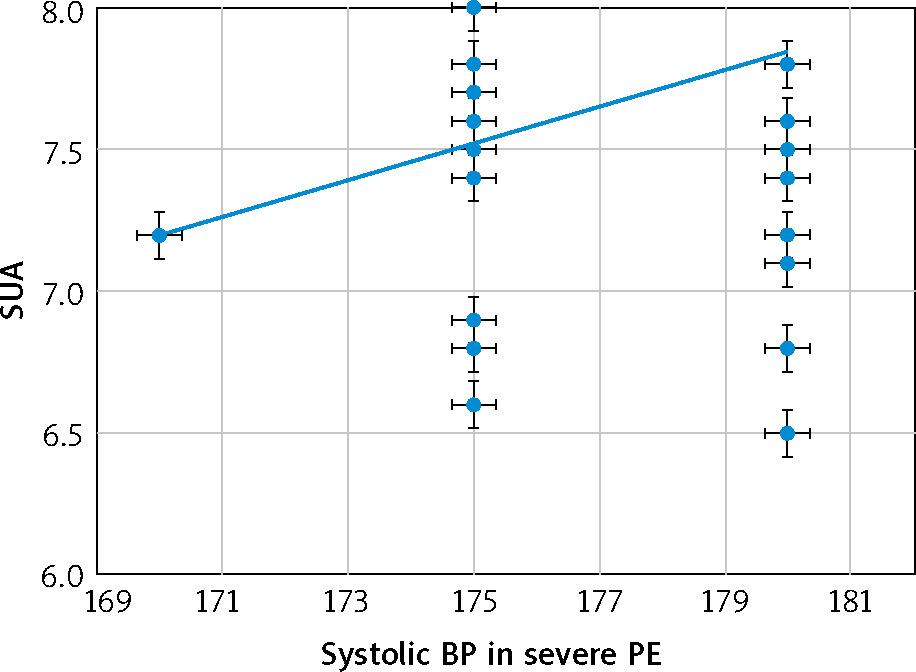
Fig. 2
The relation between serum uric acid and diastolic blood pressure in the severe-preeclampsia group
BP – blood pressure, PE – preeclampsia, SUA – serum uric acid
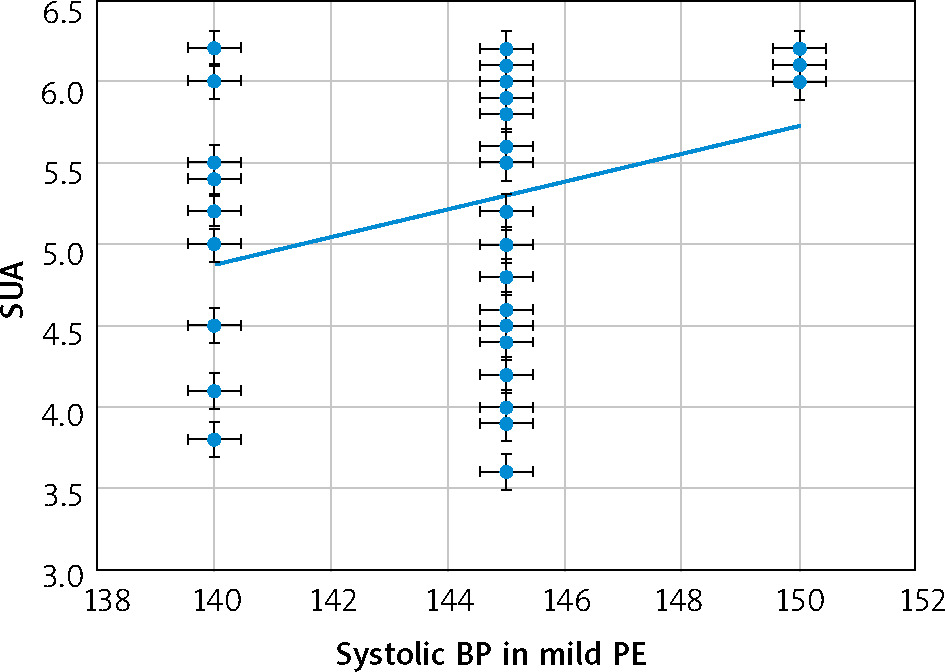
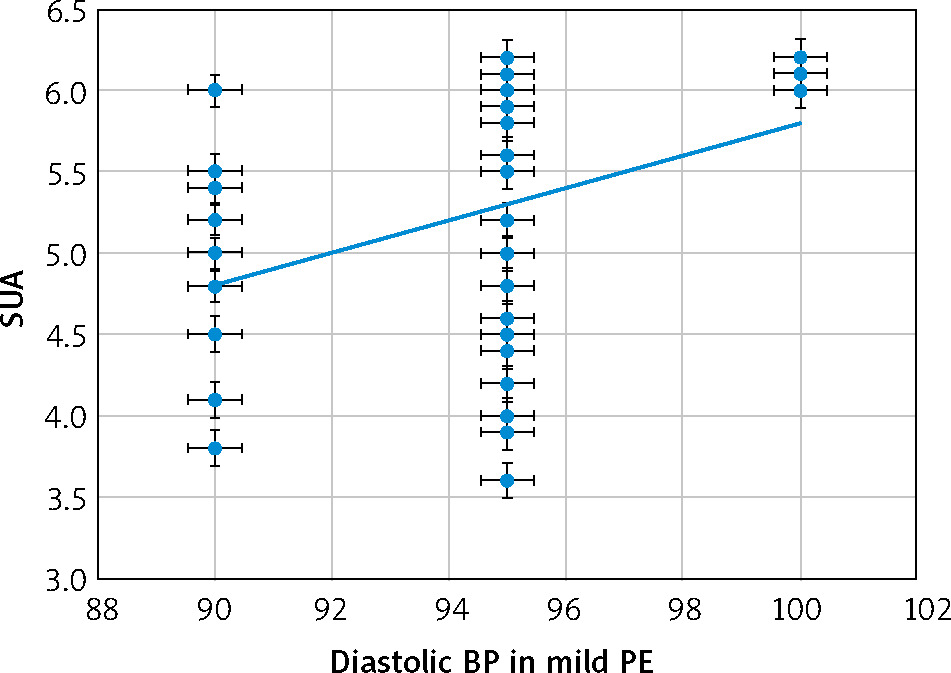
There were also significant positive relations between the SUA and both the systolic (Fig. 3) and dia-stolic (Fig. 4) blood pressures [r = 0.359 (p = 0.007), and r = 0.429 (p = 0.001), respectively] in the mild-PE group.
Discussion
Although previous studies found a significant relation between the SUA and severity of PE [9, 10], there are conflicting data regarding this relation, and a systematic review found that the SUA was a poor predictor of maternal and foetal complications in severe PE [11]. Therefore, 110 pregnant women were studied; 55 with mild PE (mild-PE group) were compared to 55 women with severe PE (severe-PE group) in this cross-sectional study to detect the relation between SUA and severity of PE.
Participants’ characteristics
There was no significant difference between the mild-PE group and the severe-PE group regarding the mean parity (p = 0.1), gestational age at delivery (p = 1.0), and the number of women who had a previous history of PE (p = 0.69).
The severe-PE group in this study was significantly younger (27.42 ±5.35 years) than the mild-PE group (29.95 ±4.47 years), (p = 0.01), and the BMI was significantly higher in the severe-PE group (29.36 ±1.33 kg/m2) compared to mild-PE group (27.59 ±1.79 kg/m2), (p = 0.01).
A retrospective multicentre study found that PE women were younger with low parity than those with CH [15].
One hundred and twelve cases of severe PE/eclampsia were studied in a retrospective study, and the majority (41%) of them were primipara [17].
A review article found that young pregnant women with higher BMI are at increased risk of PE/eclampsia than others [18].
The mean systolic and diastolic blood pressures at delivery were significantly higher in the studied severe-PE group (176.82 ±2.59 and 116.18 ±2.69 mm Hg, respectively) compared to the mild-PE group (144.55 ±3.34 and 94.64 ±3.42 mm Hg, respectively), (p = 0.03 and 0.04, respectively).
The ACOG defined mild PE as BP ≥ 140/90 mm Hg measured twice (≥ 4 hrs apart) after 20 weeks’ gestation without a previous history of hypertension, and proteinuria (P/C ratio ≥ 0.3) [12].
The ACOG defined severe PE as BP ≥ 160/110 mm Hg after 20 weeks’ gestation without a previous history of hypertension, and proteinuria (P/C ratio ≥ 0.5) [12].
The serum uric acid and severity of preeclampsia
This study found that the SUA was significantly higher in the severe-PE group (7.65 ±0.61 mg/dl) compared to the mild-PE group (5.26 ±0.79 mg/dl), (p = 0.02), and there were significant positive relations between the SUA and both the systolic [r = 0.27 (p = 0.045)] and diastolic [r = 0.483 (p < 0.001)] blood pressures in the severe-PE group. There were also significant positive relations between the SUA and both the systolic [r = 0.359 (p = 0.007)] and diastolic [r = 0.429 (p = 0.001)] blood pressures in the mild-PE group.
Serum uric acid is derived from purine oxidation. In pregnancy, the normal SUA ranges between 0.3 and 6 mg/dl, which is less than the non-pregnant level (because of the increased glomerular filtration rate [GFR] during pregnancy) until the 20th week of gestation. In the third trimester the SUA increases gradually and reaches the non-pregnant level [19].
The serum uric acid is elevated in PE due to increased vasoconstrictors (i.e. angiotensin II), which leads to decreased renal blood flow and GFR, with subsequent decreased uric acid clearance [19].
Hyperuricaemia associated with abnormal placentation occurs in severe PE. Nitric oxide (NO) is essential for trophoblast invasion, which is critical for foetal development. The hyperuricaemia diminishes the NO production, with subsequent dysregulation of the trophoblast invasion [19].
Moreover, renal injury occurs in severe PE, associated with decreased GFR and uric acid clearance [19].
Uric acid is a known biomarker for placental ischaemia, renal injury, and oxidative stress, which also occur in severe PE [19].
Kondareddy and Prathap found that the SUA is increased in PE (6.2 ±1.4 mg/dl) compared to normal pregnancy (4.3 ±0.8 mg/dl) [20], and it is a sensitive indicator for PE, with 90% sensitivity and 85% specificity [21].
Nair et al. found a positive correlation between SUA and severity of PE [22]. Roberts et al. found that high SUA was associated with adverse neonatal outcome, including lower birth weight, preterm deliveries, and small-for-gestational-age infants [10].
Moreover, another retrospective study found that elevated SUA in HTN disorders with pregnancy were an important predictor of increased risk of adverse maternal and foetal outcomes [23].
A comparative study found that SUA had high predictive value to identify PE women at high-risk of IUGR (intrauterine growth retardation) [24]. The elevated SUA in severe PE is mainly due to reduced uric acid clearance, and it is an indication of renal cortical and placental blood flow dysfunction [24].
A recent meta-analysis found that the SUA was elevated in severe PE, eclampsia, and HELLP syndrome (haemolysis, elevated liver enzymes, low platelet count) and concluded that the SUA can be used for the predication of the severity of PE, and PE-associated complications [25].
The current study was the first study conducted in Maternity Hospital to detect the relation between the SUA and severity of PE. This study found that the SUA was significantly higher in the severe-PE group compared to the mild-PE group. There were significant positive relations between the SUA and both the systolic and diastolic blood pressures in the severe-PE group. There were also significant positive relations between the SUA and both the systolic and diastolic blood pressures in the mild-PE group. This study recommends the use of SUA as a reliable marker of the severity of PE.
The failure to detect the relation between SUA and maternal and foetal outcomes (because of the cross- sectional nature of the study and the incomplete delivery and neonatal records) was a limitation of this study. Further studies including the maternal and foetal outcomes are needed to confirm the relation between SUA and adverse maternal and foetal outcomes in PE.
Conclusions
Serum uric acid was significantly higher in the severe-PE group compared to the mild-PE group. There were significant positive relations between the SUA and both the systolic and diastolic blood pressures in the severe-PE group. There were also significant positive relations between the SUA and both the systolic and diastolic blood pressures in the mild-PE group. This study recommends the use of SUA as a reliable marker of the severity of PE.