
Introduction
Cardiac magnetic resonance (CMR) has grown over the past several years as a widely used modality in the evaluation of myocardial injury, which is mostly based on the late enhancement (LE) technique [1–3]. The recently developed CMR mapping imaging is a promising tool in myocardial evaluation, which relies on changes in T1 and T2 relaxation times and extracellular volume (ECV) [1–3]. Contrary to LE, the native T1 and T2 mapping technique is a quantitative evaluation, does not require administration of gadolinium contrast, and may be helpful in the evaluation of patients in whom contrast is contraindicated, such as those with severe renal failure.
T1 mapping relaxation values reveal prolongation in edema and necrosis with their relative shortening in fibrosis and hemorrhage [1]. Thus, T1 mapping is a promising technique in the detailed evaluation of acute and chronic myocardial injury [2]. In acute myocardial infarction, edema and necrosis are observed due to destruction of cell membranes and can be detected using the T1 mapping technique as an increase in its value [4]. Microvascular obstruction (MVO) in the infarct core (no-reflow phenomenon) can also be evaluated in native T1 mapping, where pseudo-normalization of T1 values are seen due to the accumulation of methemoglobin (T1 shortening effect). In a chronic infarct, necrotic tissue is replaced by fibrosis or lipids, which is revealed by a decrease in native T1 mapping value when compared to the acute stage However, there is a paucity of data concerning the relationship between T1 mapping values of the peri-infarct area and remote myocardium in acute and chronic stages of the infarct.
Aim
Therefore, the aim of our study was to perform comparative quantitative evaluation of the T1 mapping values of the infarcted and salvaged myocardium in acute and chronic stages of the infarct.
Material and methods
Cardiac magnetic resonance examinations were performed in patients with acute STEMI and in the 6-month follow-up on a 3T Magnetom Skyra scanner (Siemens, Erlangen, Germany). Images were obtained in consecutive short-axis slices covering the left ventricle (LV) and three long-axis (2-, 3-, and 4-chamber) slices. T1 mapping was performed using the Modified Look-Locker Inversion-Recovery (MOLLI) sequence. Consecutive short-axis LE images covering the LV were obtained approximately 10–15 min after administration of a gadolinium-based contrast agent (0.1 mmol/kg of body weight).
Analysis of T1 mapping images was performed in 30 consecutive CMR patients in acute and chronic stages of the infarct (Figure 1). Each examination was quantitatively evaluated in the T1 mapping sequence measured at the area of infarct, no-reflow, peri-infarct, and remote myocardium with reference to LE images. Results from quantitative analysis were presented as mean ± SD and compared using Student’s t-test, with p < 0.01 being considered as statistically significant. Statistical analysis was performed using Statistica 10 software (StatSoft Inc.). The local bioethics committee reviewed and approved the study protocol.
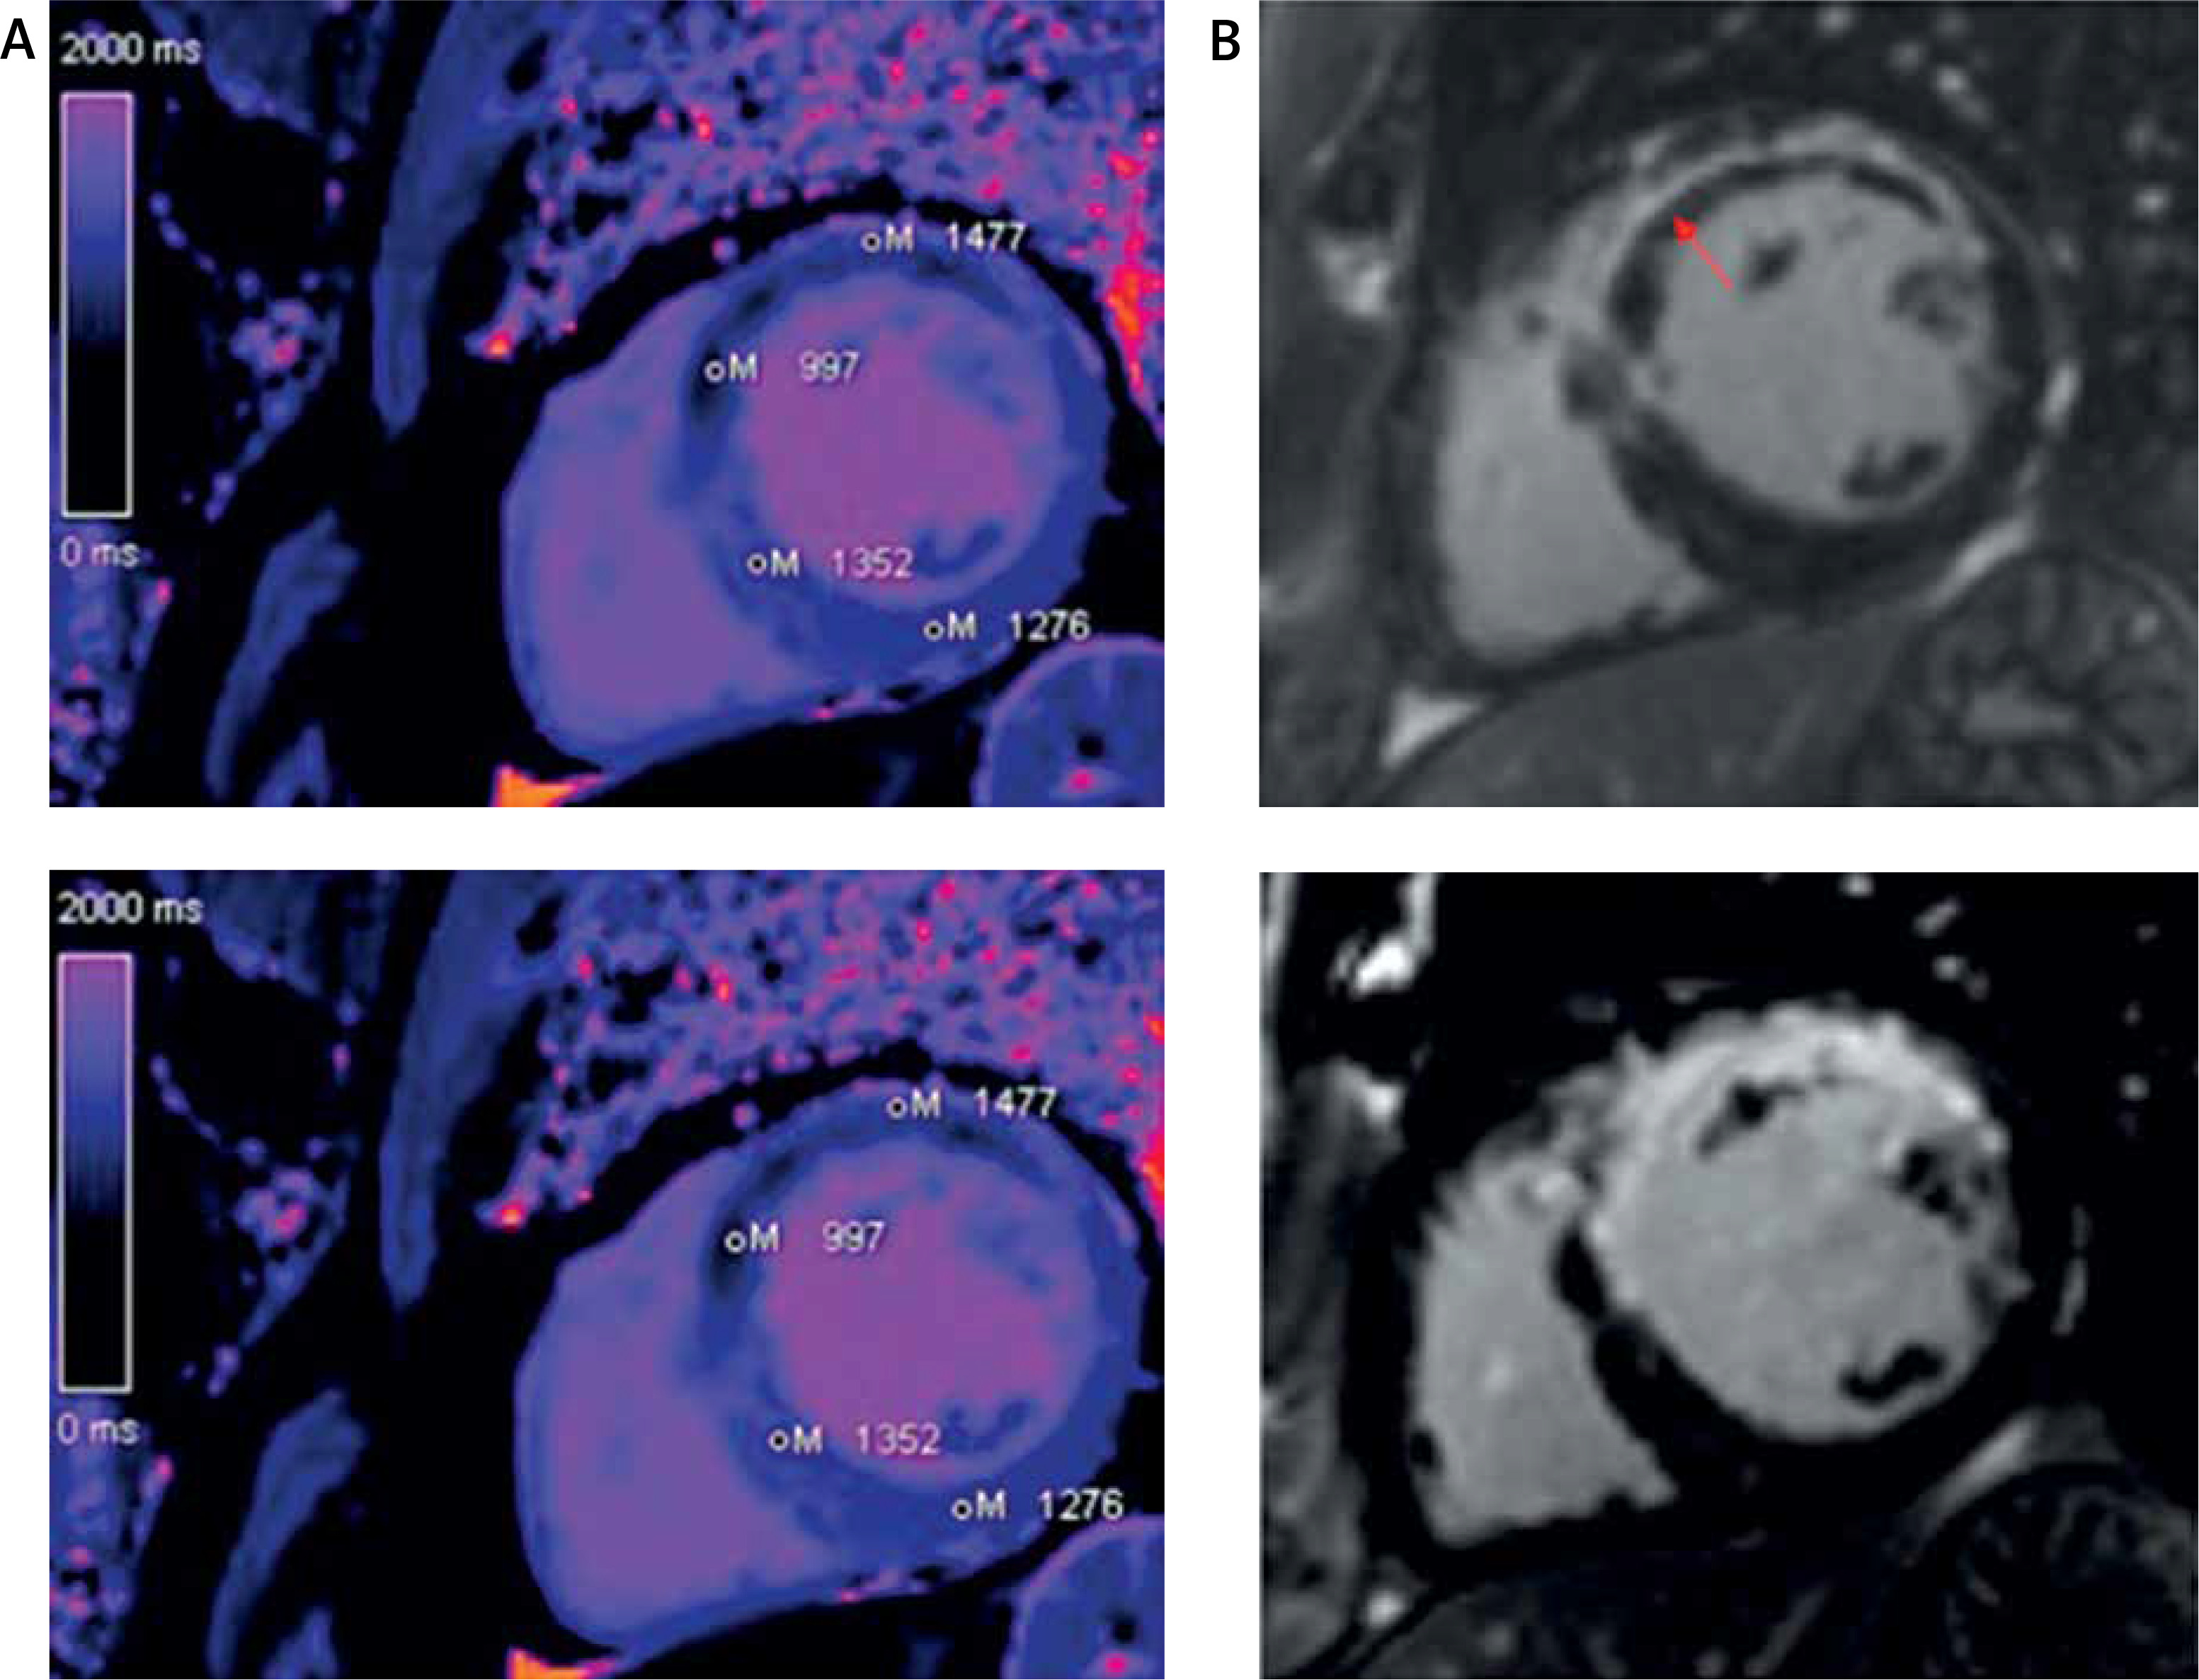
Figure 1
Acute and chronic infarction short axis images in T1 mapping and late gadolinium enhancement (LGE). Quantitative evaluation of infarct core and remote myocardium in T1 mapping. A – Native T1 map (base and follow-up). The resulting pixel by pixel color T1 maps are displayed using a customized table (0–200 ms). B – LE red arrow, MVO red arrow (base and follow-up)
Results
The mean age of evaluated patients was 68.7 ±12.1 years and their mean body mass index (BMI) was 25.7 ±4.4 kg/m2. The average time between baseline and follow-up CMR was 189 ±11.6 days. The evaluated infarcts concerned left anterior descending branch-, circumflex branch-, and right coronary artery-supplied myocardial segments in 15, 5, and 10 cases, respectively. In quantitative evaluation, the value of T1 mapping in the infarct area was significantly higher in patients at the baseline CMR than in the follow-up (1564.1 ±146.5 vs. 1384.8 ±79.1; p < 0.0001), and tended to be lower in the no-reflow area in patients at the baseline CMR than in the follow-up (1200.3 ±246.2; 1332.8 ±138.5; p = 0.0291). There was no significant difference in the value of T1 mapping in the peri-infarct area and remote myocardium compared at the baseline CMR and in the follow-up (Table I). The difference between T1 mapping values of the peri-infarct area and remote myocardium was significant at baseline (50.0 ±69.8; p = 0.0008) and tended to be significant in the follow-up (53.7 ±89.1; p = 0.002).
Table I
Values of T1 mapping measurement for areas of infarct, no-reflow, peri-infarct, and remote myocardium at the baseline and in the follow-up
Discussion
Our results show that in acute and chronic myocardial infarction, the T1 mapping technique may play an important role in distinguishing between areas of reversible and irreversible injury. Those findings are consistent with previous analyses [5–8] concerning myocardial infarction quantitative T1 mapping evaluation. However, the superiority of T1 mapping over late gadolinium enhancement (LGE) in the evaluation of infarct size has not yet been demonstrated [5]. In our study, we observed an increase in the T1 values of the peri-infarct zone in acute myocardial infarction (AMI), which is in line with previous reports [6, 7]. Interestingly, in the acute stage, an increase in the T1 mapping value of the peri-infarct zone is predictive of adverse LV remodeling and adverse cardiac events [9]. This could occur due to the presence of inflammation surrounding the area of maximal injury [7]. Additionally, we compared the T1 values between the peri-infarct and remote myocardium. Here, we observed significant differences in the acute stage and in the follow-up. This difference is related to the presence of edema in AMI and its progressive decrease in chronic myocardial infarction (CMI). To the best of our knowledge, this is one of the first comparisons in the existing literature. Garg et al. [8] also performed a similar analysis and noted quantitative differences in the peri-infarct and remote myocardium. However, they concentrated on the ECV and T2 mapping evaluation, while we performed T1 native quantification. We are aware that our study is limited by the fact that we did not perform ECV and T2 mapping analysis; this work would benefit from such an evaluation.
Interestingly, in contrast to Liu et al. [5], we found significant T1 value differences in the infarct core between AMI and CMI. This difference may be attributed to several factors. First, our analysis was performed in human subjects while the study from Liu et al. was based on a pig model. Second, we performed follow-up examinations in the same group approximately 6 months after AMI, while Liu et al. [5] enrolled new pigs for CMI evaluation with a mean time of approximately 40 days after infarction. Finally, and most importantly, we differentiated between infarct core and microvascular obstruction in our quantitative analysis, while the above-mentioned studies did not. This might have led to underestimation of the T1 value of the acute infarct due to its pseudo-normalization in the area of methemoglobin accumulation. This explanation also supports our observed tendency towards increased T1 values in CMI when compared to AMI. Interestingly, there are differences in T1 mapping values between the area of the infarct core and MVO in AMI, with equalization of these values in the follow-up. This suggests that T1 mapping in AMI not only detects the area of irreversible damage but also may enable its histological evaluation without the need for contrast injection. It is well known that the presence of MVO in LGE images is a predictor of major cardiovascular complications, including death and heart failure [10]. It was previously observed that T1 shortening due to hemorrhage in the acute infarct is associated with a worse prognosis [9].
In aggregate, T1 mapping may thus play an important role in evaluation of novel therapies [11, 12] that are needed today to address the growing burden of cardiovascular disease, including the acute ischemic injury progression to chronic ischemic heart failure [13].
Conclusions
The cardiac magnetic resonance non-contrast T1 mapping technique has the potential to differentiate between injured and salvaged myocardium in acute and chronic myocardial infarction. Moreover, it enables quantitative morphological differentiation of infarcted and salvaged myocardium, including characterization of the peri-infarct area and microvascular obstruction.


