
Summary
Greater release of interleukin (IL)-12p40 concentration in the initial phase of myocardial infarction (MI) is associated with the development of adverse cardiac remodeling. Greater release of IL-12p40 in the acute phase can increase cardiac damage by inducing interferon γ and matrix metalloproteinase.
Introduction
Acute myocardial infarction (MI) can cause impaired cardiac function and is related to poor prognosis depending on the amount of endangered myocardium and processes related to post-infarct healing [1]. The fate of cardiac repair depends on the balance between the extent of ischemia, inflammation, and oxidant radicals that prevail in the cardiac tissue and cardiovascular system and the level of defense systems against these pathological conditions [2]. Excessively increased inflammation or oxidant radicals are associated with maladaptive or adverse remodeling (AR), while higher levels of defense systems ensuring anti-inflammatory and antioxidant balance are associated with adaptive or reverse remodeling (RR) [3].
A significant increase in the level of pro-inflammatory cytokines is observed in the post-MI period, and they play an important role in cardiac remodeling [4]. Heart failure developing after MI is associated with cardiac remodeling, which is characterized by changes in cardiac structure, shape, and function [5]. It is known that overproduction of pro-inflammatory cytokines, apoptosis, matrix metalloproteinase (MMP) activation, collagen production, and fibrosis are triggered in such cases, causing ventricular dilatation and heart failure [6]. Growing evidence indicates that increased levels of pro-inflammatory cytokines such as tumor necrosis factor α (TNF)-α, interleukin (IL)-1, IL-6, and IL-12 are associated with mortality and morbidity, while anti-inflammatory cytokines such as IL-10 can suppress acute MI-induced inflammatory responses and are associated with better prognosis [7, 8]. However, the results of large cytokine profile studies of cardiac remodeling in ST-elevation myocardial infarction (STEMI) patients suggest that similar or different cytokines may be involved [9, 10]. Therefore, this topic warrants further research.
IL-12 is a pro-inflammatory and heterodimeric cytokine containing p35 and p40 subunits, and it is closely related to cardiovascular diseases and plays a role in pathogenesis by different mechanisms [7]. The p40 molecule is shared by IL-12, which supports T-helper (Th)-1 T cell responses, and IL-23, which supports Th-17 T cell responses [11]. IL-12 induces T cells’ production of potent pro-inflammatory cytokines such as TNF-α and interferon γ (IFN-γ), which play roles in all inflammatory processes [12]. Furthermore, IL-12, including p35 and p40, is involved in the upregulation of MMPs [13, 14]. However, the role of IL-12p40 in AR remains unclear.
Aim
This study was undertaken to examine the role of changes in pro-inflammatory cytokine concentrations in the development of AR after STEMI. We also aimed to investigate the relationships between the expression of IL-12p40 and IFN-γ and MMPs.
Material and methods
This prospective observational multicenter study was conducted between June 2015 and June 2020 at Ankara Dr. Nafiz Korez Sincan State Hospital, Ankara Diskapi Training and Research Hospital, Yildirim Beyazit University Atatürk Training and Research Hospital, and Ankara Numune Training and Research Hospital. The study was performed in accordance with the Declaration of Helsinki and was approved by the Local Ethics Committee (2013/106). Written informed consent was obtained from all patients.
Study population
Two hundred ninety-four consecutive patients (> 18 years of age) who were admitted to the hospital with non-inferior wall STEMI for the first time ever and underwent primary percutaneous coronary intervention (pPCI) within 12 h after the onset of chest pain were evaluated in this study. STEMI was defined according to the third universal definition of MI [15] and managed according to the latest European Society of Cardiology guidelines [16]. Results of previous studies showed that inflammatory markers may have a significant or potential relationship with the circadian clock [17–19]. The circadian clock can affect the infiltration of inflammatory cells into tissue [20]. Epidemiological studies show that the development of AMI is associated with a day/night pattern [21, 22]. Moreover, it has been suggested that the time of onset of MI is an independent predictor of infarct size, LV function, and mortality [23, 24]. In the light of these findings, the levels of inflammatory markers may show higher or lower expression depending on the inflammatory response in patients presenting at different daily rhythm periods. Therefore, only patients admitted early in the day (8:00–12:00) were evaluated to prevent the effects of daily rhythms on expression differences of inflammatory markers. Two hundred and forty-three patients did not meet the inclusion criteria. In 8 cases, no changes in volume or changes of less than 12% were observed in the 6-month follow-up examinations, and these patients were also excluded. The remaining 43 patients who were admitted to the hospital with STEMI for the first time were included in the study.
Patients with any mechanical complications (ventricular septal rupture, ventricular free wall rupture or cardiac tamponade, and papillary muscle rupture), patients with cardiac arrests, those in cardiogenic shock (defined as systolic blood pressure of ≤ 90 mm Hg), those in need of hemodynamic support, those who previously had silent ischemia/infarct or right coronary artery occlusion, those with any systemic inflammatory disease or autoimmune disease, those with a history of chronic corticosteroid or anti-inflammatory drug use, those who were pregnant or had given birth or been breastfeeding in the last 90 days, those who were selected to undergo emergency or elective coronary artery bypass grafting (CABG) after angiography, those who had claustrophobia or contraindications in CMR imaging, those who withdrew their consent to participate, those who died in hospital, and those who dropped out of follow-up or did not undergo the second session of CMR imaging (for non-contact or logistical reasons, refused, re-infarction, or death) were excluded from the study. We also excluded patients with a previous history of MI in this study, as it may cause bias for cardiac remodeling at 6-month follow-up. In these patients, there was a possibility of progression to heart failure with the possibility of completion or continuation of cardiac remodeling. A sustained inflammatory response can cause variation in cytokine release.
Study protocol
Clinical, demographic, laboratory, and radiological findings were recorded in a timely manner in patients’ files during follow-up. After inclusion in the study, follow-up cardiac magnetic resonance (CMR) imaging was performed at baseline (2 weeks) and 6 months after the index event. The assessment of inflammatory markers was conducted at baseline (first day) and 2 weeks (14 days) after the index event. Serum and plasma were stored at –80°C until assayed. After collecting serum specimens from the whole sample, parameters were measured using the same device in the same session and by the same laboratory staff in the Tissue Typing Laboratory and Genetic Diagnosis Center of a participating hospital.
Laboratory parameters
Venous blood samples were taken at first admission and analyzed for complete blood count (CBC), lipid, and cardiac biomarkers. Collected blood samples were centrifuged at 1500 rpm for 10 min in order to measure the determined parameters. CBC parameters were measured with a Sysmex XN-1000 hematology analyzer (Sysmex Corporation, Kobe, Japan). Hemoglobin was measured photometrically. Total cholesterol was determined by the homogeneous enzymatic colorimetric method with a Hitachi Modular P800 autoanalyzer (Roche Diagnostics Corp., Indianapolis, IN, USA). Low-density lipoprotein (LDL) was calculated according to the Friedewald method [25].
Blood samples were collected and assayed in duplicate. Serum samples were thawed on ice and concentrations of the cytokines IL-12 (p40) and MMP-2 were analyzed according to the manufacturer’s instructions for the utilized bead-based multiplex immunoassay system (171-AL001M, Bio-Plex Pro Human Inflammation Panel 1, 37-Plex, Bio-Rad Laboratories, Hercules, CA, USA). The formation of different sandwich immunocomplexes on distinct bead sets was measured and quantified using the Bio-Plex MAGPIX System (Bio-Rad Laboratories). The final concentration of analytes was calculated using the Bio-Plex Manager v5.0 software package (Bio-Rad). For all statistical analyses, values below the detection threshold of the assay were replaced with the minimum detectable value for the analyte. The assay’s working ranges as reflected by the lower (LLOQ) and upper limit of quantification (ULOQ) were as follows: 5.5 and 12039.9 pg/ml for IL-12p40, 6.3 and 13694.9 pg/ml for IFN-γ, and 1224.5 and 297540.2 pg/ml for MMP-2. The assay sensitivity (limit of detection) was as follows: 5.6 pg/ml for IL-12p40, 0.05 pg/ml for IFN-γ, and 39.0 pg/ml for MMP-2. The coefficients of variation between tests for all inflammatory markers were < 15%.
Cardiac magnetic resonance imaging
All CMR studies were performed with a 3-T scanner (MAGNETOM Skyra, Siemens Medical Systems, Erlangen, Germany). The imaging protocol included the acquisition of 4- and 2-chamber views and cine short-axis sections from the base to the apex of the heart (slice thickness of 6 mm at 10-mm intervals). The indices of left ventricular (LV) systolic function were assessed using retrospective electrocardiogram-gated turbo-fast low-angle shot (turbo-FLASH) sequences with the following settings: echo time (TE) 1.42 ms, repetition time (TR) 39 ms, flip angle 57°, voxel size 1.67 × 1.67 × 6 mm. Cardiac function and volumes were measured using syngo.via imaging software (Siemens). LV end-diastolic and end-systolic volumes (LV EDV, LV ESV) were calculated with short-axis-based planimetry from basal to apical level. Stroke volume was calculated as LV EDV minus LV ESV, and ejection fraction (EF) was calculated as follows: EF = [(LV EDV – LV ESV)/LV EDV] × 100.
RR was defined according to the reduction of LV EDV by ≥ 12% at 6 months after MI, while a 12% increase was defined as AR [26, 27].
Statistical analysis
The sample size of this prospective study was calculated based on a review of the literature prior to patient recruitment. According to this review, in previous studies, the incidence of AR was reported to be between 30% and 58% in patients with STEMI [28, 29]. Based on these studies, the estimated AR rate was accepted as 30% and the formula for estimating sample size for observational or cross-sectional research studies was applied. This formula is as follows: 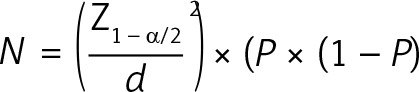 [30]. Here, Z1 – α/2 = the critical value and standard value for the corresponding level of confidence at the 95% confidence interval (CI) or 5% level of significance (type-I error), which is 1.96; P = the expected prevalence based on previous research; q = 1 – p; and d = margin of error or precision. The sample size was determined as at least 40 patients based on an α value of 0.05, a margin of error of 15%, and a drop-out probability of 10% [30].
The STATA program (StataCorp LLC, College Station, TX, USA) was used for data analysis. Normality testing was performed with the Shapiro-Wilk test. Data with normal distributions were shown as mean ± standard deviation and those with non-normal distributions as median (interquartile range: 25th–75th percentiles). Categorical variables were expressed as numbers and percentages. Student’s t-test or the Mann-Whitney U test was used to compare numerical variables between the AR and RR groups. Chi-square, Yates correction, and Fisher exact χ2 tests were used for comparisons of categorical data. The relationships between numerical variables were evaluated by Pearson and Spearman correlation analysis. Changes of IL-12p40, IFN-γ, and MMP-2 levels at 2 weeks compared to the first day were evaluated by repeated-measures ANOVA. The contributions of inflammatory markers to AR were evaluated by logistic regression analysis and presented with odds ratios (ORs) and 95% CIs. Variables with p-values of less than 0.25 (i.e., potential risk factors) were included in the multivariable logistic regression models [31]. In addition, confounder factors such as demographic parameters (age, gender, comorbidities), clinical parameters (blood pressure, time from symptoms to balloon, infarct location), and CMR parameters (cardiac output, infarct size) were included in the multivariable regression models because these parameters may play roles in LV function [32, 33]. Values of p < 0.05 (*) were considered significant in statistical analysis.
Results
In this study, 294 consecutive patients with STEMI referred for pPCI (mean age: 60.5 ±14.3 years, 15.6% female) were evaluated. Of these, 171 patients were excluded (mechanical complications (n = 6), cardiogenic shock (n = 12), need for hemodynamic support (n = 18), previous history of MI (n = 58), right coronary artery occlusion (n = 25), systemic inflammatory or autoimmune disease (n = 17), history of chronic corticosteroid or anti-inflammatory drug use (n = 12), pregnant or had given birth or been breastfeeding in the last 90 days (n = 5), CABG decision (n = 18)), 12 withdrew their consent to participate, 36 were lost to CMR imaging (contraindications (n = 9), refused or were incapable of completing CMR (n = 20), in-hospital death (n = 7)), and 24 were lost to follow-up or did not undergo the second session of CMR (could not be contacted or logistical reasons (n = 12), refused or were incapable of completing CMR (n = 4), re-infarction or died (n = 8)).
A total of 51 patients who were successfully treated with pPCI and entered the second session of CMR imaging were included in the study. The mean age at admission was 55.6 ±6.9 years and the patients were mostly men (n = 45) with a representative risk profile for cardiovascular disease. Approximately 70% of patients had anterior MI. In all the remaining patients, the infarct-related artery was Cx. At 6 months after MI, 20 (39%) patients exhibited AR. Eight patients had less than 12% change in LV EDV and were excluded from the analysis for RR assessment. The median cTn-I (57.1 vs. 44.3 µg/l, respectively; p < 0.001), mean neutrophil count (9.4 ±1.8 vs. 8.0 ±2.0 × 10⁹/l, respectively; p = 0.013), and median hs-CRP (29.7 vs. 24.2 mg/l, respectively; p = 0.008) baseline values were higher in the AR group compared to the RR group. There were no significant differences in the baseline demographic data and other laboratory findings between the AR and RR groups (Table I).
Table I
Baseline demographic, clinical and laboratory findings
| Variables | All population n = 43 | Adverse remodeling n = 20 | Reverse remodeling n = 23 | P-value |
|---|---|---|---|---|
| Demographic findings: | ||||
| Age [years] | 55.6 ±7.0 | 54.5 ±6.2 | 56.5 ±7.6 | 0.351 |
| Male gender, n (%) | 38 (88.4) | 17 (85.0) | 21 (91.3) | 0.868 |
| BMI [kg/m2] | 26.8 ±4.3 | 27.0 ±3.6 | 26.6 ±4.8 | 0.754 |
| Current smoking, n (%) | 20 (46.5) | 11 (55.0) | 9 (39.1) | 0.366 |
| Hypertension, n (%) | 18 (41.9) | 9 (45.0) | 9 (39.1) | 0.763 |
| Diabetes mellitus, n (%) | 12 (27.9) | 6 (30.0) | 6 (26.1) | 0.999 |
| Dyslipidemia, n (%) | 19 (44.2) | 10 (50.0) | 9 (39.1) | 0.547 |
| Clinical findings: | ||||
| Heart rate [bpm] | 72.9 ±11.3 | 73.8 ±7.8 | 72.1 ±13.8 | 0.637 |
| SBP [mm Hg] | 124.3 ±14.2 | 121 ±9.5 | 127.3 ±17.0 | 0.151 |
| DBP [mm Hg] | 78.4 ±12.9 | 76.5 ±9.5 | 80.0 ±15.3 | 0.370 |
| Door to balloon time [min] | 43.2 ±8.7 | 41.9 ±8.1 | 44.3 ±9.3 | 0.373 |
| Symptom to balloon time [min] | 310.6 ±70.7 | 302.4 ±66.2 | 317.7 ±75.1 | 0.483 |
| Anterior MI, n (%) | 30 (69.8) | 14 (70.0) | 16 (69.6) | 0.999 |
| Number of stents | 1 (1–2) | 1 (1–2) | 1 (1–2) | 0.386 |
| Laboratory findings: | ||||
| cTn-I [ng/l] | 48.0 (41.3–57.3) | 57.1 (51.2–59.7) | 44.3 (34.4–47) | < 0.001* |
| Glucose [mg/dl] | 104.8 ±23.1 | 108.9 ±23.6 | 101.2 ±22.5 | 0.279 |
| Hemoglobin [g/dl] | 13.6 ±1.4 | 13.8 ±1.6 | 13.4 ±1.2 | 0.378 |
| WBC [× 109/l] | 11.3 ±2.6 | 11.6 ±2.8 | 11.1 ±2.5 | 0.551 |
| Neutrophils [× 109/l] | 8.7 ±1.9 | 9.4 ±1.8 | 8.0 ±2.0 | 0.013* |
| Lymphocytes [× 109/l] | 2.3 ±0.7 | 2.1 ±0.6 | 2.5 ±0.7 | 0.022* |
| Monocytes [× 109/l] | 0.8 ±0.1 | 0.8 ±0.1 | 0.8 ±0.2 | 0.695 |
| Platelets [× 109/l] | 330.8 ±35.2 | 341.9 ±34.8 | 321.1 ±33.3 | 0.072 |
| Total cholesterol [mg/dl] | 184.0 (147.0–210.0) | 172.5 (153.0–223.5) | 187.0 (110.0–210.0) | 0.770 |
| LDL [mg/dl] | 114.0 (93.0–140.0) | 117 (99.0–144.5) | 111.0 (58.0–132.0) | 0.233 |
| HDL [mg/dl] | 38.8 ±8.3 | 40.6 ±10.8 | 37.3 ±5.1 | 0.192 |
| Creatinine [mg/dl] | 1.0 ±0.2 | 1.0 ±0.2 | 1.0 ±0.2 | 0.798 |
| hs-CRP [mg/l] | 25.3 (17.0–35.6) | 29.7 (24.2–42.8) | 24.2 (16.0–25.8) | 0.007* |
| Discharge therapy, n (%): | ||||
| ACEi/ARB | 40 (93.0) | 19 (95.0) | 21 (91.3) | 0.999 |
| Beta-blockers | 38 (88.4) | 16 (80.0) | 19 (82.6) | 0.999 |
| Statins | 41 (95.3) | 19 (95.0) | 22 (95.7) | 0.999 |
Categorical variables are shown as number and percentages. Numerical variables with normal distribution are shown as mean ± SD, while numerical variables not showing normal distribution are shown as median (IQR).
ACE – angiotensin-converting enzyme inhibitors, ARB – angiotensin receptor blockers, BMI – body mass index, bpm – beats per minute, cTn-I – cardiac troponin I, DBP – diastolic blood pressure, EF – ejection fraction, HDL – high-density lipoprotein, hs-CRP – high-sensitivity C reactive protein, LDL – lowdensity lipoprotein, SBP – systolic blood pressure, WBC – white blood cells.
At 2 weeks after MI, the median infarct size was larger in the AR group compared to the RR group (20% vs. 14% of LV, respectively; p = 0.038), and there were no differences in the baseline values of other CMR imaging parameters. At 6 months after MI, the mean LV EF was lower in the AR group compared to the RR group (43.6 ±10.7% vs. 52.1 ±7.8%, respectively; p = 0.004), and the median LV EDV (179 vs. 135 ml, respectively; p < 0.001), median LV ESV (120 vs. 72 ml, respectively; p = 0.003), and median infarct size (15% vs. 9% of LV, respectively; p = 0.014) were higher in patients with AR (Table II).
Table II
Comparison of LV volume and function parameters between adverse and reverse remodeling groups at post-MI periods
| Variables | All population n = 43 | Adverse remodeling n = 20 | Reverse remodeling n = 23 | P-value |
|---|---|---|---|---|
| 2 weeks: | ||||
| LV EF (%) | 47.6 ±10.0 | 47.9 ±10.7 | 47.3 ±9.4 | 0.871 |
| LV EDV [ml] | 155.0 (135.0–180.0) | 153.0 (136.0–177.0) | 158.0 (133.0–180.0) | 0.733 |
| LV ESV [ml] | 93.0 (59.0–128.0) | 99.0 (58.0–131.0) | 84.0 (61.0–122.0) | 0.808 |
| Stroke volume [ml] | 73.9 ±14.0 | 78.1 ±16.7 | 70.3 ±10.2 | 0.078 |
| Cardiac output [ml/min] | 4.7 ±1.1 | 5.0 ±1.3 | 4.5 ±0.8 | 0.150 |
| Infarct size, % of LV | 17.0 (12.0–23.0) | 20.0 (14.5–28.0) | 14.0 (10.0–22.0) | 0.038* |
| 6 months: | ||||
| LV EF (%) | 48.1 ±10.1 | 43.6 ±10.7 | 52.1 ±7.8 | 0.004* |
| LV EDV [ml] | 158.0 (133.0–190.0) | 179.0 (159.0–210.0) | 135.0 (128.0–153.0) | < 0.001* |
| LV ESV [ml] | 79.0 (62.0–132.0) | 120.0 (71.0–159.0) | 72.0 (58.0–94.0) | 0.003* |
| Stroke volume [ml] | 74.8 ±14.2 | 74.0 ±17.4 | 75.4 ±11.2 | 0.745 |
| Cardiac output [ml/min] | 4.8 ±1.2 | 4.6 ±1.6 | 4.9 ±0.7 | 0.411 |
| Infarct size, % of LV | 12.0 (8.0–17.0) | 15.0 (10.0–21.5) | 9.0 (6.0–14.0) | 0.014* |
The mean IL-12p40 (59.1 ±14.5 vs. 46.7 ±9.1 pg/ml, respectively; p = 0.001), median IFN-γ (20.4 vs. 16.2 pg/ml, respectively; p = 0.048), and median MMP-2 (33866.7 vs. 20691.1 pg/ml, respectively; p = 0.011) baseline levels were higher in the AR group compared to the RR group. At 2 weeks, the median IL-12p40 level (37.8 ±19.3 vs. 45.5 ±13.0 pg/ml, respectively; p = 0.002) was lower in the AR group (Table III).
Table III
Distribution of inflammatory markers in adverse and reverse remodeling
| Variables | Adverse remodeling n = 20 | Reverse remodeling n =23 | P1 | ΔP |
|---|---|---|---|---|
| IL-12p40 [pq/ml]: | ||||
| First day | 59.1 ±14.5 | 46.7 ±9.1 | 0.001* | < 0.001* |
| 2 weeks | 37.8 ±19.3 | 45.5 ±13.0 | 0.037* | |
| P2 | 0.001* | 0.773 | ||
| IFN-γ [pq/ml]: | ||||
| First day | 20.4 (16.2–24.2) | 16.2 (13.3–21.7) | 0.048* | 0.458 |
| 2 weeks | 23.3 (15.5–31.0) | 19.3 (13.7–30.8) | 0.237 | |
| P2 | 0.313 | 0.146 | ||
| MMP-2 [pq/ml]: | ||||
| First day | 33866.7 (19769.8–61938.8) | 20691.1 (13678.2–29486.3) | 0.011* | 0.087 |
| 2 weeks | 32930.3 (21035.7–51418.8) | 25700.8 (14649.0–44461.3) | 0.422 | |
| P2 | 0.601 | 0.114 |
Numerical variables with normal distribution are shown as mean ± SD, while numerical variables not showing normal distribution are shown as median (IQR).
p1 – Comparison of baseline and follow-up results (adverse vs. reverse remodeling). p2 – Baseline vs. follow-up in adverse and reverse remodeling. Δp – Comparison of the changes in the follow-ups (adverse vs. reverse remodeling). IFN-γ – interferon γ, IL – interleukin, MMP – matrix metalloproteinase.
In the AR group, IL-12p40 levels were significantly decreased at 2 weeks compared to the first day after MI (p < 0.001), while there was no significant change in the RR group. IFN-γ and MMP-2 values showed no significant change at 2 weeks compared to the first day after MI in both groups (Table III).
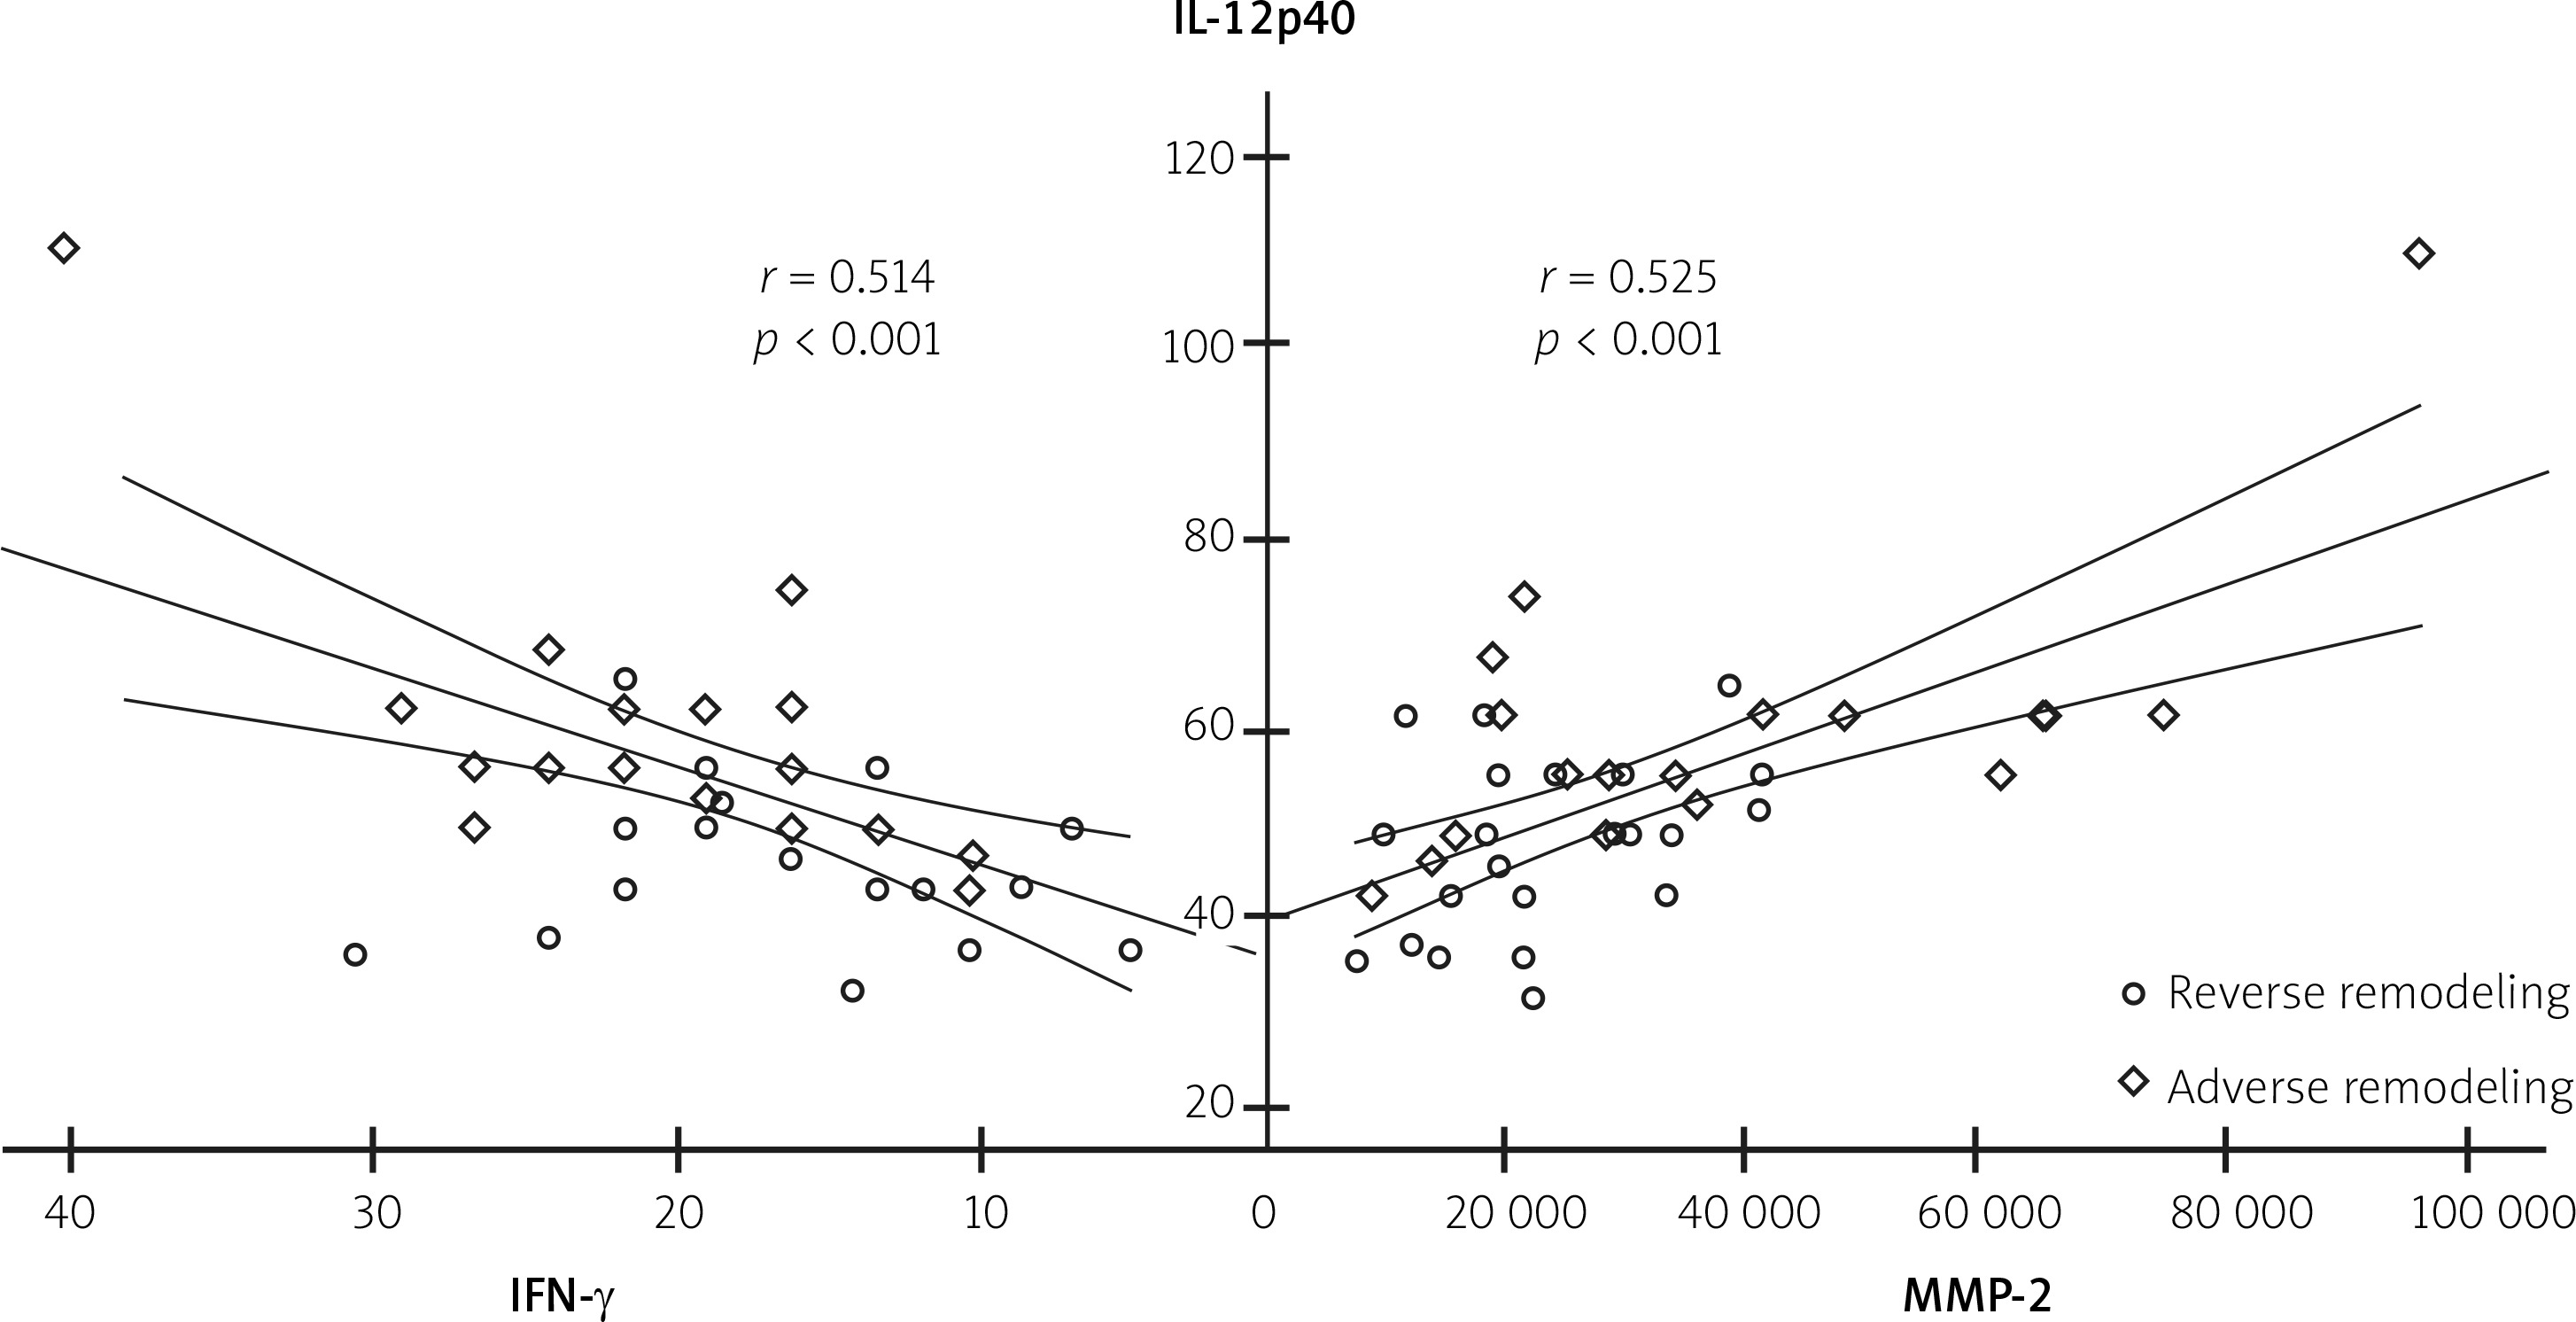
On the first day after MI, IL-12p40 levels were positively correlated with IFN-γ and MMP-2 levels (r = 0.514, p < 0.001 and r = 0.525, p < 0.001, respectively) (Figure 1). In addition, IL-12p40, IFN-γ, and MMP-2 levels were positively correlated with cTn-I, hs-CRP, and infarct size (Table IV).
Table IV
Relationship between cytokine levels and clinical, demographic and CMR parameters
| Variables | IL-12p40 | IFN-γ | MMP-2 | |||
|---|---|---|---|---|---|---|
| r | p | r | p | r | p | |
| IFN-γ | 0.514 | < 0.001* | – | – | – | – |
| MMP-2 | 0.525 | < 0.001* | 0.416 | 0.006* | – | – |
| Age | –0.076 | 0.627 | 0.140 | 0.371 | –0.037 | 0.814 |
| BMI | 0.043 | 0.784 | –0.029 | 0.852 | 0.045 | 0.776 |
| Heart rate | 0.131 | 0.401 | 0.046 | 0.771 | –0.129 | 0.410 |
| SBP | –0.110 | 0.483 | 0.172 | 0.270 | –0.053 | 0.735 |
| DBP | 0.012 | 0.941 | –0.069 | 0.659 | –0.218 | 0.160 |
| DBT | –0.067 | 0.670 | –0.245 | 0.113 | –0.079 | 0.616 |
| SBT | 0.042 | 0.787 | 0.213 | 0.170 | 0.122 | 0.436 |
| cTn-I | 0.417 | 0.005* | 0.524 | < 0.001* | 0.467 | 0.002* |
| Glucose | –0.081 | 0.605 | 0.074 | 0.638 | 0.273 | 0.114 |
| Hemoglobin | 0.147 | 0.346 | 0.001 | 0.993 | 0.139 | 0.376 |
| WBC | 0.053 | 0.736 | 0.213 | 0.171 | 0.107 | 0.495 |
| Neutrophils | 0.224 | 0.148 | 0.229 | 0.140 | 0.265 | 0.086 |
| Lymphocytes | –0.095 | 0.544 | 0.058 | 0.710 | –0.189 | 0.224 |
| Monocytes | –0.088 | 0.574 | –0.010 | 0.947 | 0.162 | 0.299 |
| Platelets | 0.169 | 0.277 | 0.110 | 0.481 | –0.123 | 0.431 |
| Total cholesterol | –0.079 | 0.613 | 0.068 | 0.666 | 0.060 | 0.701 |
| LDL | 0.005 | 0.975 | 0.218 | 0.161 | 0.144 | 0.356 |
| HDL | –0.126 | 0.422 | –0.039 | 0.803 | –0.073 | 0.640 |
| Creatinine | 0.187 | 0.230 | 0.252 | 0.102 | 0.031 | 0.842 |
| hs-CRP | 0.541 | < 0.001* | 0.457 | 0.002* | 0.364 | 0.047* |
| LVEF (%) | 0.145 | 0.353 | 0.205 | 0.146 | 0.206 | 0.186 |
| LV EDV | 0.517 | < 0.001* | 0.395 | 0.009* | 0.391 | 0.044* |
| LV ESV | 0.386 | 0.045* | 0.441 | 0.003* | 0.315 | 0.088 |
| Infarct size, % of LV | 0.527 | < 0.001* | 0.412 | 0.011* | 0.388 | 0.048* |
BMI – body mass index, cTn-I – cardiac troponin I, DBP – diastolic blood pressure, EF – ejection fraction, HDL – high-density lipoprotein, hs-CRP – high-sensitivity C reactive protein, IFN-γ – interferon γ, IL – interleukin, LDL – low-density lipoprotein, LV – left ventricular, EF – ejection fraction, EDV – end-diastolic volume, ESV – end-systolic volume, MMP – matrix metalloproteinase, SBP – systolic blood pressure, WBC – white blood cells.
The contributions of IL-12p40, IFN-γ, and MMP-2 to AR were evaluated by univariable regression analysis and multivariable models (Table V). Model I included the baseline levels of inflammatory markers and demonstrated 1.14-fold higher odds of AR for each unit increase in IL-12p40 (OR = 1.14, 95% CI: 1.03–1.27, p = 0.014) and 1.08-fold higher odds for an increase of 100 pg/ml in MMP-2 (OR = 1.08, 95% CI: 1.01–1.16, p = 0.035). Model II included the changes in inflammatory marker levels from baseline to 2 weeks after MI and demonstrated 1.12-fold (1/0.89) higher odds of AR for each 1% decrease in IL-12p40 levels (OR = 0.89; 95% CI: 0.82–0.97, p = 0.005).
Table V
Independent inflammatory markers associated with adverse remodeling
| Cytokines | Univariable analyses | Multivariable analyses | |||||
|---|---|---|---|---|---|---|---|
| OR | 95% CI | P-value | OR | 95% CI | P-value | ||
| Lower–upper | Lower–upper | ||||||
| Model I | IL-12p40 | 1.13 | 1.04–1.24 | 0.005* | 1.14 | 1.03–1.27 | 0.010* |
| IFN-γ | 1.12 | 1.02–1.25 | 0.050* | 1.01 | 0.87–1.18 | 0.917 | |
| MMP-2 | 1.06 | 1.01–1.11 | 0.014* | 1.08 | 1.01–1.16 | 0.035* | |
| Nagelkerke R2 = 0.52; p < 0.001* | |||||||
| Model II | IL-12p40 | 0.96 | 0.94–0.98 | 0.004* | 0.89 | 0.82–0.97 | 0.005* |
| IFN-γ | 1.02 | 0.97–1.08 | 0.084 | 1.01 | 0.98–1.04 | 0.126 | |
| MMP-2 | 1.01 | 0.98–1.05 | 0.168 | 1.00 | 0.89–1.11 | 0.973 | |
| Nagelkerke R2 = 0.64; p < 0.001* | |||||||
Model I was created to assess the contribution of post-MI baseline levels. Model II was created to assess the contribution of changes in inflammatory marker levels from baseline to 2 weeks after MI. The values of baseline MMP-2 were divided by 100. In the multiple regression analysis models, the effects of potential risk factors (p < 0.25) and confounding factors were adjusted.
Discussion
The main findings of this study were as follows: First, baseline levels of IL-12p40, IFN-γ, and MMP-2 were higher in patients with AR. Second, levels of IL-12p40, IFN-γ, and MMP-2 were stable over 2 weeks of follow-up for RR patients, while a significant decrease in IL-12p40 levels was detected for AR patients. Third, positive correlations were found between IL-12p40, IFN-γ, and MMP-2 and cTn-I, hs-CRP, and infarct size on the first day after MI. Fourth, IL-12p40 was independently associated with AR both at baseline and during follow-up.
The incidence of AR after STEMI varies between 30% and 58% [28, 29, 34]. Variations in this incidence range may be due to differences in the definitions of AR and RR in the literature. On echocardiography, AR and RR are respectively evaluated as an increase or decrease in LV EDV of at least 15–20% between baseline and follow-up [35, 36]. In CMR imaging, recommended as the gold standard, the criteria are increases of 10–20% in LV EDV and LV ESV [26, 27, 37]. However, 12% is recommended as a common threshold value of change for both LV EDV and LV ESV levels in defining AR and RR [27]. A systematic review of CMR studies involving patients with STEMI reported that cardiac remodeling was often defined by LV EDV [38]. In addition, an increase of 10% in LV EDV has been shown to predict major adverse cardiovascular events better than the change in LV ESV [26]. In light of these findings, the definitions of AR and RR in this study were based on a 12% change in LV EDV. However, the timing of the assessment of LV volumes is still a matter of debate. The time point of 2 weeks that we used falls outside of the early stage of the acute phase of MI (i.e., within 7 days) and may not fully reflect acute ischemic injury. However, the predominant pathological change in the acute phase of MI lasts up to 40 days [39]. Furthermore, serial CMR imaging after STEMI showed that LV volumes remained stable during the first month and that LV volumes changed significantly at 3 months, leading to a significant difference in LV EF appearing between 1 and 3 months [40]. A study using a porcine infarct model provided further insight by showing that histopathological evidence of obstructed capillaries filled with necrotic debris can be seen at 2 weeks but the infarct is replaced by extensive collagen deposition and fibrosis at 6 weeks [41]. Hence, we planned the present study considering that pathological findings related to infarct or ischemia appear at 2 weeks after MI.
In the post-MI period, there is a significant increase in the level of inflammation as an outcome of ischemic damage. An increase in pro-inflammatory cytokine levels such as IL-12 is expected due to the inflammatory response. We found that an increase in the IL-12p40 baseline level following MI is an important marker for AR. A previous study of STEMI patients showed that IL-12 may be a candidate prognostic marker if measured 10–14 days after symptom onset [42]. In addition, we found positive correlations between levels of IL-12p40 and cTn-I, CRP, and infarct size, which may be related to the severity of inflammation. In a study of MI patients treated with PCI, higher CRP levels were found in patients who developed AR. In addition, the levels of lactate dehydrogenase and adrenomedullin, which are secreted during tissue damage and in inflammatory reactions in the inflammatory state, were found to increase [34]. Moderate inflammation facilitates cardiac healing, while excessive inflammation causes AR [43]. Consistent with this hypothesis, excessive IL-12p40 upregulation may be one of the possible mechanisms of AR. A more moderate release of IL-12p40 appears to be associated with RR. In a study of MI-induced mice, Yan et al. [14] demonstrated that IL-12p40 increased gradually following MI, reached a peak at 7 days, and decreased at 2 weeks. In our study, IL-12p40 levels were decreased in AR patients at 2 weeks after MI but did not change in RR patients. These findings are consistent with the first mechanism. Furthermore, Yan et al. [14] found that IL-23, which is associated with the p40 subunit of IL-12, is involved in AR by upregulating IL-17A. On the other hand, in a study conducted in mice, the anti-IL-12p40 antibody was administered to inhibit Th1 and Th17 to prevent acute cardiac allograft rejection. It was found that the survival of the cardiac allograft was significantly prolonged in these mice. This was thought to be related to the decreased infiltration of inflammatory cells and downregulation of Th1- and Th17-specific transcription factors and cytokines [44]. This hypothesis may be supported by the reduction of chronic cardiac allograft rejection in patients administered the anti-IL-12p40 antibody [45]. Secondly, p40 promotes stabilization and regulation of p35 [46]. A previous experimental study demonstrated that IL-12p35 deletion is associated with lower rates of cardiac injury and greater cardiac healing [13]. Higher levels of the IL-27 heterodimer cytokine, which is associated with IL-12p35/p40, during acute coronary syndrome are independently associated with deterioration in cardiac function and worse long-term prognosis [47]. However, the p35 molecule was not examined in our study to support that hypothesis. Thirdly, IL-12 is a potent inducer of IFN-γ [48], and, consistent with that, we found a positive correlation between IL-12p40 and IFN-γ. Overexpression of IFN-γ may cause impaired cardiac structure and functions via action on the JACK/STAT, MAP kinase, MDA-9, and PKC pathways [49]. Previous studies have shown the roles of different STAT pathways and NF-κB activation in IL-12-mediated transcriptional regulation of MMPs [50, 51].
MMPs are important components in elucidating the mechanism of tissue damage in the post-MI period and they begin to increase within hours after the onset of inflammation [1]. A detailed analysis of biomarkers associated with LV function after acute coronary syndrome showed that MMPs do not have a significant effect on LV EF in the acute phase, but they are important biomarkers at 1 year of follow-up [52]. MMP-2 is activated during ischemia/reperfusion and expressed by the injured myocardium, which may cause deterioration in the structures of many intracellular proteins and heart structure and functions, thus leading to myocardial dysfunction and, in the long term, to heart failure [53]. Furthermore, MMP-2 causes degradation of intercellular proteins such as troponin-I, titin, α-actin, and myosin light chain outside of the extracellular matrix [54]. We found that elevated MMP-2 baseline levels were an important marker of AR and they remained high until 2 weeks after MI. In another study, MMP levels were reported to remain high until 3 weeks after MI [54]. In the subacute phase of STEMI, a positive correlation between MMP-2 and infarct size [55] supports the idea of a hyper-inflammatory mechanism. In moderate inflammation, MMP-2 may be associated with cardiac recovery. Administration of MMP-2 inhibitor in a rat model of MI improved cardiac functions [54]. On the other hand, ILs can affect MMP regulation. In two different experimental studies, at 7 days after MI, MMP-8 was upregulated in p35-knockout (KO) mice [13], while MMP-1, MMP-3, and MMP-9 were downregulated in IL-23-KO and IL-17A-KO mice [14]. ILs interacting with p40 may have different effects on MMPs. In light of these findings, we suggest that neutrophil- or macrophage-mediated hyperinflammatory responses in the initial phase of MI might influence the development of AR.
Previous research demonstrated positive correlations between IL-12 levels and systolic and diastolic blood pressure [32]. In regression analysis, we tried to support our findings further by adjusting for the effects of some confounding factors, including blood pressure. However, there are some limitations of our study. First of all, since this study was conducted with a cross-sectional design, it can only suggest a relationship between the cytokines that we investigated and AR; it cannot establish causality. Secondly, we could not include a healthy control group in this study. Thirdly, most of the possible patients (n = 243) were not included in the study within the framework of the exclusion criteria. On the other hand, a global threshold value has not been defined for LV EDV and LV ESV in the determination of AR. Different thresholds for LV volumes may present a different relationship to term of the primary goals or outcomes of the studies. We included patients who showed at least a 12% decrease or increase in LV EDV at 6 months of follow-up. Thus, we aimed to evaluate patients whose cardiac improvement or worsening was evident. Therefore, we excluded 8 patients with no change or less than 12% change in LV EDV. Similarly, these patients had no change in LV ESV or a change of less than 12%. For this reason, we expected cardiac remodeling to become more evident in the later period (i.e., after 1 year of follow-up). Finally, the p35 molecule and other cytokines interacting with the p40 molecule were not investigated in this study. In order to more definitively state that IL-12p40 levels are involved in the mechanisms of MMP and the pathogenesis of AR, it is necessary to observe whether there is cardiac repair using anti-IL-12p40 antibodies in the post-MI period with prospective randomized controlled studies of larger patient populations.
Conclusions
In the initial phase of MI, higher release of proinflammatory cytokines was associated with increased MMP-2 levels. Elevated expression of IL-12 and MMP-2 had an independent association with the development of AR. Considering the correlation between baseline IL-12p40 and MMP-2 levels, high levels of IL-12p40 may play a role in inducing longer circulation of high MMP-2. MMP-2 levels remained high until 2 weeks after MI in patients with AR, while IL-12p40 levels were decreased. This may have been related to excessive inflammatory responses in the initial phase of MI.


