
Introduction
An ECG-gated acquisition (GATED-SPECT) is an integral part of myocardial perfusion scintigraphy. This technique allows assessment of regional contractility and systolic thickening of the left ventricular walls [1, 2]. Phase analysis of left ventricular contraction allows the evaluation of left ventricular contraction, which could be particularly useful in the selection of patients with significantly impaired left ventricular systolic function for CRT device implantation (cardiac resynchronization therapy – CRT).
Although the criteria for resynchronization therapy are restrictive and strictly defined, a significant percentage of patients, especially with ischemic cardiomyopathy, do not improve left ventricular systolic function and increase exercise tolerance [3]. Such patients are referred to as “non-responders”. Therefore new methods are being sought to enable proper selection of patients who receive benefit from the expensive treatment method which is CRT implantation.
Quantitative phase analysis of left ventricular dyssynchrony in the resting GATED-SPECT study may be such an auspicious method. It is believed that the greater the dyssynchrony of left ventricular contraction, the greater the benefits of CRT therapy that can be expected. In addition, assessment of myocardial viability and determining the location of the scar avoids implantation of the left ventricular lead into the post-infarction scar area, which can contribute to increasing the effectiveness of the method.
Assessment of myocardial viability
Percent segmental radiotracer uptake by the left ventricular muscle in relation to 100% uptake activity is used to assess myocardial viability in non-gated scintigraphy at rest. When the loss of activity of the radiotracer is less than 40%, the segment is considered as viable. For the partially viable segment, the loss of activity of the radiotracer is 40–50%. For the essentially non-viable segment, the loss of activity of the radiotracer is 50–60%, while for the definitely non-viable segment it is above 60%. A point scale can also be used to evaluate the myocardial viability. In the Cedars-Sinai Medical Center (QPS – Quantified Perfusion SPECT) software, the vital segment is assigned a point value of 1. Two points are assigned to a segment containing both viable and non-viable muscle, three points for a substantially non-viable segment, while four points clearly indicate a lack of muscle viability in the segment (Table I). Wall thickening on GATED-SPECT can also be considered as determination of viability. However, wall thickening is less reliable than the radiotracer uptake [4].
Table I
Segmental viability scales
| Segmental viability | Point scale | Loss of activity of the radiotracer |
|---|---|---|
| Viable | 1 | < 40 |
| Viable and non-viable muscle within the segment | 2 | 40–50 |
| Essentially non-viable | 3 | 50–60 |
| Definitely non-viable | 4 | > 60 |
The assessment of left ventricular muscle viability is presented in the example of a patient with ischemic cardiomyopathy and multivessel coronary artery disease. Coronary angiography revealed: significant (≥ 50%) stenosis of the left main coronary artery, unobstructed without significant narrowing of the left anterior descending artery, patent but aneurysm in the proximal segment of circumflex branch, obtuse marginal branches occlusions, and occlusion of the right coronary artery with retrograde filling from the left coronary artery (Figures 1–4).
Figure 1
Assessment of left ventricular myocardial viability in patient A. Lack of viability of the inferior and lateral wall of the left ventricle and preserved viability of the anterior wall, septum and apex in the resting myocardial perfusion SPECT examination with attenuation correction. The polar map divided into 17 segments. The examination was performed in the Laboratory of Nuclear Medicine of the Silesian Center for Heart Diseases in Zabrze (Cedars-Sinai Medical Center software; QPS – Quantified Perfusion SPECT)
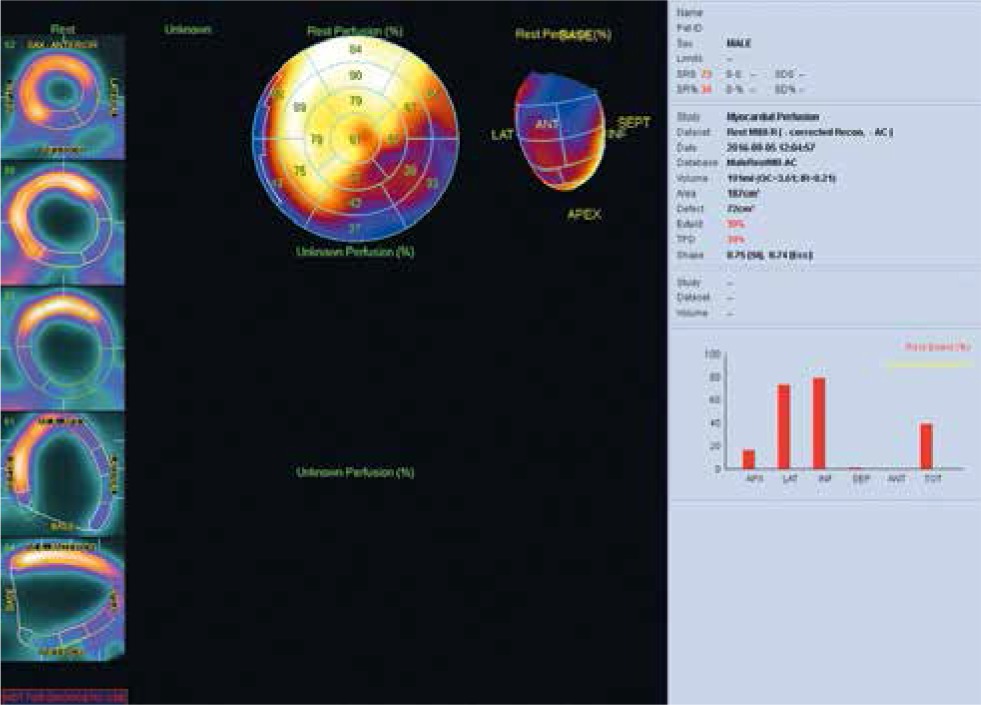
Figure 2
Lack of perfusion in patient A. The same patient as in Figure 1. The figure shows the extent of perfusion defects in the resting myocardial perfusion SPECT study with attenuation correction. Polar map division based on arteries. The perfusion deficits correspond to the right coronary artery and the circumflex branch. The examination was performed in the Laboratory of Nuclear Medicine of the Silesian Center for Heart Diseases in Zabrze (Cedars-Sinai Medical Center software; QPS – Quantified Perfusion SPECT)
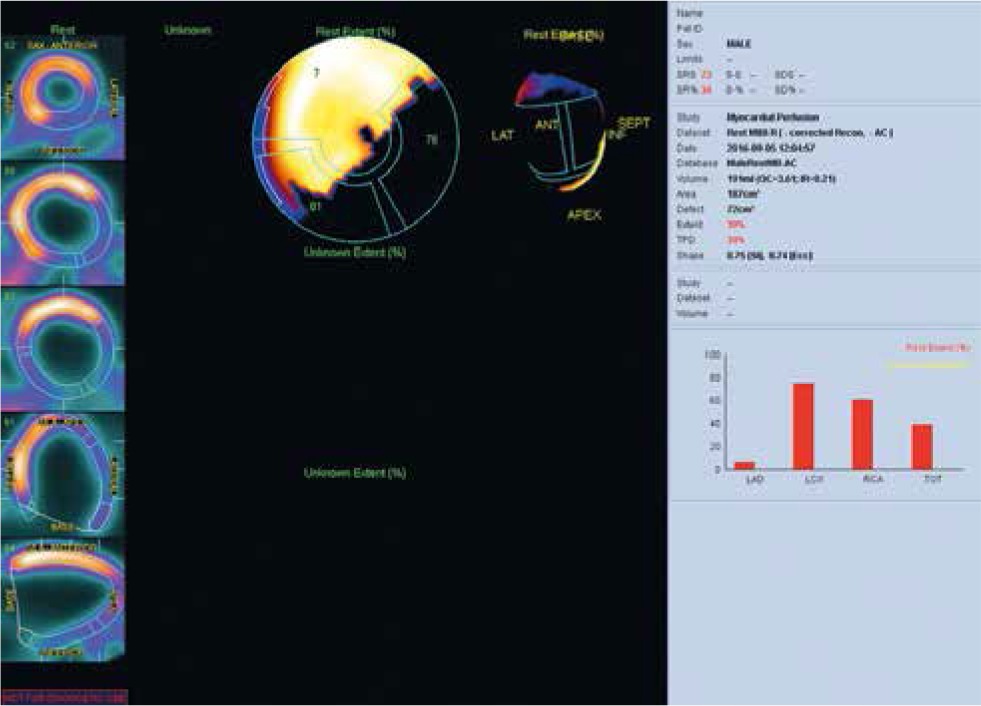
Figure 3
Point assessment of myocardial viability in patient A. The same patient as in Figures 1, 2. Rest myocardial perfusion SPECT examination with attenuation correction. The polar map divided into 17 segments. According to the point scale, all segments of the inferior and lateral wall were assigned a value of myocardial perfusion defects of 2 or 3 points, which means that there are no clear intermediate features of preserved muscle viability in this area. The assessment of muscle viability should also take into account the result of the left ventricular systolic thickening from GATED-SPECT imaging. The examination was performed in the Laboratory of Nuclear Medicine of the Silesian Center for Heart Diseases in Zabrze (Cedars-Sinai Medical Center software; QPS – Quantified Perfusion SPECT)
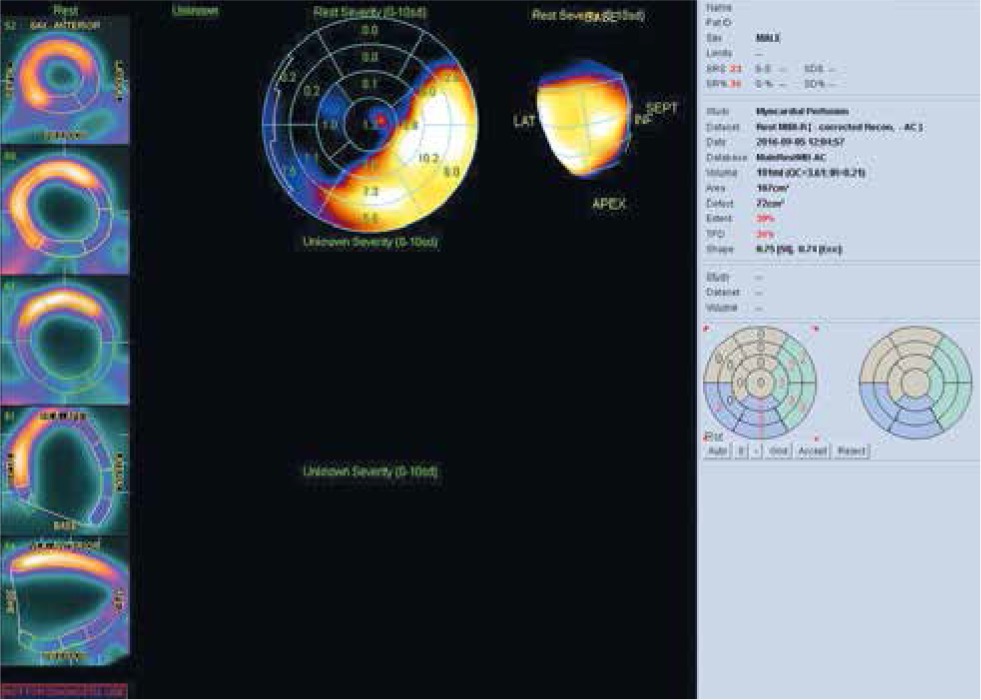
Figure 4
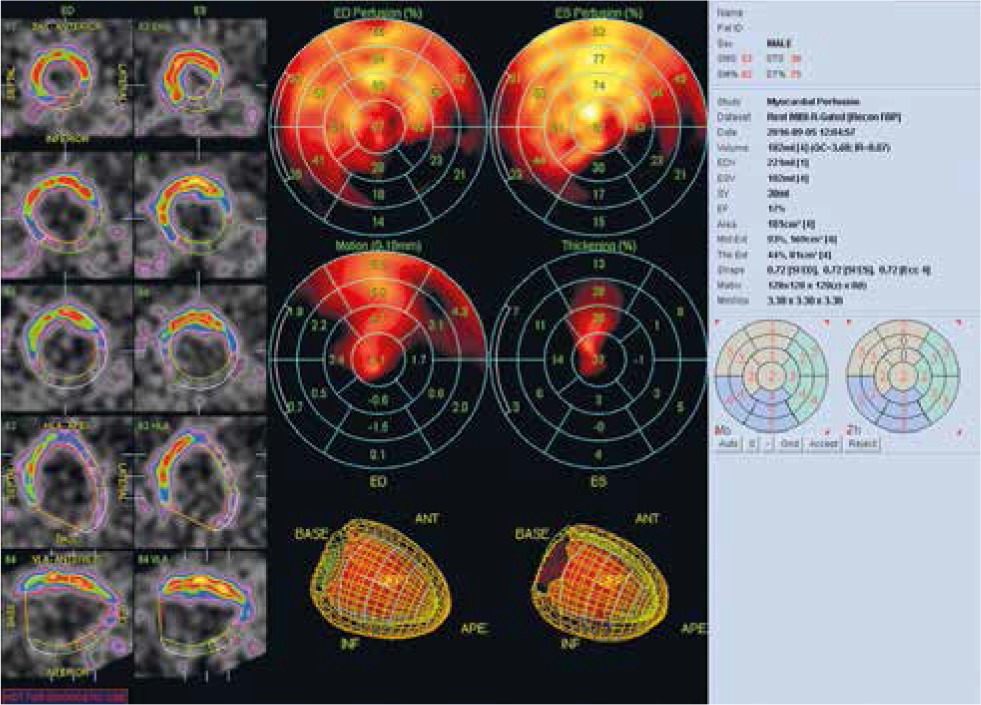
Contractility abnormalities and impaired thickening in patient A. The same patient as in Figures 1–3. In the GATEDSPECT resting examination, global contractility abnormalities and impaired systolic thickening of the left ventricle were observed. The polar map divided into 17 segments. Akinesis/dyskinesis of the inferior wall and hypokinesis/akinesis of the lateral wall and the lack of systolic thickness in these areas confirm the lack of myocardial viability in the right coronary artery and the circumflex branch territories. Contractility disorders in the anterior wall and septum as well as the apex with the absence of significant perfusion disorders in these areas indicate the presence of “myocardial hibernation” (significant stenosis of the left main coronary artery in coronary angiography). The examination was performed in the Laboratory of Nuclear Medicine of the Silesian Center for Heart Diseases in Zabrze (Cedars-Sinai Medical Center software; QGS – Quantified Gated SPECT)
Assessment of left ventricular mechanical dyssynchrony by phase analysis of gated-SPECT myocardial perfusion imaging
Fourier amplitude-phase analysis of the GATED-SPECT examination allows quantitative assessment of left ventricular dyssynchrony. The distribution of radioactivity for each spatial sampling point of the left ventricle is approximately a sinusoid with a specific phase and amplitude. Figure 5 presents the analysis of left ventricular dyssynchrony in a patient with significantly impaired left ventricular systolic function (left ventricular ejection fraction 17%) in the form of a phase-angle distribution of a polar map and a histogram.
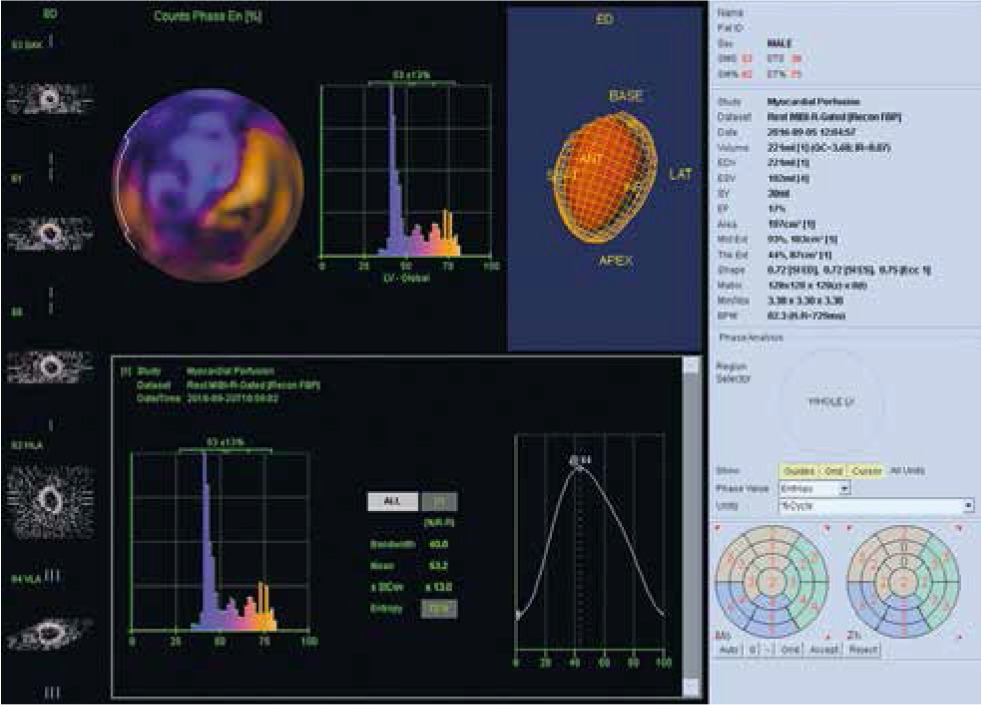
Figure 5
Assessment of left ventricular mechanical dyssynchrony. Significantly increased end-diastolic and end-systolic volumes of the left ventricle with a significant reduction in LV ejection fraction (about 17%). Phase analysis indicates a high degree of dyssynchrony of the contraction in the infero-lateral wall. PHB is 40°, PSD 13°, and Entropy 72%. The result of the study indicates that the patient is a good candidate for CRT implantation. The study was performed in the Laboratory of Nuclear Medicine of the Silesian Center for Heart Diseases in Zabrze (Cedars-Sinai Medical Center software; QGS – Quantified Gated SPECT)
PHB – phase histogram bandwidth, PSD – phase standard deviation.
For the measurement of the ventricular dyssynchrony, indexes such as the following are used: PHB (phase histogram bandwidth), i.e. a bandwidth histogram, which includes 95% of the elements of the phase histogram, and PSD (phase standard deviation), i.e. standard deviation of phase distribution, as well as the parameter determined in the software QGS as Entropy for the entire left ventricle or each segment, wall, vessel or coronary vessel group analyzed.
The PHB unit is degrees. The range of normal values for PHB in QGS software is 5° to 39° [5]. The higher the PHB value, the greater is the severity of left ventricular dyssynchrony. The PSD index is the standard deviation of phase distribution. It is also expressed in degrees. The PSD reference values in the QGS software are 0° to 11° [5]. The QGS software also provides an index called Entropy. This parameter determines the percentage of cardiac dyssynchrony. 0% is theoretically assigned to completely synchronized left ventricular contraction, while 100% is assigned to total asynchronous left ventricular contraction. In other words, the higher the Entropy rate, the more chaotic is the contraction of cardiomyocytes. In QGS, the valid Entropy range is 7–41% [5].
The synchronous contraction pattern is reflected by the homogeneous phase angle distribution of the polar map (bull eye); the histogram is narrow and has a large amplitude. When the dyssynchrony is higher, the PHB, PSD and Entropy indexes take higher values (Figure 5). It is worth noting that the PHB and PSD reference values for the QGS software are different than for the Emory Cardiac Toolbox software [6].
It should be noted that the assessment of cardiac dyssynchrony in the myocardial perfusion examination is not only used in the assessment of indications for CRT devices implantation, but is an important independent prognostic indicator of death from cardiovascular causes [7].
Assessment of dyssynchrony of left ventricle in candidates for resynchronization therapy and determination of the optimal left ventricular lead position
Resynchronization therapy reduces mortality and severity of heart failure symptoms in patients with ejection fraction below or equal to 35% and with prolonged QRS complex duration on the resting ECG [8–10]. Unfortunately, it has been shown that about a third of people meeting the criteria for CRT implantation do not respond to resynchronization therapy, which limits the usefulness and cost-effectiveness of this medical procedure [11–13].
There is more and more evidence that the assessment of contraction dyssynchrony from the GATED-SPECT examination may contribute to a better qualification of individuals for CRT therapy. A meta-analysis of 40 patients showed that those who responded favorably to resynchronization therapy had higher PHB and PSD values in the phase analysis from the GATED-SPECT examination compared to patients referred to as “non-responders”.
The optimal cut-off point which indicates the benefit from CRT is 72.5° for PHB and 19.6° for PSD in phase analysis in QGS software [12]. In another study, these parameters were for PHB 112°, PSD 21° and additionally for Entropy 52% respectively (data in QGS software) [13]. The optimal values of dyssynchrony parameters in relation to prognosis after CRT implantation are different for Emory Cardiac Toolbox software [14]. An example of phase analysis characteristic for non-responders is presented in Figure 6.
Figure 6
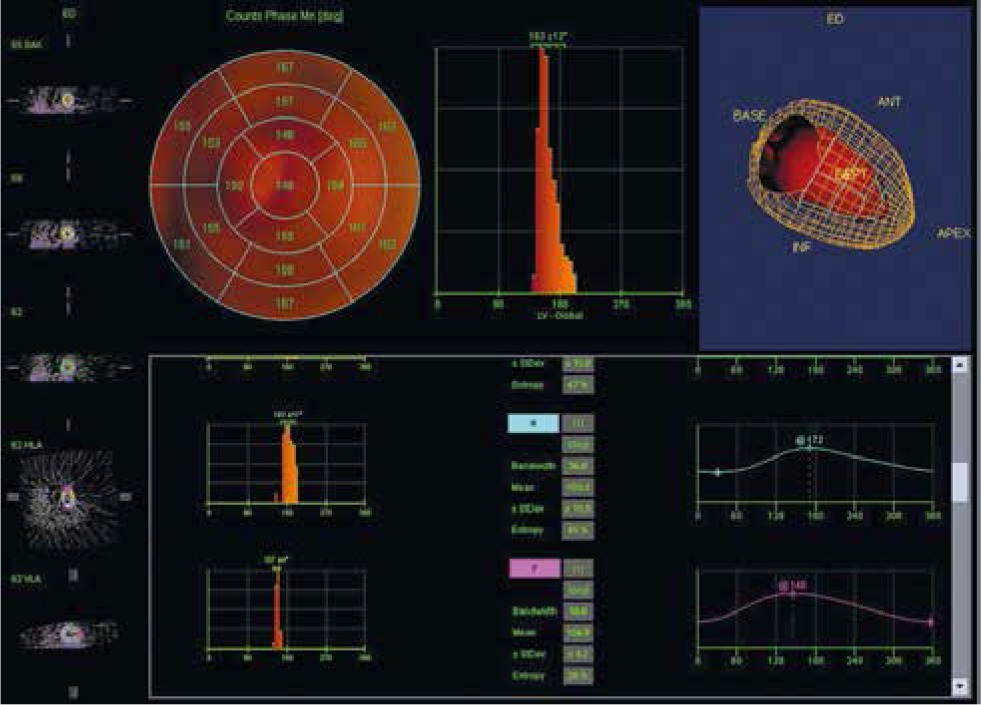
CRT non-responders phase analysis. An example of a patient without response to CRT. Bottom: segment 6 and 7 phase analysis. PHB, PSD and Entropy for segment 6 were 36°, 10.5° and 45%, respectively, for segment 7: 18°, 4.2° and 26% respectively. Patient with left bundle branch block and left ventricular ejection fraction below 35%. The study was performed in the Laboratory of Nuclear Medicine of the Silesian Center for Heart Diseases in Zabrze (Cedars-Sinai Medical Center software; QGS – Quantified Gated SPECT)
PHB – phase histogram bandwidth, PSD – phase standard deviation.
It is believed that patients with ischemic etiology will be less responsive to resynchronization therapy than patients with non-ischemic cardiomyopathy [15]. One study showed that in people with a perfusion defect during rest examination (post-infarction scar) assessed on a summed rest score scale (SRS) as at least 27 points, CRT implantation did not improve left ventricular function, whereas if the SRS was less than 27 points, it was related to benefits after CRT implantation [16].
Zhang et al. suggest that the best left ventricular (LV) lead position is the posterolateral wall, which is in accordance with the European Society of Cardiology (ESC) guidelines [3, 17, 18]. In addition, the ESC recommends that left ventricular lead placement may be targeted at the latest activated area [3]. The largest delay in mechanical contraction can be estimated by the phase analysis of GATED-SPECT examination (Figure 7).
Figure 7
Left ventricular activation map. The figure shows the map of left ventricular activation. In this example, the latest activation was located in the LV lateral wall region (mean phase 183°). The study was performed in the Laboratory of Nuclear Medicine of the Silesian Center for Heart Diseases in Zabrze (Cedars-Sinai Medical Center software; QGS – Quantified Gated SPECT)
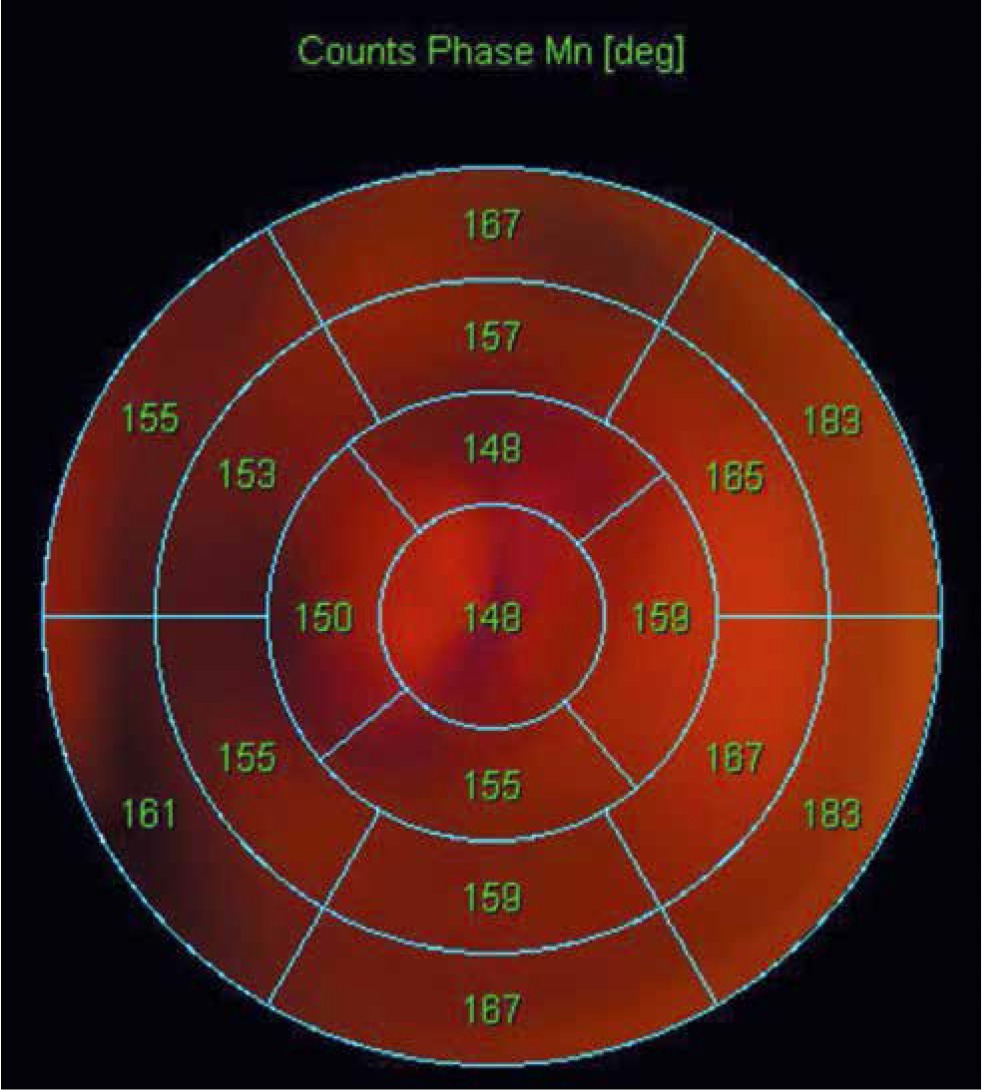
In patients with ischemic heart failure, scarred myocardium regions of the LV lead should be avoided (the loss of activity of the radiotracer above 60% – Table I) [18, 19]. In this case, the left ventricular lead should be positioned at the latest activated areas (Figure 7). But it should be remembered that in patients with ischemic cardiomyopathy, the latest activated areas are the myocardial scar and areas adjacent to the scar [20].
The phase analysis of the SPECT-GATED examination allows the identification of the latest left ventricular activation area, and the perfusion SPECT examination allows the assessment of myocardial viability. Therefore, SPECT examination allows one to identify the most optimal area for implantation of the left ventricular lead, which may improve the benefits of CRT therapy [21].
Conclusions
Fourier analysis of the GATED-SPECT examination may be useful for assessing left ventricular dyssynchrony and selection of patients with significantly impaired left ventricular systolic function who may benefit from resynchronization therapy. In addition, in patients with ischemic cardiomyopathy, phase analysis of the GATED-SPECT study and assessment of myocardial viability may contribute to optimizing the position of the left ventricular lead.