
Introduction
Over past years, radiotherapy has seen rapid progress of easily accessible high precision techniques of dose delivery. Steep dose gradients on the edge of the target volume, which characterise the dose distribution obtained by these techniques, require adequate accuracy in target and organs at risk (OARs) delineation and proper control of the dose delivery during the treatment [1]. Compared to computed tomography (CT), magnetic resonance (MR) imaging used during radiotherapy planning, aside from its advantage in quality of soft tissue regions’ visualisation, provides other necessary clinically useful information, such as physiological contrast imaging (diffusion-weighted, dynamic contrast-enhanced, or blood oxygenation level-dependent MR) [2]. Magnetic resonance spectroscopic imaging can improve tumour localisation both inside and outside the prostate [3]. Unfortunately, the necessity of MR-CT registration introduces intrinsic uncertainties related to different patient positioning and the gap between imaging sessions performed on two different and independent machines. Therefore, raising the MR-only imaging solutions for radiotherapy planning purposes seems rational [4, 5]. Nevertheless, using an MR-only solution for dose calculation requires the creation of additional images based on MR images that contain linear attenuation information and are called synthetic CT (sCT) [6].
There have been many attempts to clinically introduce the MR-only workflow for prostate cancer patients, many of them successful [7]. In this communication, we evaluate the MR-only imaging option implemented in our institution in the light of the accuracy of the patient positioning using intraprostatic fiducial markers (FM) and dedicated MR images series, and the accuracy of dose calculation using sCT generated with the Food and Drug Administration approved Philips MRCAT (Magnetic Resonance for Calculating ATtenuation) algorithm (Philips Healthcare, Amsterdam, Netherlands).
Materials and methods
Imaging data
Ten prostate cancer patients underwent dual simulation procedures to obtain CT and MR images. All patients were implanted in the prostate gland before radiotherapy with three FM (Gold Anchor GFMs, Naslund Medical AB, Huddinge, Sweden).
The computed tomography images were taken on a Somatom Definition AS (Siemens Medical Solutions, Erlangen, Germany) using a standard RT pelvic protocol (120 kV and 162 mAs). The all-in-one base plate with head support and knee cushion (Orfit Industries, Wijnegem, Belgium) was used for immobilization purposes for all patients. The patients were instructed to drink 500 ml of water half an hour before the CT procedure to appropriately fill the bladder and follow an easily digestible diet for the adequate filling of the rectum.
The magnetic resonance images were taken as soon as possible after CT (on average, 20 minutes) on an MR simulator (Philips Ingenia 1.5T, Philips Healthcare, Amsterdam, Netherlands) with the ExamCard, including three 3D imaging protocols for MRCAT software. Accordingly, these were T1W mDIXON FFE3D for electron density information to create synthetic images sCT, T2 TSE3D for organ delineation purposes, including the automatic organ delineation procedure, and T2/T1 b-FFE3D for fiducial marker visualization [8]. The MRCAT utilizes the largest possible field of view (FOV), which was 350 mm in the anterior-posterior (AP), 450 mm in the left-right (LR), and 300 mm in the feet-head (FH) direction. The reconstruction resolution was 1.04 mm in AP and LR and 2.50 mm in the FH direction. Patients were positioned directly on an indexed flat couch top integrated with Philips Ingenia MR replaceable and dedicated for MR-RT procedures with head support and knee cushion (Orfit Industries, Wijnegem, Belgium). The anterior coil was placed on a coil support as close as possible to the patient’s body without touching the body’s contours [9]. To position the patient in the reproducible and recognizable form for radiotherapy purposes, an external laser system (LAP GmbH Laser Applikationen, Lüneburg, Germany) was used, and the positioning point was marked using external MR visible skin markers. External lasers were calibrated to mark the magnetic field centre, and patient positioning took place with an automatic couch movement procedure.
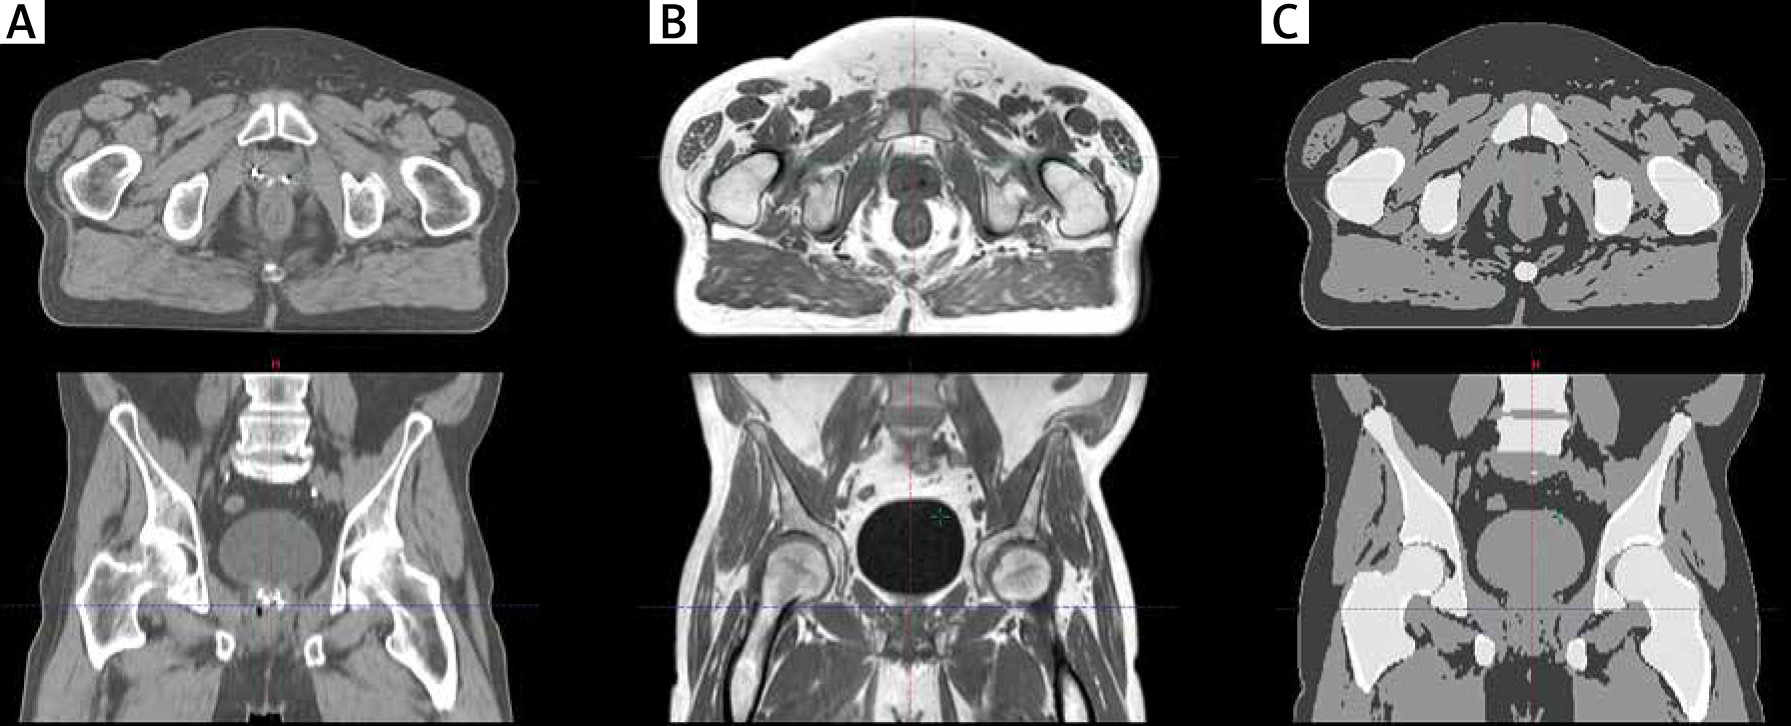
The Eclipse (Varian Medical Systems, Palo Alto, CA) treatment planning software (TPS) was used for dose planning. All calculations were done using an anisotropic analytical algorithm, which implies that input patient data must be expressed in CT units (Hounsfield units). The MRCAT algorithm creates sCT using a simple bulk density override class technique [6]. Accordingly, in the first step, the body outline was determined and everything outside it was recognized as air. In the next step, four tissues – fat, water-rich tissue, spongy bone, and compact bone – that are located inside the body outline were classified and densities were overridden. Before further processing, all MR sets of images were visually inspected, paying special attention to quality and continuity of body outline (sCT), continuity of organs, and/or motion-reconstruction artefacts (MRCAT source, sCT). Figure 1 shows the same anatomical region on, respectively, a conventional CT image, one of the three MR reconstructions obtained during the MRCAT procedure and the sCT image resulting from this procedure.
Accuracy of target and organs delineation
First, as the mainframe for other evaluations, rigid point-based registration using three FM (Rig_FM) was done between the compatible series of CT and MR images. We evaluated registration differences (i.e., fiducial registration error) [8]. Average and maximum values of disagreement between sets of markers visualized on CT and MR images were calculated. To assess these differences, two prostate contours were created separately on CT and MR imaging series (CTVCT and CTVMR). All delineations were done by one physician specializing in prostate radiotherapy (more than 10 years’ experience) and revised on the hospital daily board. The outlining strategy was based on ESTRO ACROP guidelines [10]. To compare differences of prostate contouring, the CTVMR images were transferred utilizing Rig_FM registration from the MR to CT images. The Dice similarity coefficient (DSC) [11] and volume difference between CTVCT and CTVRM were calculated.
Accuracy of the dose calculation
To eliminate registration uncertainties related to different voxel sizes, origin relative position, and DICOM coordinate system rotations [12, 13], the CT images and sCT images were exported from Eclipse TPS to 3D Slicer v. 4.11 open-source software [14]. Using this software, the CT images were resampled (and tagged as rCT) according to the resolution of the sCT images. After the resampling procedure, the rCT and sCT images were rigidly registered based on bony structures. In the next step, the sCT and rCT were imported back to the Eclipse TPS and re-matched directly using new image origins.
For every patient, X6MV volumetric modulated arc therapy plans with two full arcs up to a total dose of 70 Gy delivered in 28 fractions were optimized and calculated on sCT images (sCT plans) using only the planning target volume (PTV) structure and normal tissue objective in the photon optimizer in the Eclipse TPS. The sCT plans were copied using image origins and were recalculated on rCT images (rCT plans). In the Eclipse TPS, only the parts located in the body outlines are used for dose calculation. Therefore, to eliminate unwanted differences related to the patient body visualization on sCT and rCT, the outer body structure was copied from sCT to rCT and was used as the main body outline during the dose recalculation on rCT. It should be noted that a water HU was assigned to all resulting voids on the rCT (i.e., the parts covered by the body outline from sCT and not covered by an outline from rCT).
The doses obtained on sCT and rCT images were compared using both direct dose subtraction and the gamma method. Dose differences were evaluated by subtraction of the doses from the rCT plan from the doses from the sCT plan.
The scores of gamma passing rates (GPRs) were calculated using a combination of the parameters (i.e., distance to agreement [mm] and dose difference [%]) that were, respectively, 1 mm and 1%, and 2 mm and 2%. For both combinations, a 1% threshold of dose suppression was used. For dose differences analysis, we used a body with an extracted 10 mm surface.
Results
Registration differences between FM were smaller than 1 mm and the averaged difference from all measurements was equal to 0.5 mm with standard deviation of 0.2 mm.
The average DSC for CTV was 0.79 with 0.06 standard deviation. All CTVCT volumes were significantly bigger than those from CTVMR (p = 0.005). The average difference was 13.4 cc (44.2%) with standard deviation 6.5 cc (19.8%). Detailed analysis can be found in Table 1.
Table 1
Descriptive statistics for clinical target volumes delineated on magnetic resonance and computed tomography images
The GPRs were, on average, 0.970 with 0.007 standard deviation for 1 mm/1% and 0.990 with 0.004 for 2 mm/2%, respectively. The direct dose comparison shows that for 97.1% of the patient’s body, the differences were smaller than 0.1%. The maximum differences were noted in the peripheral parts of the patient’s body and did not exceed ±2% (Fig. 2). Dose intervals visible in Figure 1 (7 cGy – 0.1%, 35 cGy – 0.5%, and maximal is 140 cGy – 2%) were selected as a percentage against the total plan dose (7000 cGy).
Discussion
There are two main technical limitations of MR-only planning. First, with MRCAT, all MR imaging restrictions apply (e.g., exclude patients with metal implants). Secondly, due to internal algorithm restrictions, MRCAT cannot create sCT on patients with body outlines outside the FOV (i.e., partial sCT reconstruction is impossible). Knowledge of these limitations allows the simple exclusion of patients for whom MR-only planning is impossible, and the planning should be carried out based on the conventional way, using CT images.
In the first part of the study, we compared the quality of patient positioning using an MR simulator and standard CT. In our department, radiation technologists utilize a two-step registration process for patient positioning using onboard kV/CBCT imaging. First registration of the bone’s structure is performed, and as a secondary check, FM are manually detected on onboard images and compared with their positions on planning CT images. When using an MR scanner as a planning device, we need to evaluate both steps to detect possible additional uncertainties. The first part of registration is well recognized [15] and depends on geometrical properties of the MR series used for sCT creation. Proper initial MR scanner settings and dedicated quality assurance (QA) procedures ensure stability even for long time periods [16]. We have utilized a Philips 2D geometric QA phantom, which is a part of the commercial MRCAT solution, as a weekly test. Moreover, we have introduced a double check of all MR source images, paying attention to patient movement related distortions. In the second part of registration, due to the fact that FM are not visible on regular MR imaging, special series must be developed and acquired for marker detection. In the Maspero et al. study [17] different series were evaluated, and marker misdetection was identified as the main challenge for MR only workflow. In the MRCAT procedure, T2/T1 b-FFE3D series is used as marker detection series [18]. In our study we directly compared detected marker positions with CT. We did not find any problems in recognizing marker positions on MR series. Registration discrepancy below 1 mm is comparable with other studies utilizing digitally reconstructed radiographs (DRRs) or cone beam computed tomography (CBCT) images [19].
In the next part, we analysed the benefits of using the MR-only process. For differences in contouring quality, we compared prostate structures on CT alone with MR based contouring. Our results are like those reported in other studies [20, 21]. We observed significant (on average 44%) volume overestimation delineated on CT alone in relation to MR, which is associated with poor visibly in low contrast borders of structures (bladder-prostate, rectum-prostate, prostate-muscles) [22]. Moreover, our results as well as literature findings [23] confirm that in the case of utilizing two diagnostic machines (i.e., MR and CT) in a treatment planning process, proper CT-MR workflow allows errors connected to the transfer of the prostate contours from MR to CT to be reduced only to registration errors. These errors can be omitted when MR-only planning is used. Nevertheless, Maspero et al. [24] identified five factors that can influence differences in doses calculated using MR-only versus standard CT solutions. These are:
Set up and positioning differences are related to the ‘MR simulation’ process. We used all accessible MR dedicated solutions (coil holders, flat couch top, and laser positioning) to achieve a patient position most approximate to the one on the treatment couch. We observed body shape discrepancies between CT and MR images that were, in our opinion, mostly random and not related to using the MR solution. To minimize it, we used one body contour for both CT and MR calculations (MR contoured with differences filled with water HU);
MR-related geometric inaccuracy. MR-related inaccuracy was evaluated with FM registration errors and directly related to QA procedures [16];
The pseudo CT-generation process was done automatically without any user interaction;
For electron density conversion, we used the proposed vendor calibration curve [9];
To eliminate registration errors, we aligned spatial coordinates and related the CT image to the MR frame of reference.
In addition, we want to emphasize that patient preparation and time between MR and CT imaging is another important influential factor. Firstly, the MRCAT algorithm did not recognize air inside the body region. Bubbles of air occur on a standard basis inside the rectum in prostate patient cases. The source of this difference is random, but we minimize it by filling all air gaps with HU of water. The second aspect is focused on bladder filling, which is strictly related to bladder volume and dose in the upper part of the prostate. In our study the patients were prepared for CT (had drunk 500 ml of water) and then had as short a time gap between CT and MR as possible. Evaluation of doses for OARs is not part of this study and can be assigned to a different class of factors. To minimize the influence of such internal factors, at least for the prostate region, we used Rig_FM for registration and only PTV with a normal tissue objective for dose optimization.
According to Maspero et al. [24] factors 3 and 4 (listed above) are the most influential; therefore, we focused on possible dose differences related to them. Slight differences between our results of GPR analysis and those presented in other studies [13, 25] resulted from different regions where the dose was compared and/or method of analysis. In the Kemppainen et al. study [13] the results of GPR analysis were a little bit better than ours but were obtained only for PTV while our analysis was performed for the whole body. In the study by Bratova et al. [25] GPRs were on average lower than ours but, in contrast to our methodology, were obtained from sCT and CT without Rig_FM registration that was used in our study.
We also evaluated direct dose differences and can conclude that plans computed on sCT overestimate doses in relation to rCT, which agrees with results from other studies [24]. This overestimation relates to the conversion of electron densities and, in our opinion, needs further analysis and studies. We want to point out that, even though for CT imaging calibration curve evaluation is a straightforward exercise, it is not the case for sCT as there are no standard phantom-based solutions.
Conclusions
MR imaging allows for a more precise delineation of the prostate compared to CT imaging. Due to the usage of MR and CT images obtained from two different machines, the conventional workflow of plan preparation is burdened with FM registration error. An MR-only solution can eliminate this error. Nevertheless, an MR-only solution based on sCT images compared to conventional CT images simplifies patient anatomy for dose calculation. Our study shows that this simplification of anatomy does not affect the dose distribution, and the doses calculated on sCT are comparable with those calculated on conventional CT images.


