INTRODUCTION
Sustaining high performance during prolonged intermittent exercise requires efficient regulation of substrate utilization and energy supply. In sports like football, where matches last up to 90 or 120 minutes plus additional playing time, the balance between carbohydrate and fat metabolism may influence fatigue resistance and decision-making quality in critical late-game phases [1, 2]. Elite football imposes metabolic demands characterised by frequent high-intensity actions interspersed with prolonged periods of submaximal activity [3–5]. While decisive events are often preceded by intense actions such as sprints, accelerations, decelerations, and changes of direction [6, 7], 85–90% of match time is spent at low to moderate intensities where aerobic metabolism predominates [8]. During these periods, a greater capacity to oxidize fat may spare intramuscular glycogen and help delay fatigue and thereby sustain physical performance in the later stages of matches [1, 9, 10].
The concept of glycogen sparing through enhanced fat oxidation was established in the 1960s through foundational muscle biopsy studies [11, 12] and remains central to endurance exercise physiology [13–15]. While traditionally associated with continuous exercise, recent work suggests that fat oxidation may also support performance in intermittent sports like football [9, 16, 17].
Mechanistically, the decline in fat oxidation at higher exercise intensities is driven by both reduced fatty acid availability, impaired mitochondrial transport and a lower adenosine triphosphate (ATP) yield per oxygen when comparing fat to carbohydrate [18]. As intensity increases, adipose tissue blood flow decreases, limiting the mobilization of free fatty acids to the working muscles. Concurrently, intracellular factors such as carnitine depletion and exercise-induced acidosis inhibit the carnitine palmitoyltransferase I (CPT-I) enzyme, reducing the transport of long-chain fatty acids into the mitochondria [19]. Together, these limitations suppress the rate at which fatty acids can be oxidized, thereby shifting substrate reliance toward carbohydrate metabolism [20]. In football, where players alternate rapidly between intensities, those with low metabolic flexibility may experience higher glycogen depletion, impairing performance in the latter stages of matches [5, 8, 21]. This is particularly relevant given that depletion of intramyofibrillar glycogen has been linked to impaired sarcoplasmic reticulum calcium kinetics and reduced excitation-contraction coupling [22]. At a systemic level, increased concentrations of plasma free fatty acids and declining glycogen reserves have been documented during the final stages of football matches [1, 2, 10], suggesting that fat metabolism may play a critical role in maintaining physical capacity in the latter parts of matches.
Peak fat oxidation (PFO) and the relative exercise intensity at which it occurs (Fatmax) are gaining recognition as markers of metabolic flexibility [20]. PFO is modified by training, nutrition, and exercise modality [20], and football players have demonstrated some of the highest PFO values reported across athlete populations [9, 16, 17]. These findings challenge the assumption that fat metabolism is unimportant in football and suggest PFO may complement peak oxygen uptake (
Nevertheless, the independent contribution of PFO to match performance remains debated. In a pre-season football study, Rømer, Hansen [17] observed concurrent increases in both PFO and
Taken together, these findings highlight a need to better understand the functional role of fat oxidation in football performance. Although
MATERIALS AND METHODS
Design
A total of 58 professional male players from the Danish Superliga were recruited over three seasons (2021/22–2023/24). Players underwent a laboratory test battery, including whole-body dual-energy X-ray absorptiometry (DXA) scanning and a graded treadmill test to volitional exhaustion determine peak fat oxidation (PFO), Fatmax, and
TABLE 1
Anthropometrics and laboratory test results
Laboratory Testing Procedures
All laboratory assessments were conducted at a facility located near the football club. Participants were instructed to arrive in a fasted state. Actual fasting durations ranged from 4 to 13 hours, with a mean of 6 hours and 20 minutes. Moreover, players were instructed to refrain from strenuous physical activity (36 hours), caffeine and nutritional supplements (12 hours) hours prior to testing. Upon arrival, anthropometric measurements were recorded. Height was measured (Tanita Leicester Stadiometer), and body weight and composition were assessed while players wore minimal clothing using two methods: a multifrequency bioelectrical impedance analyser (InBody 270, Biospace, San Diego, CA) and dual-energy X-ray absorptiometry (DXA; Lunar iDXA, GE Healthcare, UK).
Treadmill test
After body composition assessments, participants were briefed on the exercise protocol. A graded treadmill test was used to determine peak fat oxidation (PFO) and Fatmax. Testing was conducted on a motorized treadmill (Woodway Pro XL, Woodway Inc., USA or Rodby RL2000E, Rodby, Sweden), with simultaneous measurements of pulmonary gas exchange rates using a mixing chamber system (Quark CPET, Cosmed, Rome, Italy).
The protocol was adapted from Rømer, Hansen [17]. In brief, gas and flow calibration were performed prior to testing. Participants were fitted with a heart rate monitor and a headgear system (Hans-Rudolph Inc., Kansas City, MO), which connected a rubber face mask to a two-way non-rebreathing valve and a hose transferring expired air to the mixing chamber. The protocol began with a 5-minute seated rest period, during which participants were instructed to breathe normally. This was followed by a 5-minute warm-up at 6 km/h and 1% incline. Subsequently, treadmill speed increased to 8 km/h for 3 minutes, and then by 2 km/h every 3 minutes while maintaining a 1% incline. The graded phase continued until a respiratory exchange ratio (RER) > 0.95 was reached, marking the transition from Fatmax to
During the
Pulmonary gas exchange and Data Analysis
Pulmonary gas exchange data were recorded in 10-second sampling intervals and processed as 30-second rolling averages using Omnia software (Cosmed, Rome, Italy). Fat oxidation rates (g/min) were calculated using the stoichiometric equation proposed by [24], under the assumption of negligible protein oxidation:
For each player, gas exchange data were manually reviewed. The average
Match analysis
Physical match performance data was extracted from the Second Spectrum platform in 1-min intervals. Physical match performance variables were calculated across the entire match. To evaluate withinmatch decrements variables were calculated per minute for two time periods: the last 30 minutes (60–90 min) relative to the first 60 minutes (0–60 min). The included variables were distance covered in total and within speed zones 0–7 km/h, 7–15 km/h, 15–20 km/h, 20–25 km/h, and > 25 km/h, as well as distance > 15 km/h and > 20 km/h. Number of runs > 20 km/h, 20–25 km/h and > 25 km/h were also collected, and number of accelerations (> 3 m/s2) and decelerations (< -3 m/s2) as well as top speed during match periods were assessed.
Statistical analysis
In cases where multiple matches were available within the timeframe surrounding the laboratory testing, the match with the highest highintensity distance (> 20 km/h) covered during the entire match was included in the statistical analysis.
Statistical analysis was performed in R Studio (ver. 2025.05.1 build 51. All data were checked for normal distribution using Shapiro-Wilk test. Normal distributed data were analysed using Correlations between physical test data and match performance changes were assessed using Pearson’s correlation coefficients for normally distributed data and Spearman’s for non-normally distributed data. Distance sprinting and Fatmax were in general not normally distributed, whereas number of accelerations were not normally distributed for changes within the match (table 3), whereas number of decelerations were not normally distributed for whole match data (table 4). A significance threshold of P < 0.05 was applied. Descriptive data are presented as means ± standard deviation.
RESULTS
Laboratory tests
Laboratory test results are presented in Table 1. In brief, PFO ranged 0.24 to 0.78 g/min, corresponding to 3.6 to 12.6 mg/min/kg fat-free mass. Fatmax occurred at 31 to 61 % of
Match performance
Match performance data for the entire match as well as changes in match performance in the last 30 min (60–90 min) relative to performance during the first 60 min (0–60 min) are presented in Table 2. Briefly, playing time varied from 87 to 104 minutes, during which players covered between 9,647 and 12,832 m. Of this, 1,789 to 3,644 m were performed at speeds > 15 km/h, and 455 to 1503 m > 20 km/h. The number of high-intensity runs (> 20 km/h) was 29 to 136, with 34 to 119 accelerations > 3 m/s2 and 56 to 139 decelerations a> 3 m/s2. Peak in-game running speed ranged from 26.9 to 34.7 km/h. When comparing performance in the final 30 minutes (60–90 min) with the first 60 minutes of match play, a general decline was observed across most physical performance variables (Table 2). These decrements included total distance, moderate and high-speed running, as well as number of high-intensity actions, accelerations and decelerations. In contrast, distance covered by sprinting as well as number of sprints showed large variability and, on average, increased relative to the first 60 minutes.
TABLE 2
Physical match performance during the entire match and performance in 60–90 min relative to 0–60 min
Correlations between laboratory tests variables and match performance metrics
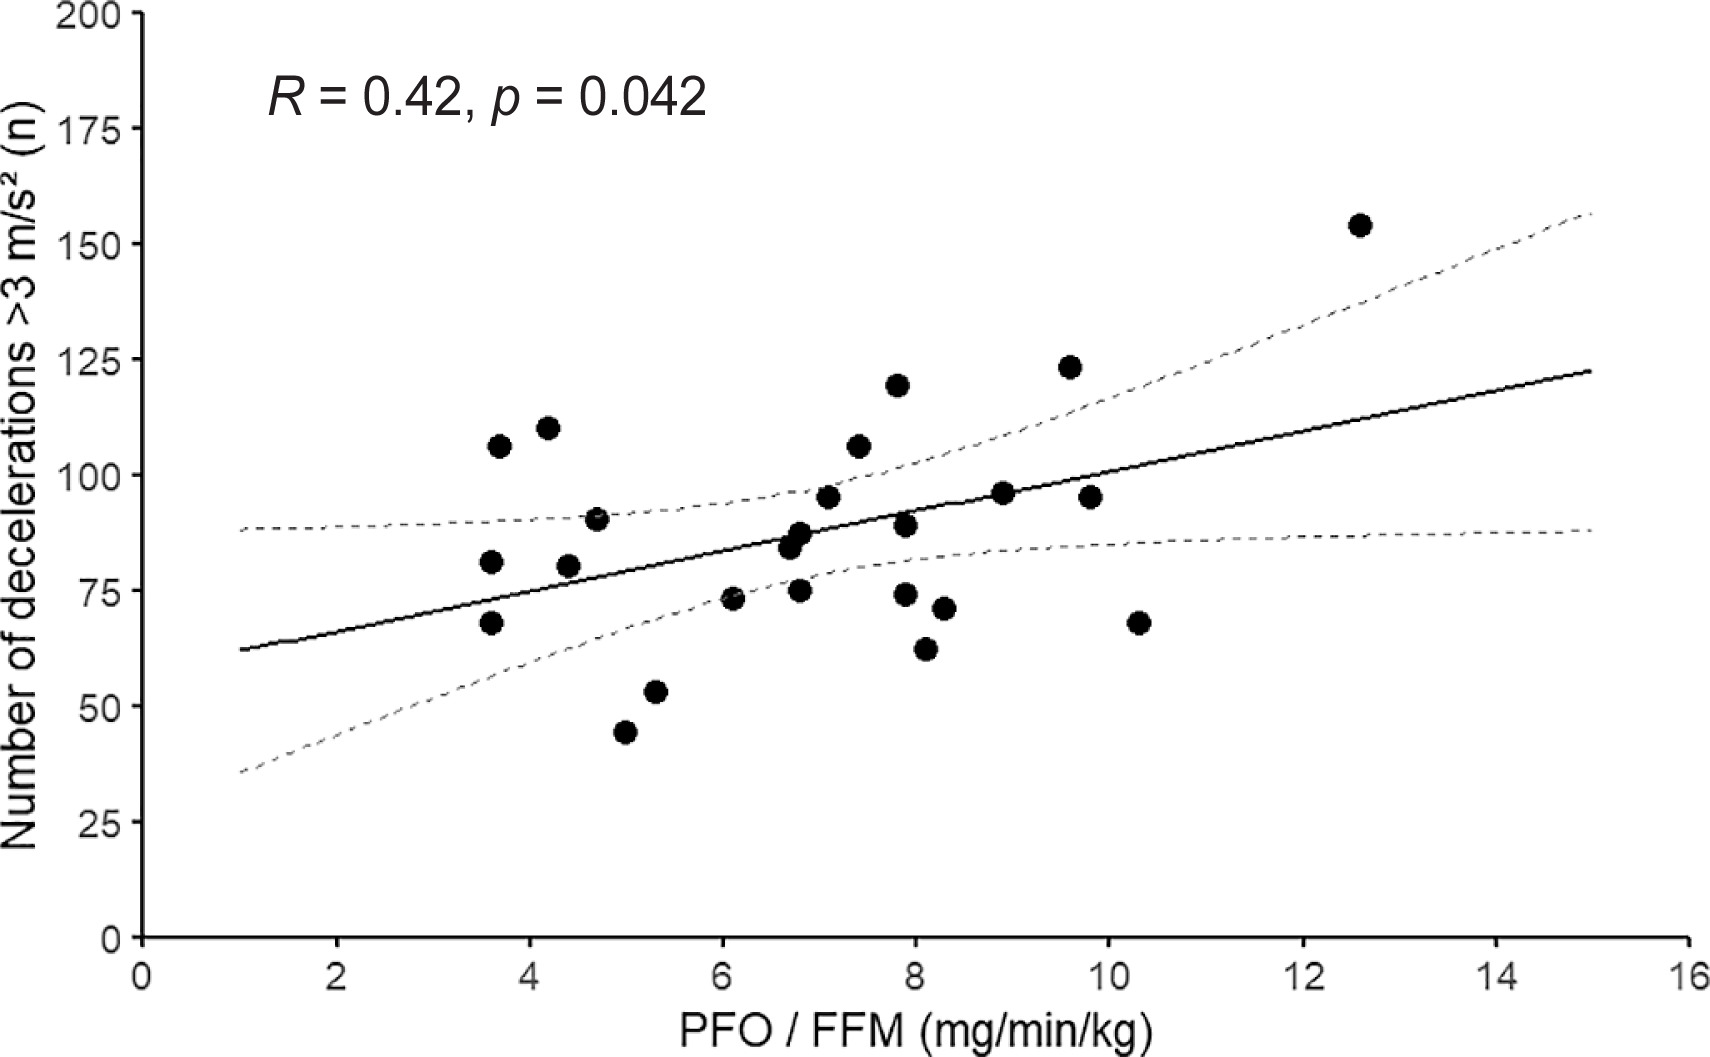
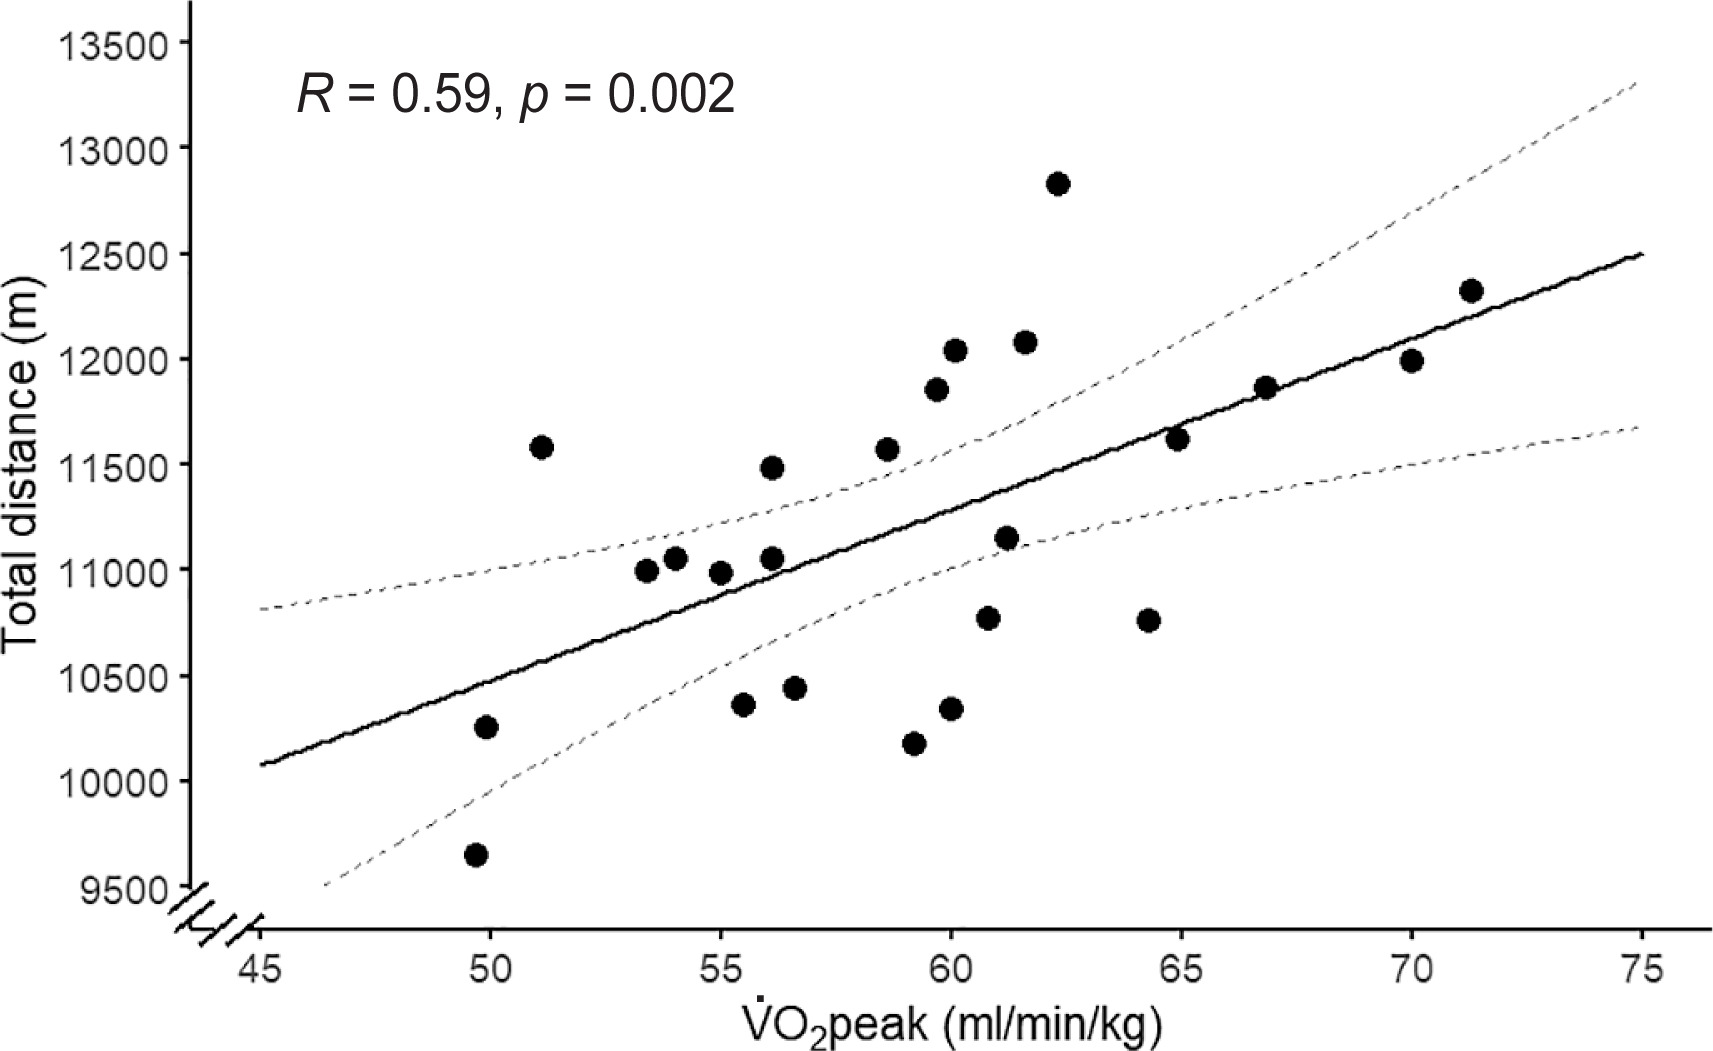
Correlations between laboratory test measures and match performance metrics are summarized in Tables 3 and 4. No significant associations were observed between PFO or Fatmax and any of the match performance metrics. However, PFO normalized to fat-free mass showed significant positive correlations with the ability to sustain the number of decelerations (r = 0.42, P = 0.042; Figure 1) in the final 30 minutes of match play. A similar trend was observed for absolute PFO, for which the number of accelerations also tended to be correlated, but these correlations did not reach statistical significance. Relative
TABLE 3
Correlations between laboratory tests variable and decrements in match performance.
[i] All data were checked for normality using Shapiro-Wilk’s test. Normal distributed data: Pearsson’s correlation (not underlined); Spearman’s correlation (underlined). Bold denotes significant correlations (P < 0.05). Italic denotes 0.10 > P > 0.05. PFO: Peak fat oxidation, FFM: Fat free mass,
TABLE 4
Correlations between laboratory tests variables and total match performance.
[i] All data were checked for normality using Shapiro-Wilk’s test. Normal distributed data: Pearsson’s correlation (not underlined); Spearman’s correlation (underlined). Bold denotes significant correlations (P < 0.05). Italic denotes 0.10 > P > 0.05. PFO: Peak fat oxidation, FFM: Fat free mass,
DISCUSSION
The present study examined the relationship between fat oxidation capacity and the ability to maintain physical performance during the final 30 minutes of football match play for elite male players. The main findings were threefold: a) fat oxidation capacity, when normalized to fat-free mass (PFO/FFM), was significantly negatively correlated with decrements in the number of decelerations in the final third of matches; b)
The observed association between PFO/FFM and preserved capacity to perform decelerations indicate that a greater reliance on fat metabolism may mitigate fatigue-induced declines in neuromuscular performance. Although football is characterized by repeated highintensity bursts, more than 85% of match play occurs at submaximal intensities where aerobic pathways dominate [1, 8, 25]. Efficient fat oxidation during these phases may spare intramyofibrillar glycogen, thereby attenuating fatigue-related impairments in excitation– contraction coupling [10, 22] and thereby sustaining the ability to perform explosive movements. The association was only significant when PFO was expressed relative to fat-free mass (Figure 1), underscoring the relevance of body composition when interpreting metabolic traits in athletic populations [16]. However, the associations tended (P = 0.053) to be significant also when PFO were expressed in absolute terms.
Fat oxidation capacity, PFO, PFO/FFM and Fatmax, in elite football players, has been shown to be among the highest across sports [16]. Fat oxidation capacity in our population of professional football players was however more modest (PFO: 0.48 g/min; PFO/FFM: 6.95 mg/min/kg; Fatmax: 43%) compared with previous studies in sub-elite [17] and professional football players [9].
Unlike studies by Rømer and colleagues [17] and Randell and collegues [9], who conducted the fat oxidation capacity tests during pre-season, our tests were conducted within the competitive season. PFO is sensitive to recent training volume and intensity and increases in response to moderate-intensity endurance training [26] and during pre-season football training [17]. Players may have been tested during periods of cumulative fatigue or reduced aerobic loading (e.g. due to competitive congestion or tapering), which could have reduced mitochondrial enzymatic activity and lipid oxidation capacity. Thus, the difference in training status may partly explain differences to previous studies. Moreover, club nutritionists and players may pay more attention to a high carbohydrate intake during the competitive season compared to pre-season, leading to a more carbohydrate rich diet, which also may lower PFO, even though players were tested after ~6 hours fast, beyond which the length of the fast has been shown to have little effect on fat oxidation [27]. Nevertheless, in accordance with previous studies we observed large inter-individual variability [9, 16, 17]. While the present study included professional players from a football club across three seasons, the absence of individuals with particularly high PFO-values (> 0.8 g/min) and only two players with PFO/FFM higher than 10 mg/min/kg contributed to lower means. Moreover, it is possible that the inclusion criteria (match data availability and playing time) introduced unintentional selection bias favouring a more homogeneous metabolic profile. The inter-individual variability reinforces the notion that contextualizing PFO to individual physiological profiles, including lean mass and match demands, is crucial when exploring its functional relevance. In line with this, no significant correlation was observed between
The current findings also contribute to the ongoing debate regarding the importance of
No laboratory-derived variable was associated with sprint distance, number of sprints, or top speed, neither across the full match nor in the final 30 minutes. These match performance metrics are highly linked to neuromuscular power and anaerobic capacity [1, 8, 30]. It is therefore unsurprising that neither fat oxidation nor
The lack of association between Fatmax and any match variable further suggests that the absolute capacity for fat oxidation, rather than the relative intensity at which it peaks, may be more relevant for maintaining performance capacity in the latter part of a match. Fatmax is known to vary substantially between individuals and is influenced by training background, nutrition, and testing protocol [20]. In contrast, PFO expressed relative to fat-free mass (PFO/FFM) may offer a more physiologically valid and comparable metric across athletes, as it reflects the fat oxidation capacity per unit of metabolically active tissue. This normalization reduces the influence of body size and may better represent underlying muscular oxidative adaptations [20].
From a practical perspective, the present findings offer a cautious support of the relevance of fat oxidation capacity as a supporting factor for late-game performance. Although significant, the associations between fat oxidation and match performance explained less than 18% of the variance, highlighting that fat oxidation capacity plays only a modest role relative to other determinants of performance. While the observed correlations were limited, the ability to maintain high-intensity actions such as decelerations may partly be supported by the glycogen sparring effect of increased fat oxidation capacity. Training strategies aimed at optimizing fat metabolism, including submaximal aerobic training or nutritional periodization, may enhance players’ ability to maintain performance. However, given the observed moderate effect sizes, few correlations, and marked inter-individual variation, implementation of such strategies should be guided by individual profiling. While metabolic flexibility may benefit fatigue resistance, it must be supported by a robust glycolytic system to meet the full range of demands met in elite football.
Several limitations must be acknowledged. First, while reasonable for elite sport settings, the sample size limits generalizability and may have reduced the power to detect smaller associations. Second, the time interval between laboratory testing and match performance varied, potentially introducing noise. Third, only one match per player was included, and tactical or positional influences were not statistically controlled. Match variability has been shown to be rather large especially for the higher speed zones and accelerations and decelerations [32–34], which may have impacted the possibility to detect relevant associations between laboratory test results and match performance metrics. Furthermore, positional differences in match activity profiles likely influence energy metabolism and substrate utilization during matches. Due to the modest sample size, we were not able to conduct reliable position-specific sub-analyses, which should be considered in future work. Likewise, the nutritional context before matches, particularly pre-match meals, albeit served at the same time and with the same content for all players, and carbohydrate availability, may have influenced substrate utilization and thereby the strength of associations between laboratory-derived fat oxidation capacity and in-game performance [35]. These contextual factors are inherent to studies in elite sport environments and should be acknowledged when interpreting the findings in the current study.
The present findings suggest that enhancing fat oxidation capacity relative to fat-free mass may help players sustain repeated deceleration efforts in the final stages of elite football matches. Conditioning programmes should therefore integrate aerobic training and nutritional periodization to improve metabolic flexibility, while also incorporating neuromuscular-focused training to maintain high-intensity performance under fatigue. Importantly, such strategies should be tailored to individual physiological profiles and supported by regular monitoring of metabolic characteristics.
CONCLUSIONS
In conclusion, the present findings support a modest but significant role for fat oxidation capacity in sustaining specific aspects of physical performance during male elite football matches, particularly in relation to repeated deceleration efforts late in games.