
Purpose
Skin surface brachytherapy had been applied as a treatment modality from the advent of brachytherapy. This technique have been evolving from manual placement of radium sources on the lesion surface to more complex afterloading devices with applicators adapted for individual patients. Dose distribution is very favorable due to a steep dose gradient, and cosmetic effects are more than satisfactory [1, 2].
On the other hand, in some cases, the process of treatment planning can be very challenging. Considering the significant curvature of some of treated regions, mainly the facial area, usage of standard applicators manufactured by vendors may not provide adequate dose distribution. Problems with applicator fixation can occur due to uneven surfaces. Occasionally, there is a need to place catheters in different interspace than standard 10 mm in generally available applicators, and standard applicators carry a risk of displacement due to lack of fixed position on various characteristic spots or regions on patient’s body.
It is possible to avoid the above-mentioned difficulties by introducing individual mould applicators, which have been used in many treated regions, including cavities and complicated skin surfaces. There are reports regarding applying this method using different techniques, i.e., dental impression and flexible thermoplastic materials. Their application requires a great deal of experience and high manual skills, which always depend on the applicator’s maker. Additionally, the location of pre-planned catheters may differ from those of produced applicator.
Nowadays, 3D printing is new technology that enables the transfer of virtual data to the physical world and avoids the difficulties associated with lack of manual skills. Due to possibility of preparing a digital design of necessary structure and fast manufacturing of required form using low-cost technology and materials, it is possible to apply this technique to produce individual skin surface brachytherapy applicators.
The aim of the study was to design and print applicators using a low-cost 3D printer and widely available PLA filament to verify feasibility of this method.
Material and methods
3D printer
MakerBot Replicator+ 3D printer was used to print the applicators for surface brachytherapy. The printer, equipped with a single 0.4 mm extrusion nozzle, works in fused deposition modeling (FDM) technology using a filament with a thickness of 1.75 mm, 11 microns of XY (horizontal) positioning precision, and 2.5 microns Z (vertical) positioning accuracy. The device was developed for fast and accurate prints. Working area is equal to 295 mm × 195 mm × 165 mm, and a print resolution of up to 100 microns can be achieved. MakerBot Replicator+ is equipped with a built-in camera, which allows observing the process on a screen of computer or phone.
PLA filament
Polylactic acid (PLA) filament is an aliphatic linear polyester obtained from natural resources, such as corn or sugar cane. Due to its biodegradability, biocompatibility, and non-toxicity, it is popular and ready-to-use in industry and complex biomedical applications [3].
PLA is one of the most common and easy to print materials, with low processing shrinkage properties. It is by far the most widely used printing material, and due to its thermoplastic decencies, it is suitable for 3D printing with FDM method. The recommended temperature of the nozzle is 175-235°C. Moreover, PLA is a material that allows for relatively fast printing, within a speed range of 60-80 mm/s. With this filament, transition from matte to satin finish is visible as the temperature increases and the printing speed slows down.
Anthropomorphic phantom
A female version of Alderson radiation therapy (ART) anthropomorphic phantom was used in the current research, which is the equivalent of a female body weighing 50 kg and a height of 155 cm. The phantom is cut horizontally into 2.5 cm thick slices. Each patch has holes plugged with bone, soft tissue, or lung tissue equivalents, which can be replaced with inserts for attaching thermoluminescent dosimeters (TLDs). In this study, radiochromic films were placed within the phantom slices at half irradiated length to measure dose distribution.
3D objects generating software Beben – DICOM to STL
A 3D model is a mathematical description of solid geometry or a set of solid geometries and their properties. The simplest form of a 3D model is a three-dimensional triangle mesh, which can be saved as a *.stl or *.obj wavefront file. Such a file can then be loaded into a computer program, which can be used to convert the designed model of a 3D object.
In commonly used treatment planning systems, objects are created in transverse layers of tomography, including organs at risk, clinical target volume (CTV) area, gross tumor volume (GTV), or boluses generated for preparing a treatment plan, called ‘contours’ that are flat closed polygons. Shapes of the above-mentioned structures create temporary 3D models in TPS system, permitting for spatial visualization. When an irradiation plan is prepared, the user has the impression of a three-dimensional object. However, the model is eventually reduced to a series of polygons in the tomography layers. This form is found in DICOM (digital imaging and communications in medicine) files that can be exported from a treatment planning system.
The purpose of creating the proprietary Beben – DICOM to STL program was to enable the preparation of 3D boluses designed in TPS for 3D printing. Therefore, the program allows loading DICOM RTStructure files containing a description of a 3D object specified in TPS. For printing the applicators, the program can load coordinates of the points marking the center of active dwell positions of the source, by importing the points from DICOM RTPlan file, in which the source dwell positions are stored. It enables generation of 3D models of applicator channels with a diameter of 3 mm around the polygonal chain in catheter position.
Design of the applicator
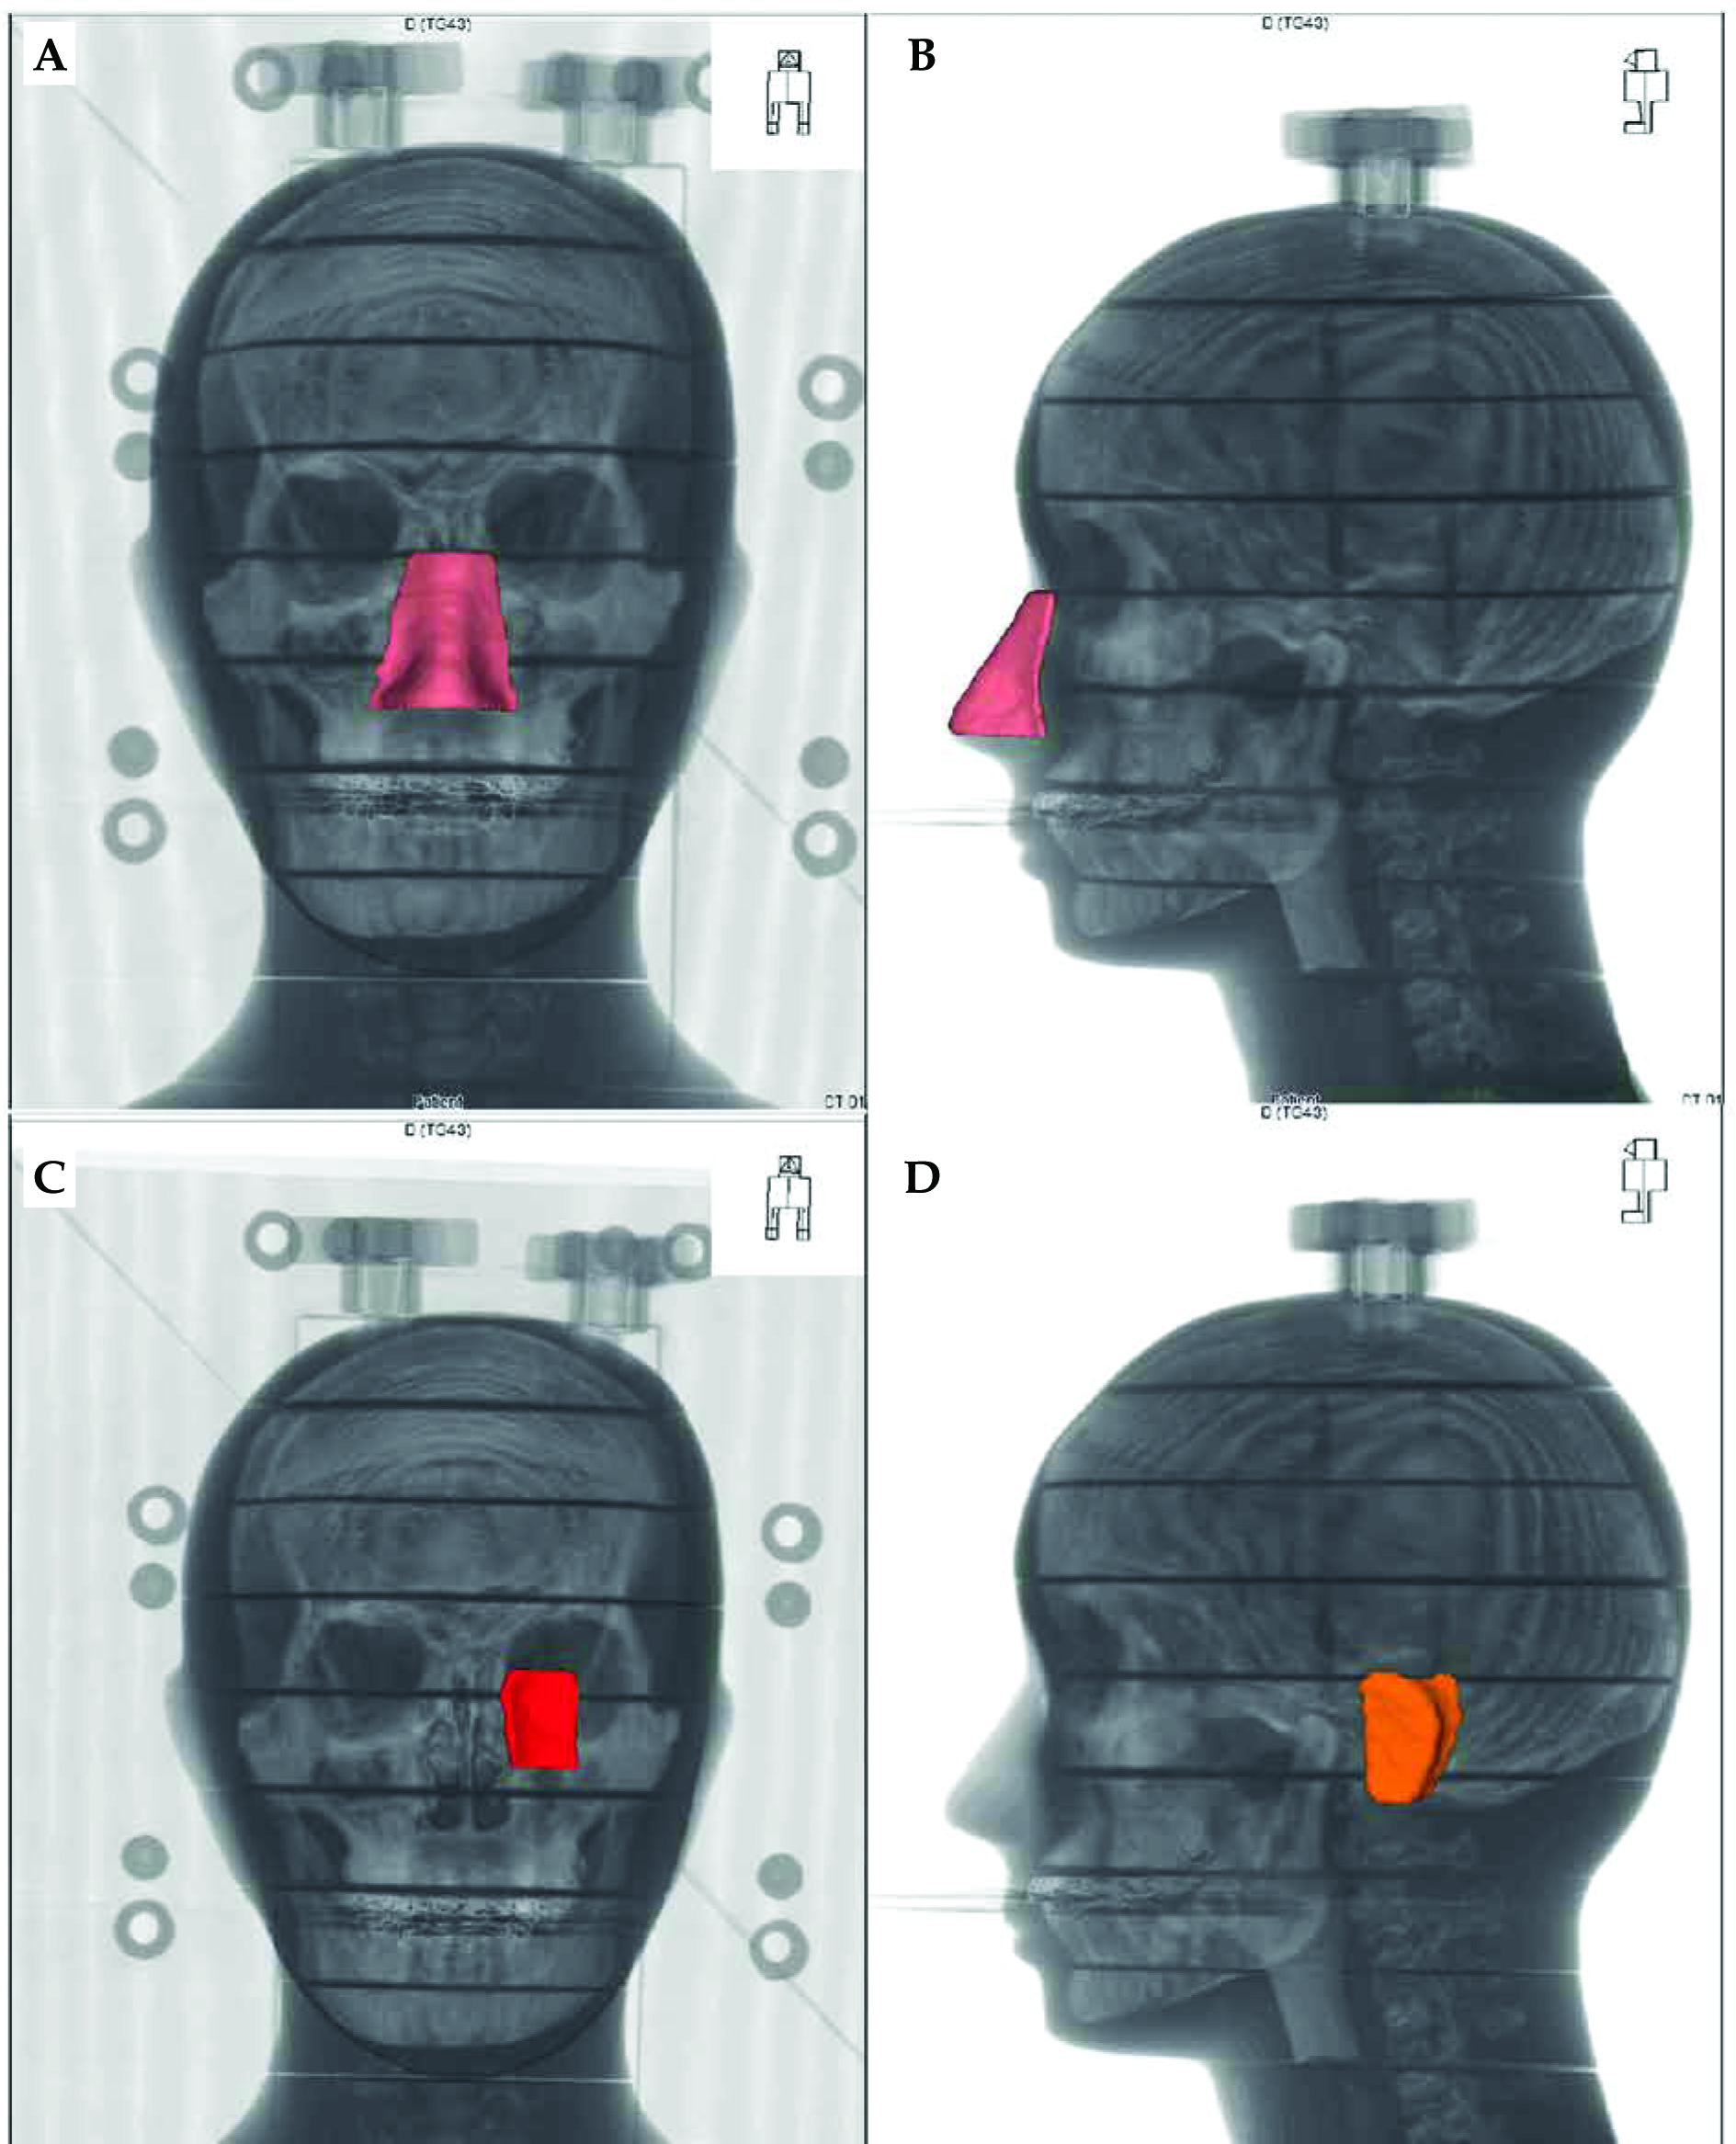
Locations of the applicators were marked on the surface of anthropomorphic phantom. A decision was made to prepare applicators for the three most difficult areas in skin brachytherapy, including the nose, ear, and corner of the eye (Figure 1). Skin surface markers were attached to maintain repeatability of the irradiated volume. The phantom was computed tomography (CT)-scanned, with a layer thickness of 1 mm. Then, obtained phantom images were imported into Oncentra® Brachy planning system and then, its’ outer contour was reconstructed using automatic contouring tool. In the set of transverse CT scans, three surface targets were determined located on the nose, corner of the eye, and ear, with a penetration depth of 3-5 mm.
Fig. 1
Location of targets, for which applicators were designed and printed. A, B) The target within the nasal area, C) the target in the corner of the eye, D) the target in the ear region
Two types of applicators were designed for each of the target volumes. The first type was a 5 mm thick applicator designed to place blind-end catheters on their outer surface with hot glue. The distance between catheters was 5-7 mm. According to a pre-plan prepared in treatment planning system, the second type was a 10 mm thick applicator designed to place catheters inside their volume.
As presented above, based on TPS, the applicators’ preparation consisted of generating boluses created on the surface of the phantom in positions of the specified targets. Boluses encircled the target and followed the curvature of the phantom as closely as possible. The first step was to generate a 5 mm thick bolus and design catheters’ position on its’ surface, where the type one applicator attached the catheters with hot glue. Next, a 10 mm thick bolus was generated for the exact location as thinner applicator. In the second type of applicator, holes had to be designed to insert the catheters inside their volume. These channels were generated in treatment planning system using a catheter reconstruction function to define the path of source. Coordinates of the pre-planned applicators’ active dwell positions were used to design catheter channels in a 3D-printed bolus. Particular number of channels in each applicator depended on the size of irradiated lesion, with a distance between catheters of 5-7 mm.
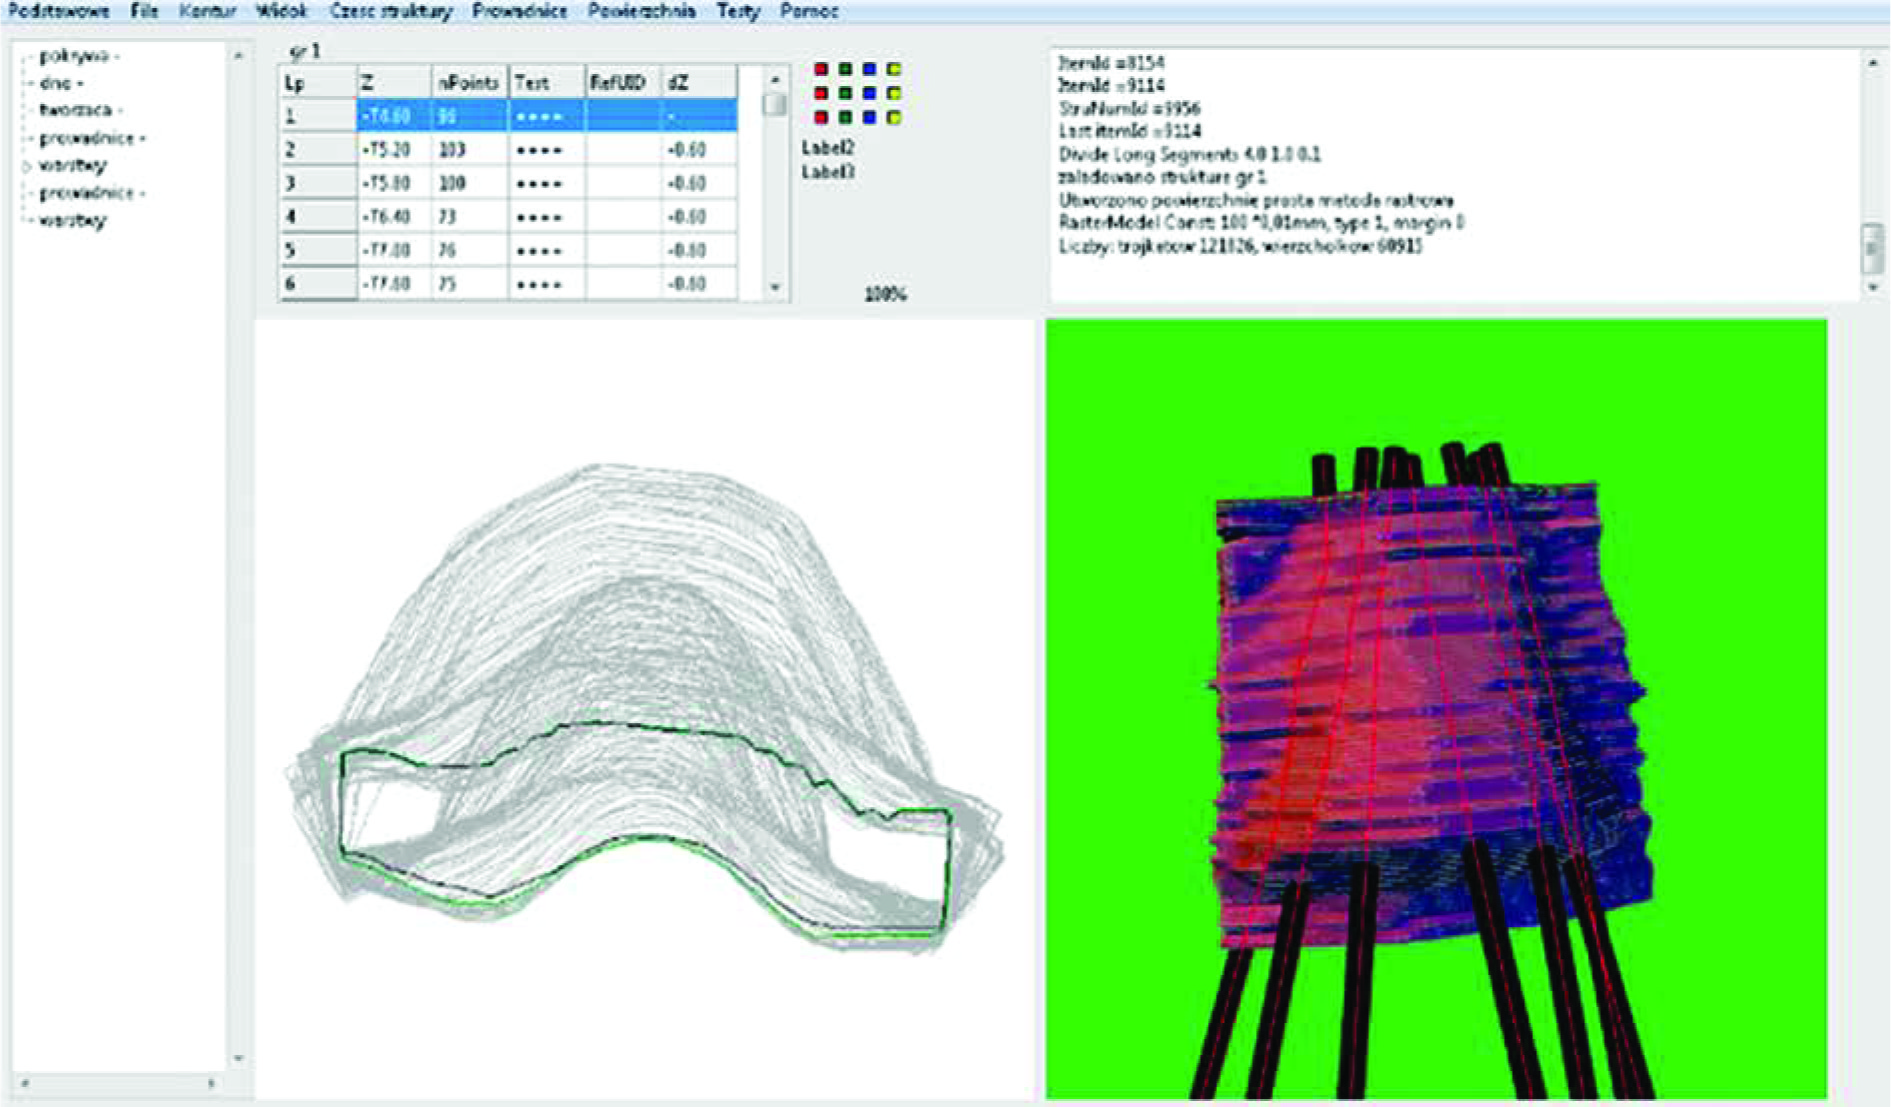
The created projects were saved in a DICOM format and imported into our software, named ‘Beben – DICOM to STL’, designed for preparing 3D prints. Beben – DICOM to STL extracts the coordinates of the points being vertices of polygons of each bolus section from RTStructure file, and then processes them into 2D structures. By doing this, in a layer-by-layer assembly, it computes a three-dimensional solid. For the type two applicator, a bolus structure, which became the block of the applicator itself, was exported first, followed by generating of the channels. The program downloaded data from RTPlan files, and the files contained the coordinates of the active source dwell positions in the same coordinate system as the bolus vertex coordinates, to create channel shape. The hole diameter was set to 3 mm to insert 6-F catheters without difficulty (Figure 2).
Fig. 2
Design of the applicator in Beben – DICOM to STL software. Reconstructed slices are visible on the left. The right part of the image shows a reconstructed applicator with catheters based on TPS in correct positions
Beben – DICOM to STL software exports a .stl file recalculated using printer producer software to generate G-code file. G-code contains information about movement of the extruder, temperature of the nozzle, and speed of the filament extrusion.
Applicators prepared in this way were printed from a PLA filament with MakerBot Replicator+ printer, using FDM technology.
Film calibration
For calibration purposes, 17 radiochromic films with dimensions of 3 cm × 3 cm were prepared, 16 of which were irradiated to deposit the following doses: 0.05 Gy, 0.1 Gy, 0.2 Gy, 0.5 Gy, 1 Gy, 2 Gy, 3 Gy, 4 Gy, 5 Gy, 6 Gy, 7 Gy, 8 Gy, 9 Gy, 10 Gy, 11 Gy, and 12 Gy. One film served as a reference for 0 Gy dose and was not irradiated. For calibration and measurements, we used films from one batch (lot No. 09131802).
In the treatment planning system, 16 adequate radiation plans were prepared taking into account the above-mentioned doses for each of films, according to a scheme presented below.
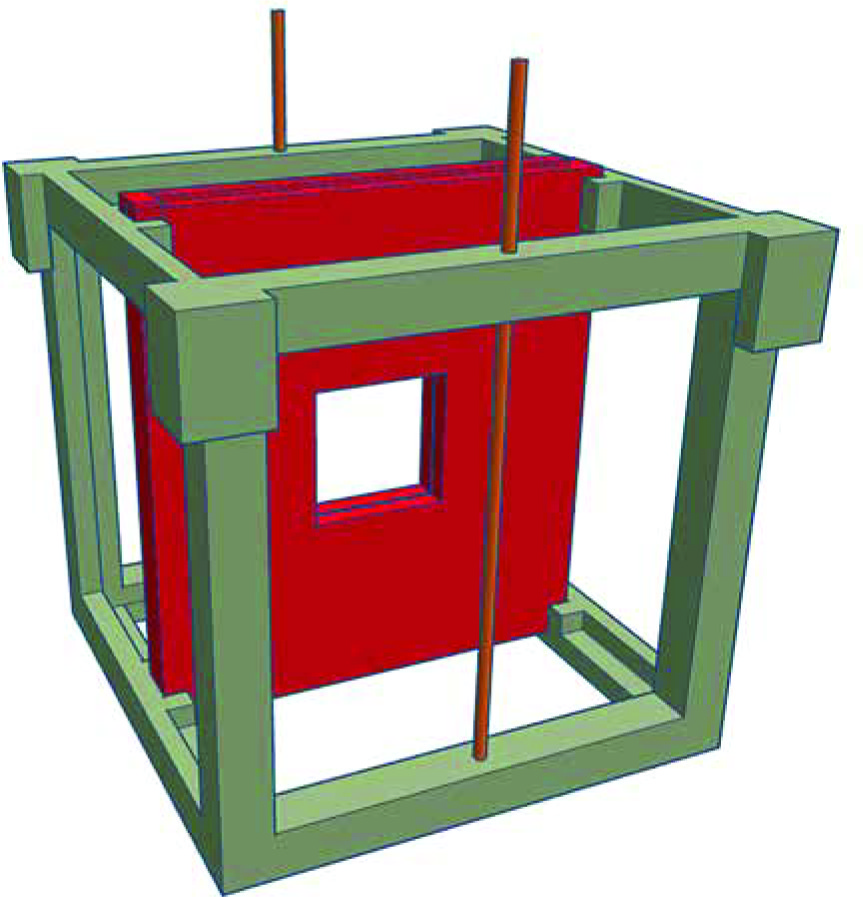
Irradiation took place in water and the phantom, in which the film was placed was also 3D-printed from PLA. Films were irradiated bilaterally to reduce dose inhomogeneity from a 5 cm distance. Phantom designed for film calibration is presented in Figure 3. We analyzed central 1 cm × 1 cm area to obtain a reliable and homogeneous readout. Each of the 16 films was always placed in the same orientation in the phantom [4].
Dose determination with films
Epson Perfection v.750 Pro flatbed scanner (Epson; Nagano, Japan) was used to verify the values recorded on EBT3 radiochromic films due to irradiation. Readings in 16bit and 300 DPI resolution were taken 72 hours after irradiation of both film sets intended for calibration, and films irradiated using designed surface applicators for dose verification. Each film was placed in the same orientation in the center of the scanner, and scanned at 300 dpi resolution. Calibration was performed with a single-channel method.
Gamma analysis
Data specified in the above steps were used for a comparative analysis of dose distributions measured with dosimetric films and those generated in the treatment planning system Oncentra® Brachy v. 4.5.3 (Elekta Brachytherapy; The Netherlands). Gamma method proposed by Low et al. [5] was applied for comparative purposes. Dose distributions from treatment planning system were saved as a text file, and files obtained by film scanning were exported to OmniPro I’mRT program for gamma analysis.
During preliminary analysis, it was assumed that the differences between points for two dose distributions, i.e., measured (obtained as a result of irradiated radiochromic films in anthropomorphic phantom with designed applicators) and calculated in TPS, would not exceed a 2% in terms of dose value (ΔDM) and be not more than a 2 mm apart from each other in terms of distance (ΔdM). Also, an analysis showed the criteria, including ΔDM = 1% and ΔdM = 1 mm, respectively. Minimum number of the analyzed points meeting acceptance criteria of the entire dose distribution should also be considered and established. In clinical practice, it is assumed that if at least 90% of the analyzed points within the compared area meet the condition gamma (ΔDM, ΔdM) ≤ 1, it means that the planned dose distribution is consistent with the measured one.
Planning and completion of radiation with the created applicators
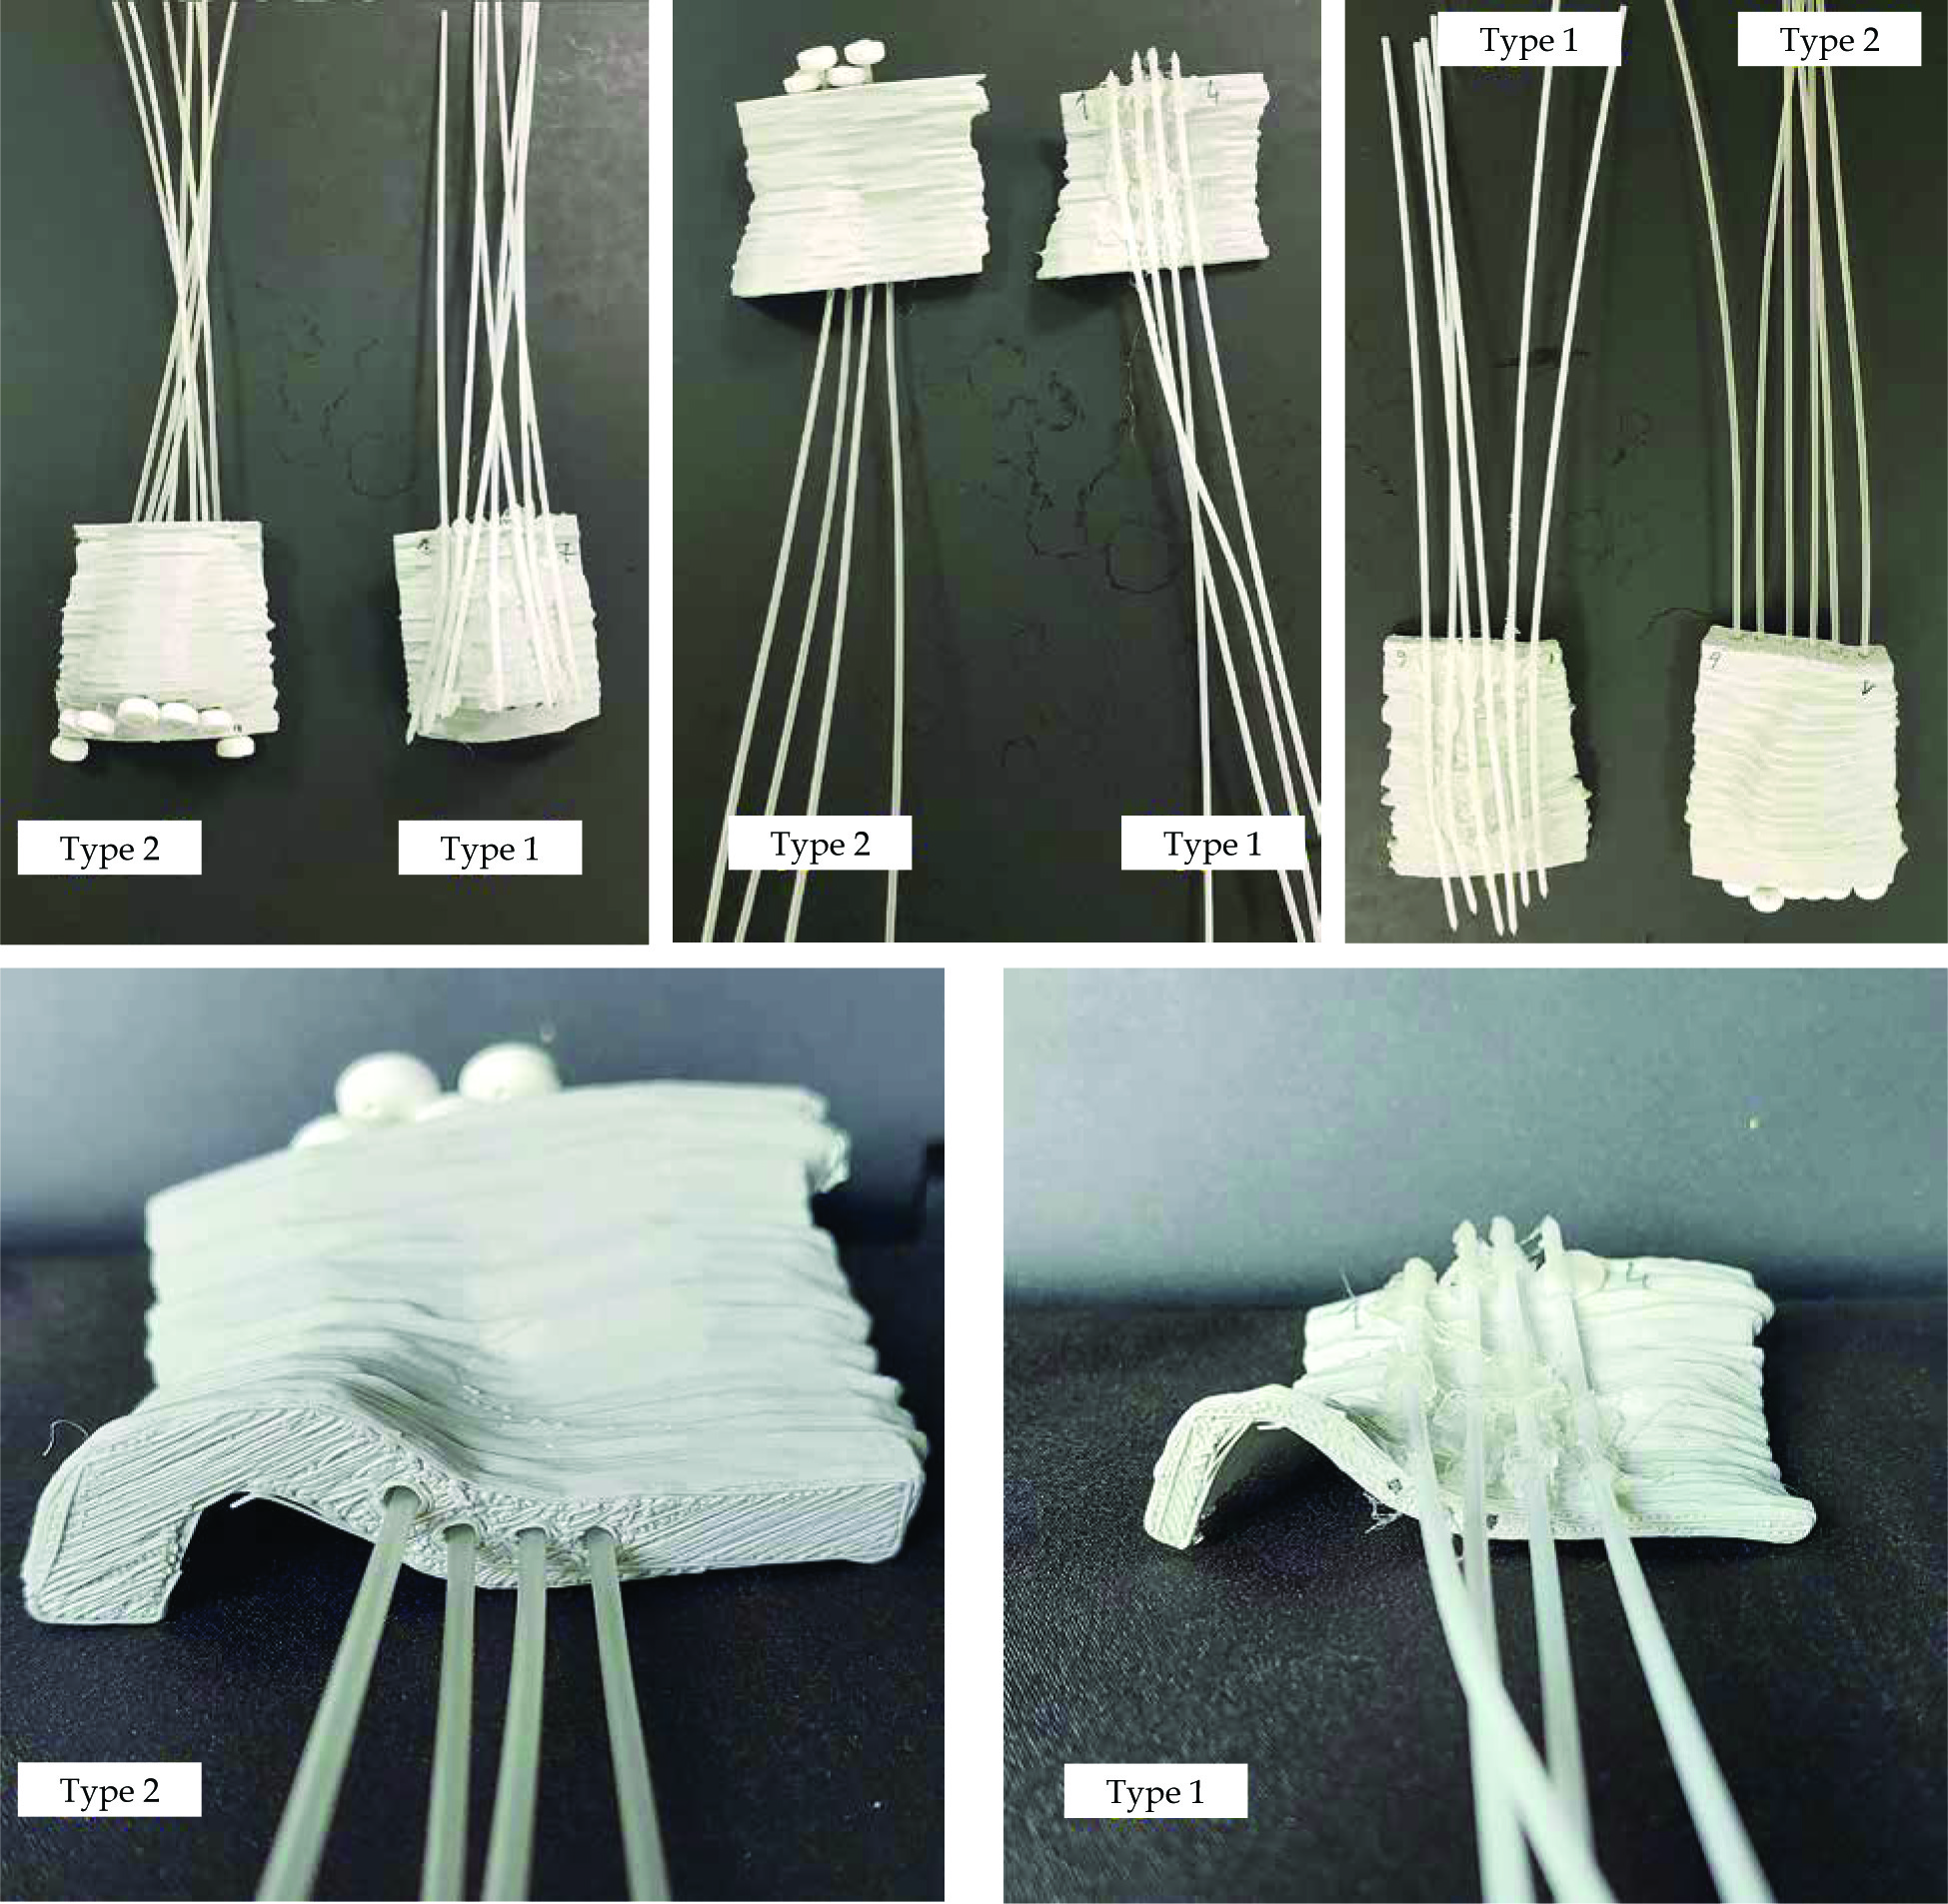
Blind-end catheters were placed in the channels in the printed type two applicators. In the first type of applicators, they were glued with hot glue to correlate with the location of holes in the second type applicators (Figure 4).
Fig. 4
Printed applicators for all tested localizations. First type (5 mm thick, catheters attached with hot glue) and second type (10 mm thick, catheters inserted through printed channels) applicators. Bottom: view of the catheter’s layout for an applicator of a target located in the ear area
Markers were placed on the surface of the anthropomorphic phantom at the designated targets’ sites. Then, each of the six designed applicators was appropriately positioned on the phantom and CT-scanned. In this way obtained images were imported into a treatment planning system. Six irradiation plans were generated for both types of applicators and for each of the three targets.
Before starting dose planning, the imported CT were fused with imported CT images and previously determined outlines of target volumes for each applicator. Then, source channels in each of the designed applicators were reconstructed.
Initial dose normalization and optimization in each prepared plan were based on dose points located on the inner surface of each target volume. However, in order to achieve better parameters of dose distribution, manual normalization was performed and graphically optimized. As a result, it was possible to achieve a better set of isodoses for each applicator in each target and to obtain simulated genuine treatment planning process. The prescribed doses to all six plans were 5 Gy on CTV, with a 2.5 mm step size. In Figure 5, an applicators’ setup on the nose is demonstrated.
Fig. 5
EBT3 radiochromic film trimmed to the curvature of the phantom and scheme of the measuring system on the example of second type applicator placed on the nose
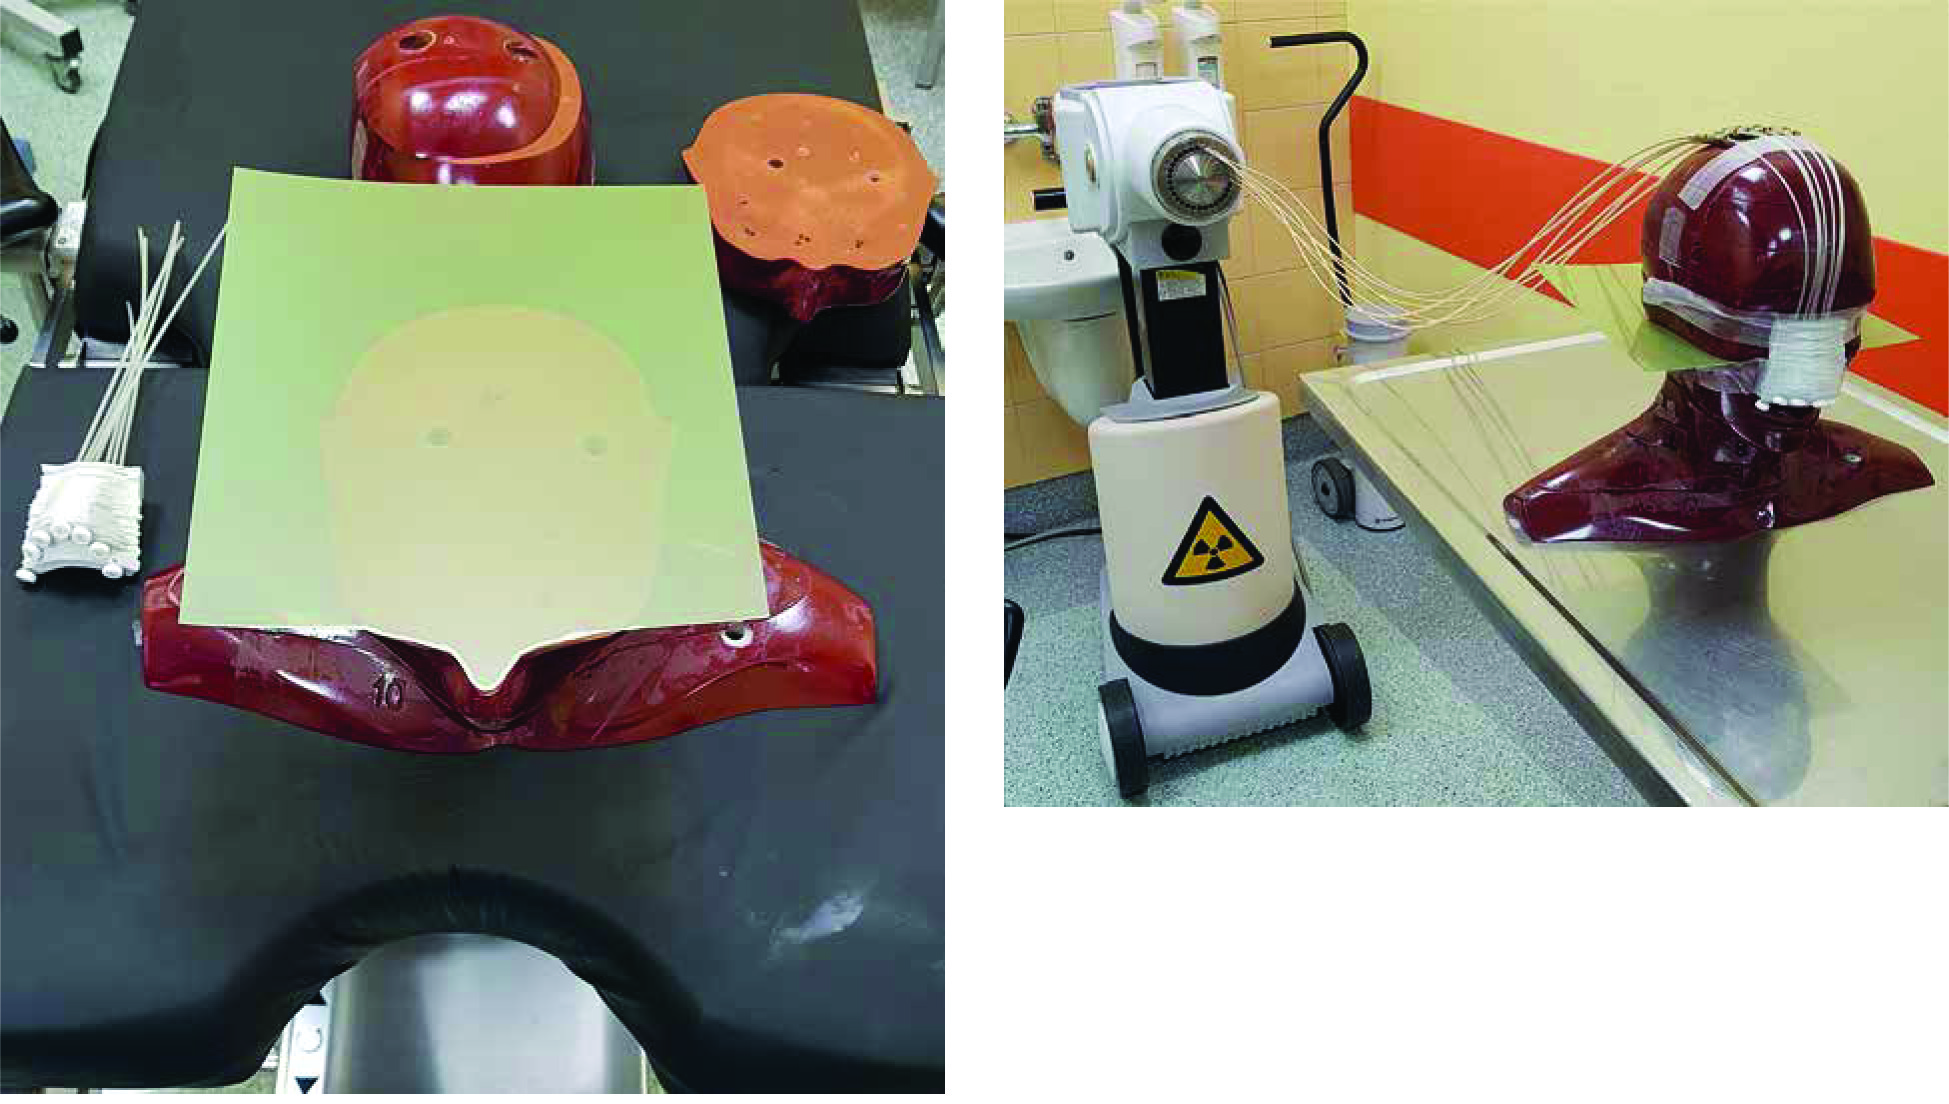
Gafchromic EBT3 radiochromic films were used to record doses for each of the six prepared plans. Each film was successively placed within the phantom slices, so that it was half-way up the irradiated target. Each film was trimmed to match its’ shape to the phantom’s curvature in the place of applicator’s fixation (Figure 6).
Results
Calibration curve
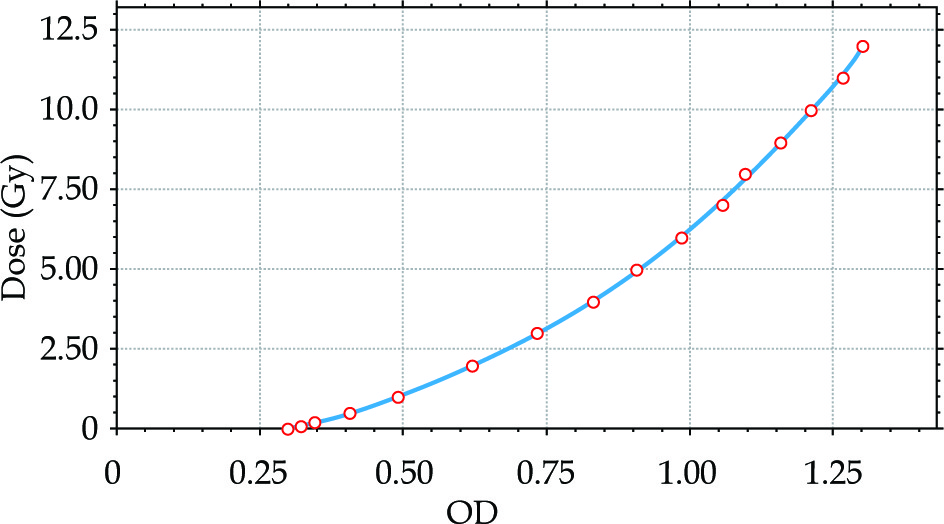
A total of 17 radiochromic films with dimensions of 3 cm × 3 cm were irradiated with the following doses: 0 Gy, 0.05 Gy, 0.1 Gy, 0.2 Gy, 0.5 Gy, 1 Gy, 2 Gy, 3 Gy, 4 Gy, 5 Gy, 6 Gy, 7 Gy, 8 Gy, 9 Gy, 10 Gy, 11 Gy, and 12 Gy. The dose deposition for each film was performed each time in the same manner, maintaining a constant location and distance from 192Ir source. Reading took place after 72 h, in a 1 cm2 area within the center of each film in the same orientation. Due to bilateral irradiation of pieces of calibration film, standard deviation of the measured doses in the selected area was SD = 0.5%. After scanning, the films were saved in a lossless TIFF format and exported to OmniPro I’mRT program, in which calibration curves for the scanner and radiochromic films were created.
Based on comparing specified optical density (OD) values with the scanner’s data-carrying information about the analog-to-digital conversion (ADC) signal, a relationship was obtained, which was the basis for creating a scanner calibration curve. The calibration curve was determined as a third-degree polynomial:
y = 4.5552x3 – 1.8708x2 + 5.0421x – 1.5061
The coefficient of determination of the calculated polynomial was R2 = 0.9995 (Figure 7).
Plan evaluation
Plans, which were prepared using 3D-printed applicators, had to meet dose distribution criteria. In order to verify, pre-plans were compared to plans calculated for film irradiation. Dose volume histogram (DVH) parameters of pre-plans and completed plans are presented in Table 1. Standard DVH parameters of CTV, i.e., dose to 90% of CTV, volumes receiving 100% and 150% of the prescribed dose, and doses to 0.1 and 2 ccs of the bones (CTV V100, V150, D90, and bones D0.1, D2) used in clinical practice, were evaluated, and pre-pared plans met clinical criteria.
Table 1
Dose volume histogram (DVH) parameters of pre-planned dose distributions and realized plans. D90, V100, and V150 are clinical target volume (CTVs) parameters. D0.1 and D2 refer to doses delivered to bone structures
Film analysis
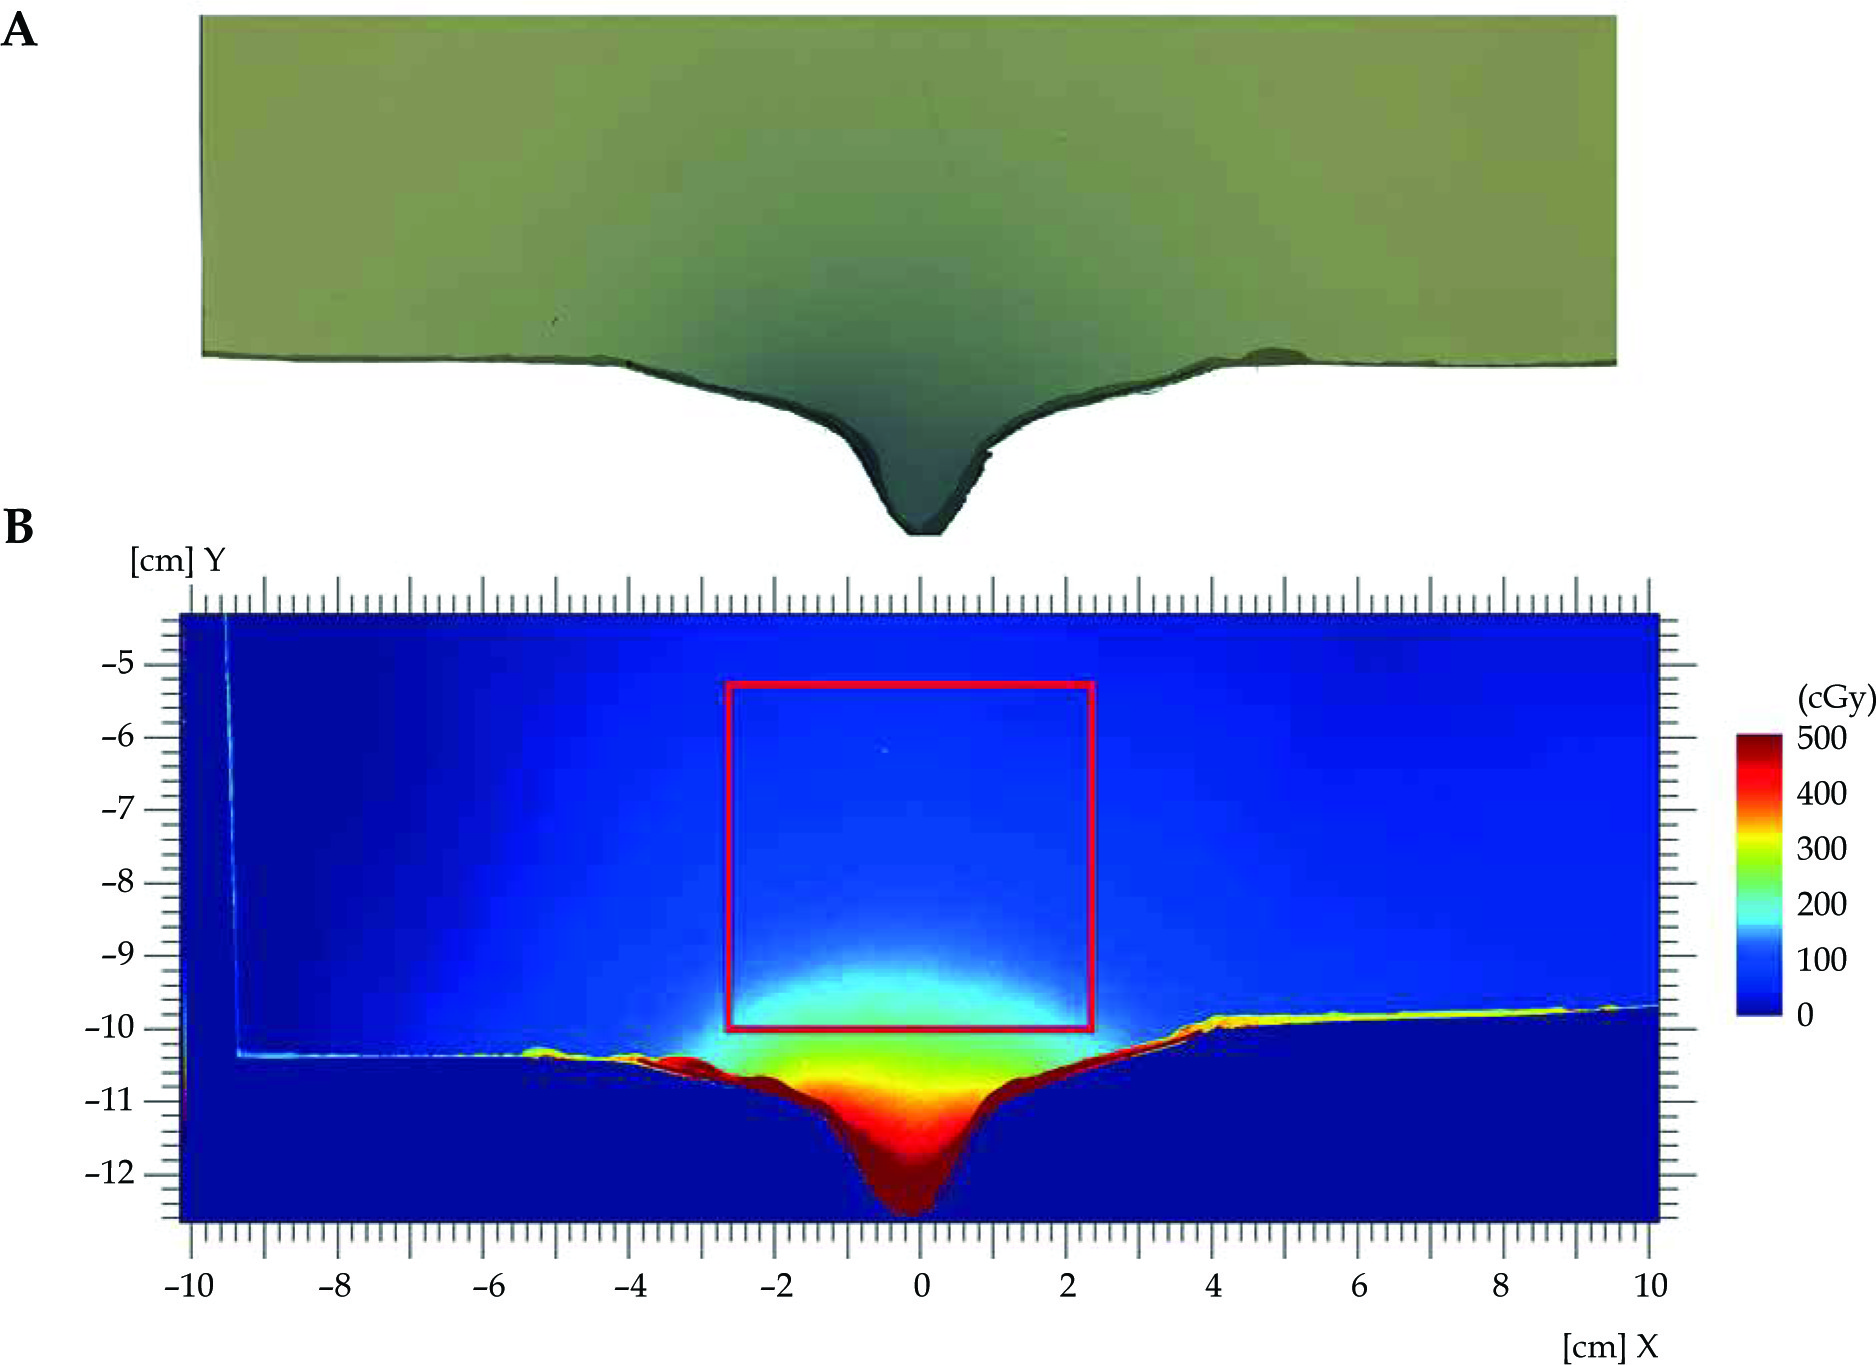
Before starting comparative analysis, an important step was to match data from treatment planning system with radiochromic films. Since each film was a cut to the phantom’s curvature in a place where the applicator abutted, characteristic points were marked, for example, for the applicator placed on the nose, it was the tip of the nose. Then, it was necessary to measure the distance from the specified characteristic point – the origin of the new coordinate system in OmniPro I’mRT program – to the center of the selected dwell position. Next, the data from treatment planning system was moved to make the characteristic points match. Unfortunately, the film was delaminated at the point of its’ cut, as shown in Figure 6. Therefore, for dose distribution comparison, an area that covered the film had to be selected, and it was necessary to ensure that the film in that location was not damaged. Consequently, it was decided to perform measurements in a square field of 5 cm × 5 cm located as close as possible to the applicator and not containing damaged fragment of a film.
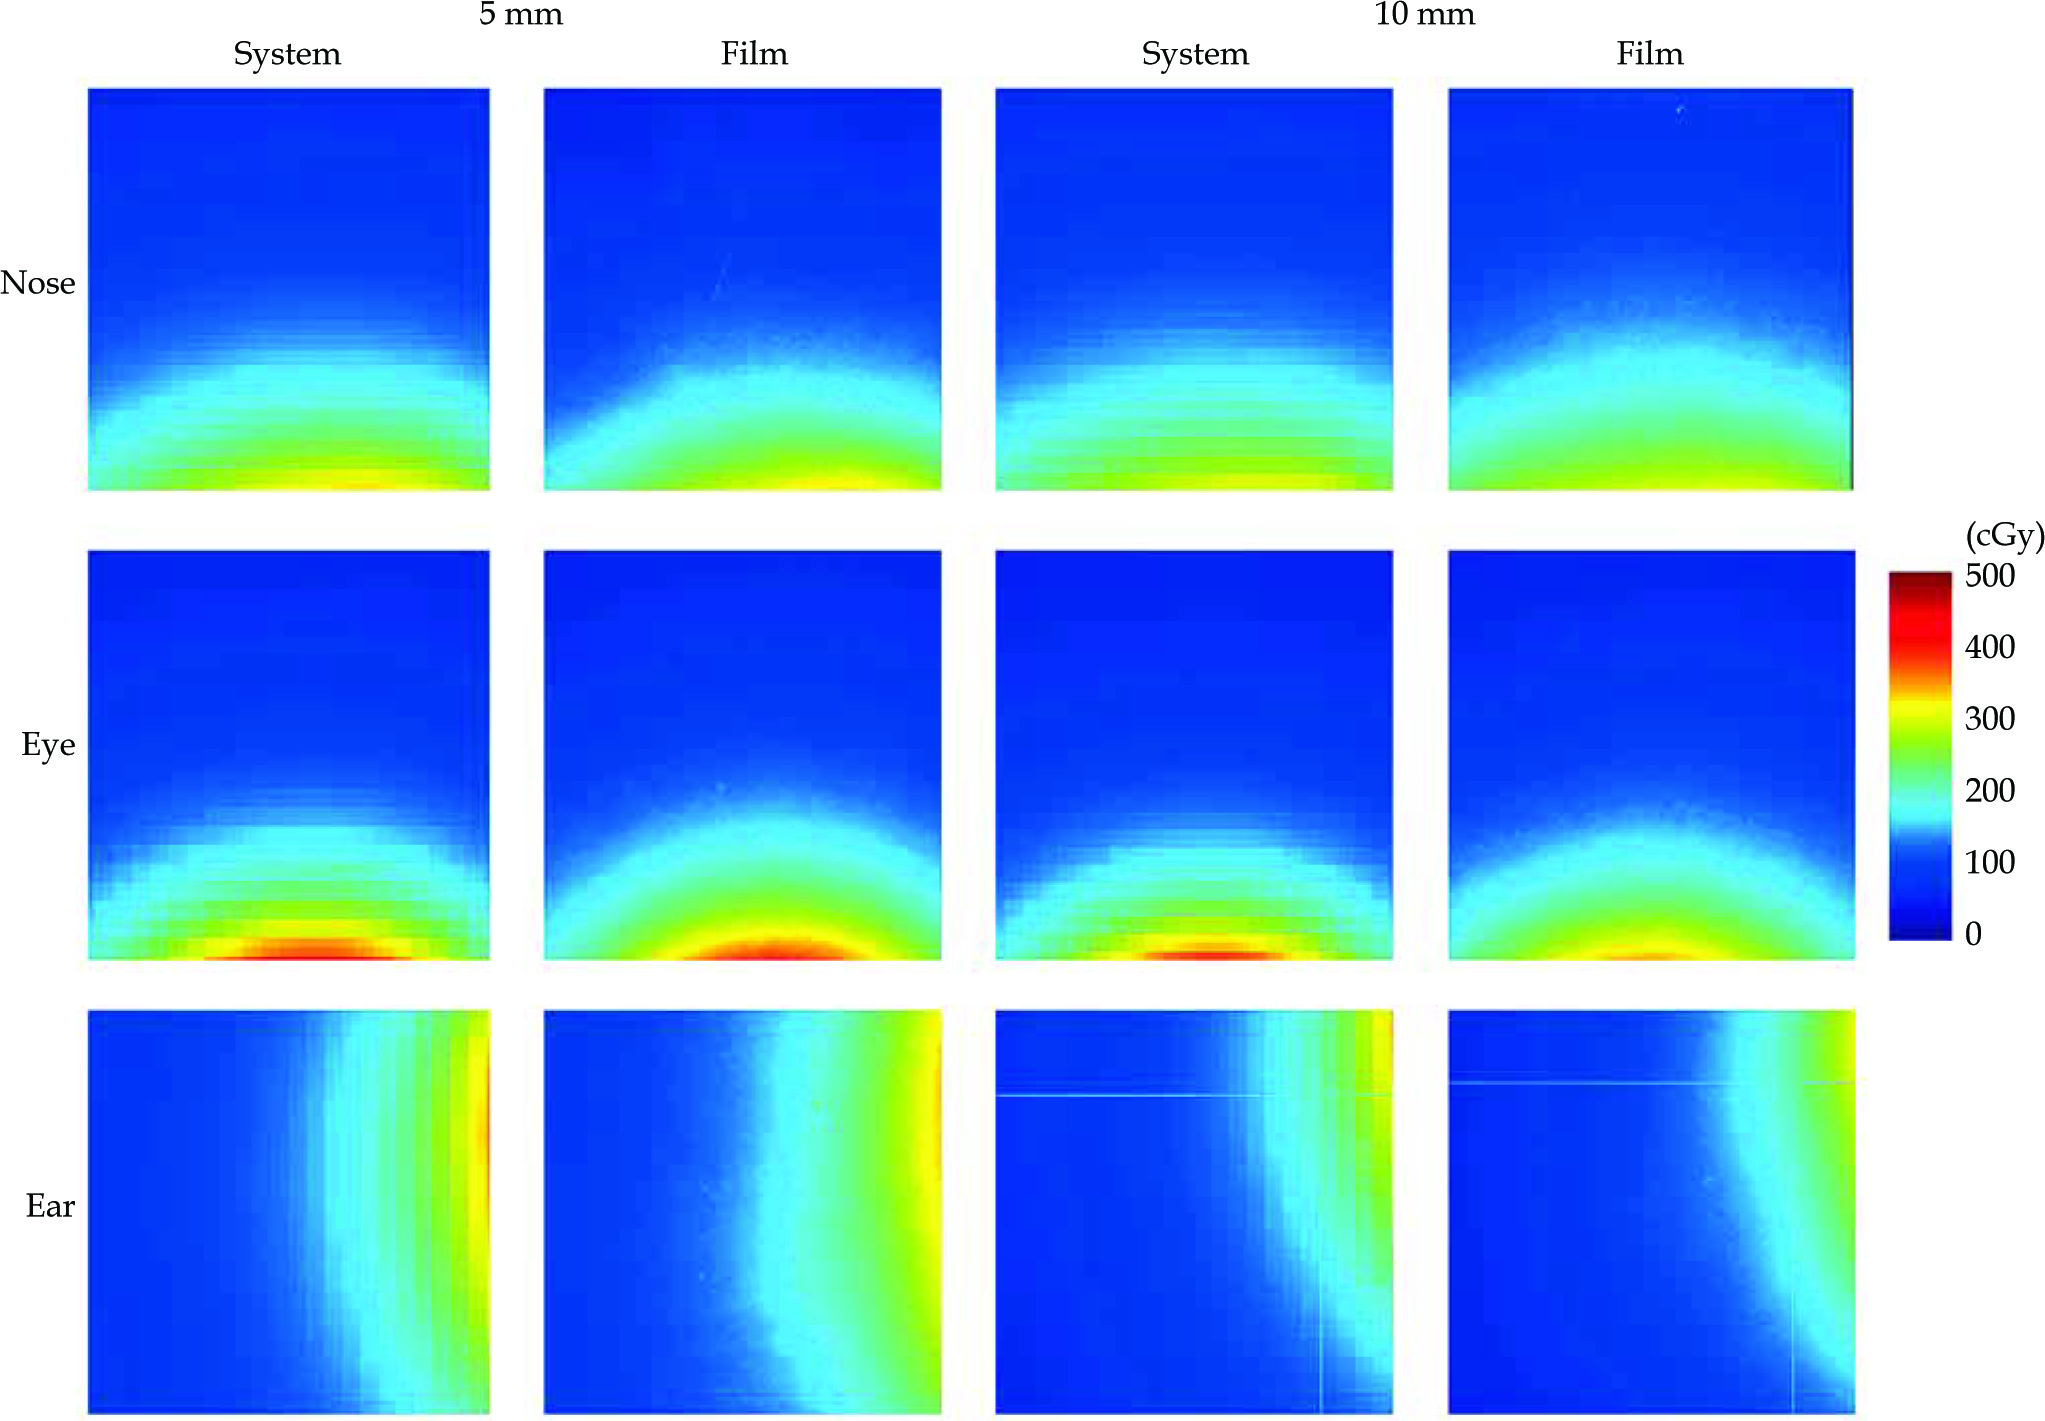
Figure 8 presents dose distribution in regions of interest (ROI) for all the studied areas. In the analyzed ROIs, the dose ranged from 4.06 cGy to 344.5 cGy (range, 8.12% to 68.9% of the prescribed dose). Due to a large curvature of the nasal region and target located close to the nose tip, the maximum dose measured in this ROI was 231.0 cGy (46.2% of the prescribed dose). The highest doses were measured in ROI examined near the eye area, resulting in 274.2 cGy (54.84%).
Fig. 8
Absolute dose distribution in ROIs of gamma analysis. First row presents dose distribution calculated and delivered to the film in the nasal region. Second row shows calculated and delivered dose distributions in the eye region. At the bottom, there are dose distributions in the ear region. The remaining six images present results for 5 mm thick applicators and the right for 10 mm applicators. Dose distributions calculated in TPS show much lower resolution, as TPS exports planar dose distribution in 1 mm × 1 mm pixels
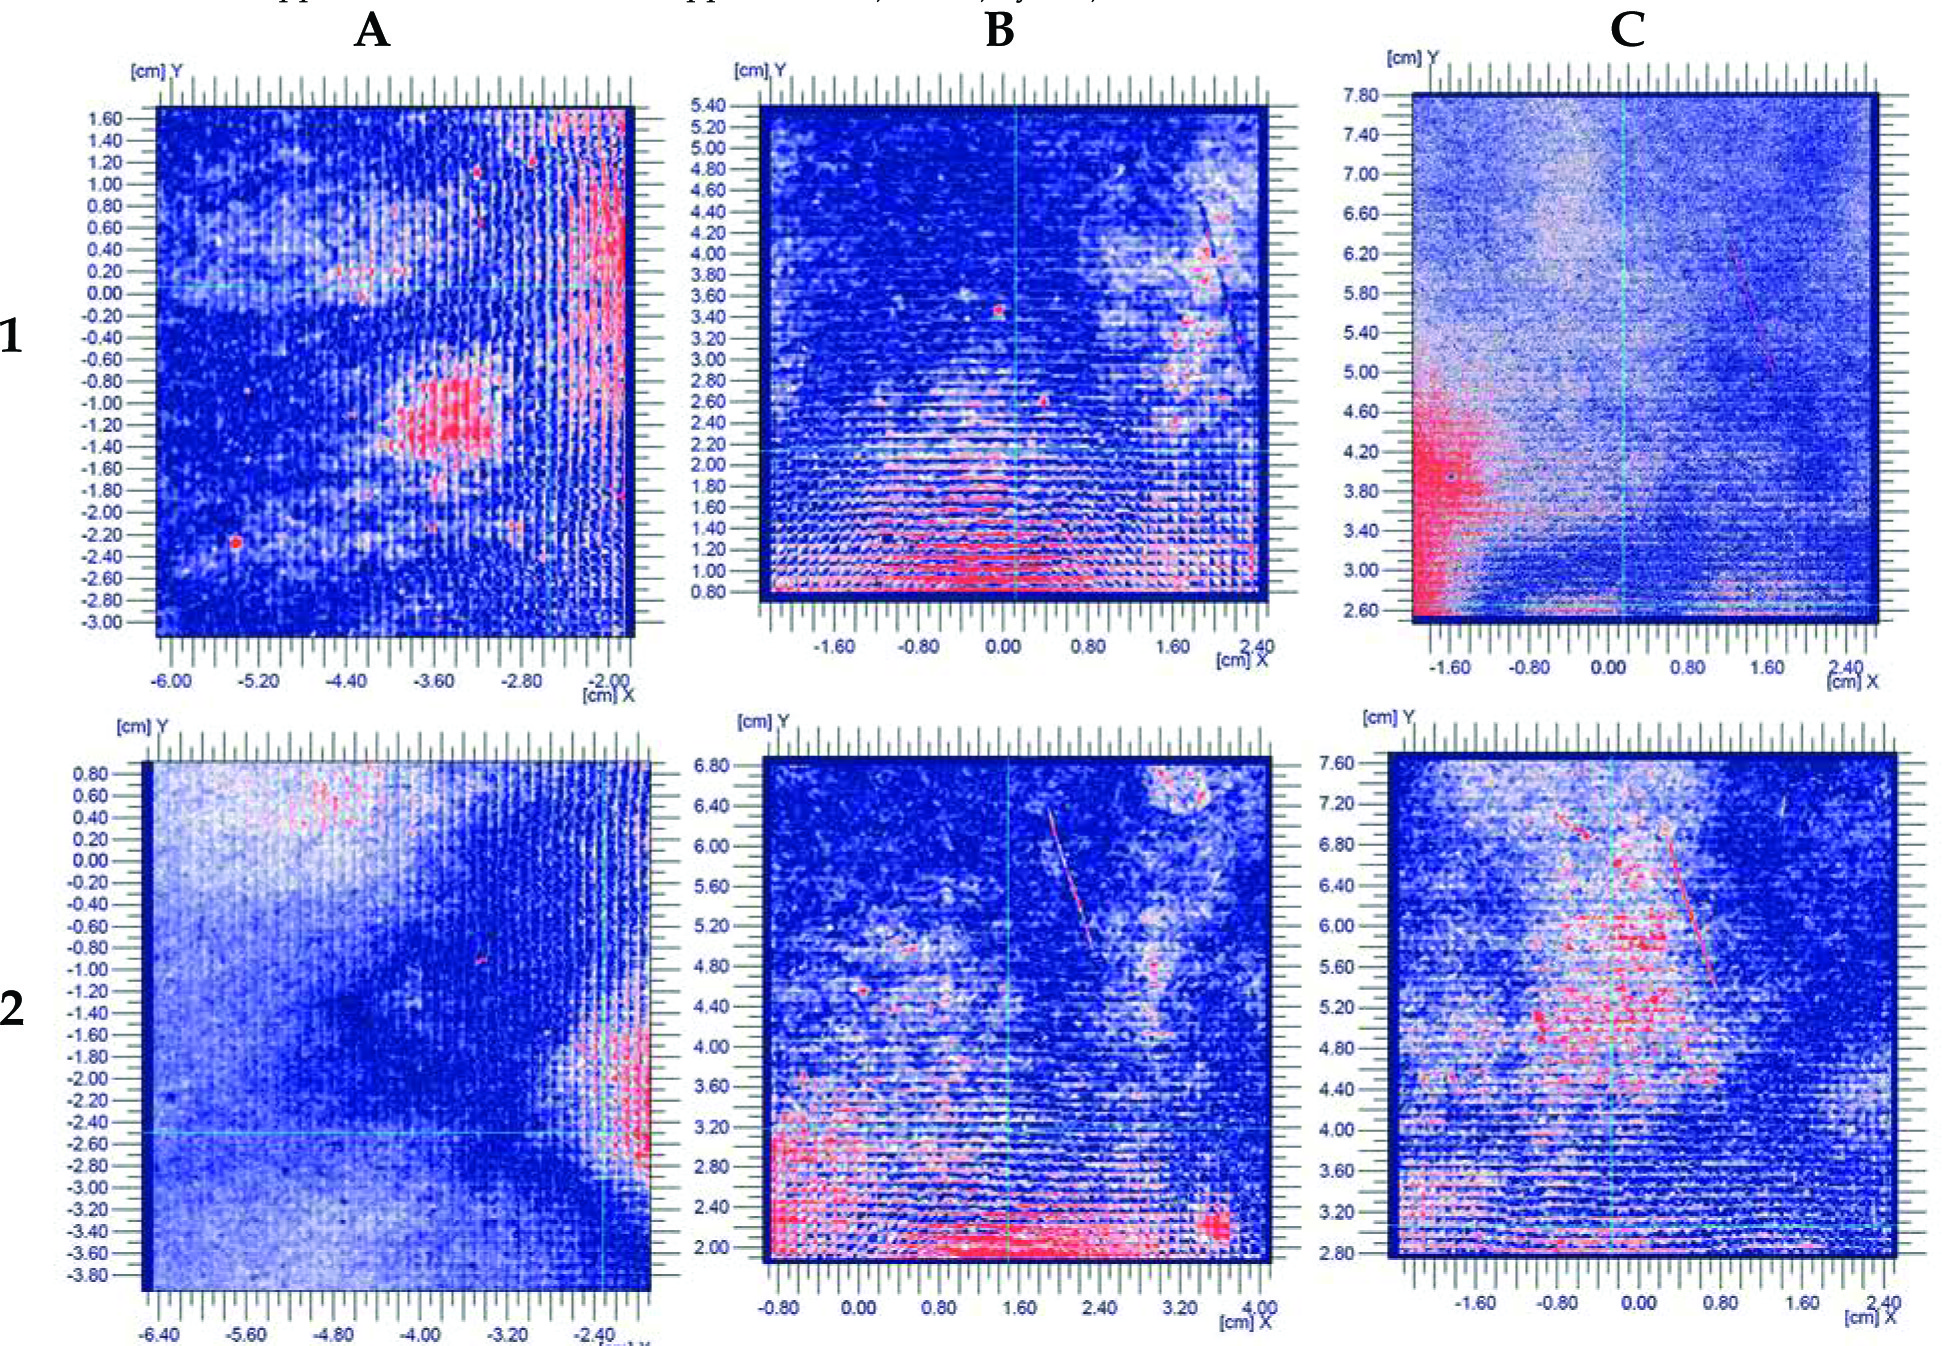
Figures 9 and 10 present graphical representation of gamma analysis. The agreement between a dose calculated in treatment planning system and measured with the films was when the gamma analysis result was lower than 1 for 95% of the tested points. Therefore, in the graphical presentation of the gamma analysis, blue = 0, white = 1, and red = 2. The preliminary criteria used in the gamma analysis were ΔDM = 2% and ΔdM = 2 mm. However, due to a large dose gradient in brachytherapy and very high compliance with preliminary results, it was concluded that a more accurate measurement at the level of ΔDM = 1% and ΔdM = 1 mm would be justified. Unfortunately, the film’s highest dose points were not measured because the applicator was outside the phantom, separately from the film.
Fig. 9
Graphical presentation of gamma analysis with 2%/2 mm criteria. Row 1 includes 5 mm thick applicators, row 2 –10 mm thick applicators. Localization of applicators: A) ear, B) eye, C) nose
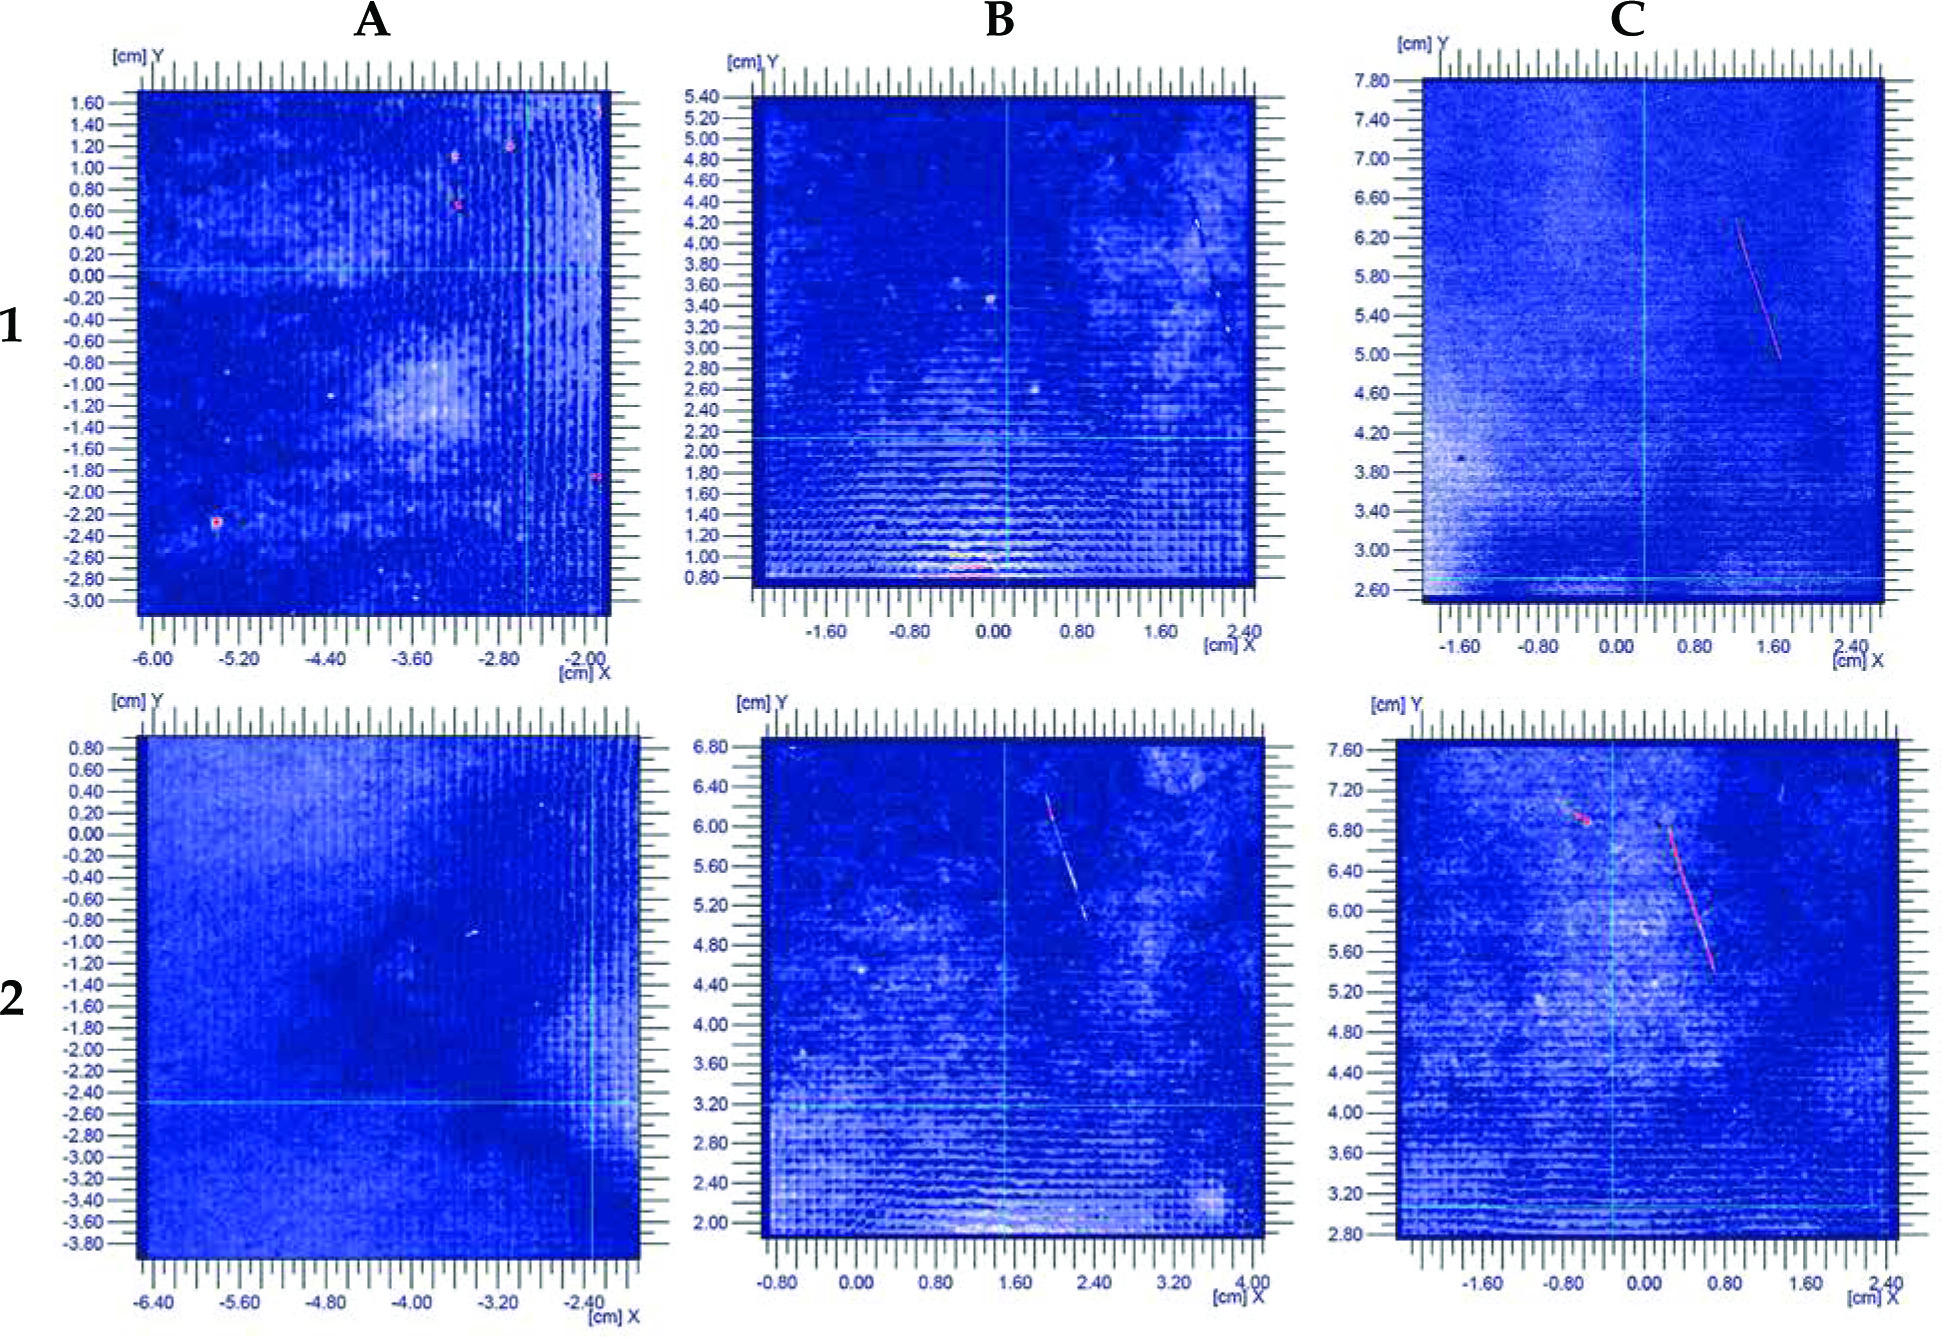
Fig. 10
Graphical presentation of gamma analysis at 1%/1 mm criteria. Row 1 includes 5 mm thick applicators, row 2 – 10 mm thick applicators. Localization of applicators: A) ear, B) eye, C) nose
Measurements were conducted in this 5 cm × 5 cm area. Failure to perform measurements in region of higher doses (closer to the applicator) resulted from a local film damage, which lead to significant discrepancies in the delivered and measured dose distribution, as shown in Figure 6. Due to radiochromic film dissection, close to cutting line, scanned film hue did not correlate with delivered dose. The results of the analysis of dose distributions based on ΔDM = 2% and ΔdM = 2 mm criteria are presented in Table 2.
Table 2
Results of gamma analysis of the uncut film
| No. of analyzed points | 3,430,661 |
|---|---|
| Min. signal | 0.00 |
| Max. signal | 2.00 |
| Average signal | 0.45 |
| SD | 0.64 |
| Pixels in ranges 0.00-1.00 | 2,886,598 (84.14%) |
| Pixels in ranges 1.00-2.00 | 544,063 (15.86%) |
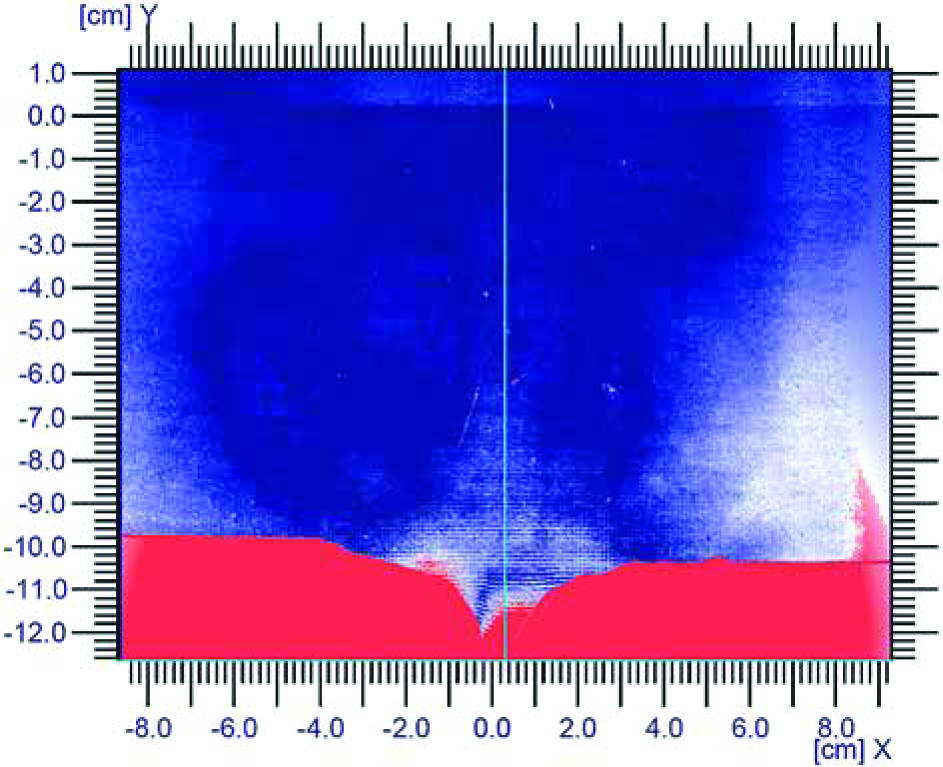
Gamma analysis of uncut film is shown in Figure 11. Most of the red area (gamma > 1) is located at the cut line and outside the film.
Gamma analysis
The comparative gamma analysis of the prepared plans and doses deposited to radiochromic films was collected and presented in tables. Table 3 shows gamma analysis results for assumed agreement criteria of 2 mm and 2% of the prescribed dose applicators with catheters on the surface and inserted in printed channels. Table 4 summarizes the collected results of the gamma analysis at 1% and 1 mm level of agreement of measurements performed for both types of the applicators.
Table 3
Gamma analysis results for 2%/2 mm criteria
Table 4
Gamma analysis results for 1%/1 mm criteria
Results of gamma analysis at 2%/2 mm agreement level showed that all the inspected applicators were statistically consistent for over 99.8% of the examined points, regardless of the location or construction.
Gamma analysis at 1% and 1 mm demonstrated more significant inconsistencies. Only the dose deposited from a 10 mm thick applicator localized in the ear region was consistent with the planned dose for over 95% of the tested points. On the other hand, only one applicator, i.e., 10 mm thick localized in the eye region, presented lower than 90% agreement with dose distribution from TPS. All the other applicators showed agreement with the prepared plans between 91% and 93% of the tested points, and are presented in Table 4.
Discussion
The risk of applicator displacement is a significant problem for implementing treatment plan in superficial brachytherapy. It is a very unfavorable phenomenon. Even the slightest displacement adversely affects the quality of treatment plan due to high-dose gradient in brachytherapy using radioactive sources. Planning dose distribution in target volume and critical organs is based on CT images obtained immediately after application. Unfortunately, when planning a treatment during which, the patient waits for a therapy, especially between successive treatment fractions, there is a high probability of moving the applicator or placing it inaccurately using following fraction. Accordingly, the possibility of dislocation increases with the duration of therapy. The position and size of target volume are also significant. Changes located on anatomical curves, mainly on the face (e.g., the corner of the eye or nose) are problematic. The greater the curvature, the more difficult is to adjust the applicator. In addition, the goal is not only to prepare a treatment plan that allows deposition of a high-dose in target volume, but also to achieve the most appropriate possible protection of critical organs.
There are well-known applications, for example, thermoplastics, which soften under high temperature, allowing to mold and adapt to a given curvature. Other materials have been used in individual applications due to their plasticity. Examples include studies by Kuncman et al. [6] and Kowalik et al. [7], in which, target volume was within anatomical curvatures. Excellent results were obtained for patients who underwent brachytherapy.
Therefore, obtaining applicators using 3D printing turns out to be a great solution. Boluses are commonly used in external beam radiotherapy to achieve the desired dose distribution. Sheet of the bolus material is limited to accommodate irregular patients’ surfaces, and is only delivered in specific thicknesses. Utilization of gauze is a subject to daily changes, and incremental dose depends on humidity. Wax and thermoplastics need to be hand-crafted, and in this case, mismatching the patient’s surface is often only visible after computed tomography imaging, making the process iterative and time-consuming. These limitations may result in air spaces, which may affect the accuracy of the surface dose [8].
In the current study, the applicators were designed based on boluses generated in Oncentra® Brachy treatment planning system, based on tomographic images of the anthropomorphic phantom. Such an execution procedure allow to precisely match the applicator and the target curvature. Obviously, the generated target volumes only penetrated the depth of the phantom, and the surface was unchanged. However, in a case of a real patient, the lesion often has irregular surfaces, making it difficult to adjust the application. Nevertheless, the design based on tomographic images show the exact location of the target, and the selection of the applicator size is adequate. In castings, only the outer surface of the lesion is visible, and the application design is based only on surface changes. Without pre-planning CT, it is challenging to assess the thickness of lesions with a certain penetration depth, which varies throughout the volume.
The 5 mm thick applicator is superior to thermoplastics in terms of accuracy and anatomically matching the curvature of target volume. However, the procedure for placing the catheters is similar. In the second, 10 mm thick type applicators, catheter placement locations were generated during the bolus design. Therefore, the applicator was adjusted to the curvatures, but its’ exact dimensions ensured a fully individualized arrangement of catheters, with visible change of penetration depth of the target volume. Moreover, in the first type applicators, the catheter placement was laborious because it was necessary to maintain a high accuracy to position the catheters correctly.
Another problem was using hot glue to fix the catheters on the surface of bolus, which had a such high temperature that the catheters could melt. In the second type applicators, this was not the problem, because the catheters had to be inserted only in previously designed channels. A critical aspect to be considered was the curvature of the applicator tracks, which had to be small enough to ensure easy placement of the catheters and the source run during treatment. At the same time, it needed to be large enough to ensure accurate fit at the site of the lesion. However, this was not a laborious process, and inserting the catheters into already printed applicators proceeded without a problem.
In a study conducted by Jones et al. [9], HDR surface brachytherapy applicator was designed to be similar in structure to the second type of applicator in the present study. The patient was irradiated, and the results were very satisfactory. Even though single air gaps occurred, these were only 3 mm and did not affect dose distribution. In a clinical study conducted by Casey et al. [10], an applicator for HDR surface brachytherapy was prepared using an 192Ir source with catheter channels inside its body. A much better fit and smaller air gaps were noted compared to a cast applicator. Institutional dosimetry target was 90% isodose coverage of CTV. With the usage of 3D-printed applicators, the following parameters were achieved: 95.7% CTV coverage with 90% isodose, minimum dose (0.1 cm3) was 86.9%, median dose was 103.6%, and maximum dose per surface skin was 127.9%.
The material used to print the applicators is also an essential issue. Both Kim et al. [11] and Burleson et al. [12] printed 3D boluses designed around the nose structure of RANDO phantom. Kim et al. used ABS as their printing material. The bolus adhered well to the surface in a reproducible manner and was a suitable dose-escalation material, based on anthropomorphic phantom dosimetry tests. Burleson et al. evaluated both acrylonitrile butadiene styrene (ABS) and PLA materials, and found that they can be modeled appropriately in Eclipse planning system, with less than 0.5% difference in calculated and measured dose.
In the present study, the applicators were printed from PLA using FDM technology, in which fibers are extruded in a form of a sieve or a honeycomb. Therefore, even prints with a highest filling density would have air gaps on a less than a millimeter scale. However, the existing air gaps do not make the model useless for radiation dosimetry [13]. Marchant van der Walt et al. scanned several PLA samples and measured Hounsfield units (HU) to determine relative electron density, mass density, and mass attenuation. Their results were compared with several commercially available tissue phantoms with different properties and strength tests for radiation damage. The authors concluded that PLA is an effective and safe thermoplastic material for bolus use in photon and electron therapy [14]. Dancewicz et al. assessed radiological properties for various photon energies [15]. In connection with [14], printing PLA applicators using FDM technology was acceptable, allowing to obtain suitable material parameters.
Current dose calculations for brachytherapy are usually based on the Association of American Physicists in Medicine Task Group 43 (TG-43) guidelines, which approximate patient’s geometry as a sufficiently large water phantom, ignoring patient’s and applicator’s geometry and heterogeneity. In case of 192Ir used as a source of radiation, the influence of material heterogeneity is less significant due to lower share of photoelectric effect. In a study, Melhus and Rivard [16] concluded that for 192Ir, material’s inhomogeneities were insignificant for sources less than 10 cm away. In fact, in HDR brachytherapy, positioning error of less than 1 mm can lead to more than 10% of local dose differences due to rapid dose fall-off around 192Ir source. In general, due to the low energies used in brachytherapy, law of inverse-square dominate dose reduction by absorption and dispersion. Especially with low-cost 3D printers, geometric accuracy of the printed object can be highly-dependent on printing parameters, which require a specific quality assessment for medical applications. It is evidenced by a study by Ricotti et al. [17], in which an applicator was printed using FDM technology, adequate in its’ construction and operation principle to commercially available Freiburg flap applicator. For dosimetric verification, EBT3 radiochromic films were used. The doses were measured with a 3D-printed applicator that closely followed the doses calculated with a commercial applicator. The results of gamma function tests using the objective test criteria of 3%/3 mm were higher than 94% [18].
BT3 radiochromic films were used to measure the doses deposited in Alderson anthropomorphic phantom using the designed applicators. Proper verification of the deposited doses was strongly dependent on the series of films used and the scanner itself. Therefore, calibration was performed before starting the assessment of the deposited doses using the designed applicators. In an experiment conducted by Sukhikh [18], the characteristics of one batch of GafChromic EBT3 polymer film for electron beams of 10 MeV and 2 MeV, and photon beams of 10 MV and 70 kV were investigated. The obtained relationships showed the same film response in terms of uncertainty for electrons with 2 MeV and 10 MeV energies. However, there is a significant difference for photons with 70 kV and 10 MV energies. The obtained calibrations qualitatively agree with manufacturer’s specifications, suggesting that EBT3 films can be used to measure doses within a range of 0.2-40 Gy [18]. On the other hand, Massillon et al. [19] showed that EBT3 film is energy-independent at doses above 100 cGy and energies greater than 100 keV photons, making it useful for 192Ir source, which average photon energy is 380 keV. However, in Sukhikh et al. study [18], dose deposition was conducted using a linear accelerator. It facilitates calibration due to trouble-free positioning of the film at any distance from radiation source, and obtaining a uniform dose distribution in the entire fragment subjected to the deposition.
In the current study, the irradiation of film with a dose was very difficult due to 192Ir-point source. That is why the uniform system proposed by Singh [20] was used for irradiating the films. In this approach, activating a single-dwell position in two catheters placed on both sides of the film ensured a reduction of signal value uncertainty relating to the deposited dose in the area subjected to verification. This setup was built using a phantom printed in FDM technology using PLA material. A study conducted by Oare suggested that the use of PLA for a calibration of EBT3 dosimetric foil was acceptable [21].
There are some difficulties involved in using radiochromic films to measure a dose. The first problem was that the films were trimmed to the curvature, in which the applicator contacted the phantom surface. This approach resulted in damaging laminate layers, and therefore, no dose was recorded in these areas. In addition, this dosimeter requires reasonable accuracy during positioning, because the slightest shift may cause uncertainty of a dose measurement in a different location than planned. Despite very high resolution of the films, the gamma analysis was limited since TPS exported the dose with a resolution of 1 pixel/1 mm2.
A comparative analysis of doses planned in Oncentra® Brachy TPS for the designed applicators with doses deposited in radiochromic films was conducted using two-dimensional gamma analysis Omni’Pro I’mRT software. This analysis has been used for many years in clinical practice for IMRT plans before their approval. As recommended in the AAPM TG-119 Report, the level of acceptability should be 90% for points analyzed in compared area for less than or equal to 1 for 3%/3 mm criteria. However, it needs to be emphasized that there is a fundamental difference in dose gradient when using external beam compared to a point source. In brachytherapy, there would be significantly larger dose ranges in small volumes.
In this study, different criteria were used due to high-dose gradient, resulting in 1%/1 mm and 2%/2 mm for each applicator, with 95% acceptability level. The initial dosimetric analysis was for the 2%/2 mm level, and each of the two types of applicators designed met the established criteria. Therefore, it was concluded that the analysis at a level of 1%/1 mm would be acceptable. Nevertheless, despite such strict standards concerning clinically proposed guidelines, the results of the present study were very satisfactory. Only one of the second type applicators, located in the ear region, met the acceptability of 95%, with the compliance rate of 97.45%. However, if the AAPM TG-119 guidelines were followed and if the level of acceptability was of 90%, both types of applicators would meet the criteria. Only an applicator with a thickness of 10 mm located in the eye region did not meet the standard, as the compliance rate was 89.69%. It should be emphasized that 90% agreement of the analyzed points corresponds to a 3% difference in the dose and a 3 mm shift. On the other hand, when comparing two-dimensional gamma analysis for the two types of proposed applicators concerning each location of the target volume, there are no significant differences. A surprisingly good dose to the agreement may be the effect of relatively sizeable and analyzed region receiving low doses. Most likely, higher discrepancies could be found in areas closer to active dwell positions. The issue of dose consistency in the treated volumes (high-dose regions), where dose gradient is steeper, should be explored in the future. The maximum dose measured in areas that underwent gamma analysis was 68.9% of the prescribed dose, with a significant part of the films receiving doses lower than 25% of the prescribed dose. These results are not as impactful prevailing one over other type of applicator. It should be stressed that preparing the second type of applicators was much faster due to design of the channels for the catheters. The distance from the source to the target volume itself was also not significantly different, as the tracks were approximately halfway through the bolus thickness. Therefore, for both applicators, the distance was approximately 5 mm. Considering repeatability of the application, the second type of applicators seems to be more practical. In the 5 mm thick applicators, there is a risk of their detachment due to gluing of catheters.
In summary, the applicators seem to be suitable for clinical use. Both the first and the second types of applicators are appropriate. However, considering a more efficient manufacturing procedure, using the second type of applicators would be more justified. In clinical practice of brachytherapy, cooperation with the patient is crucial and dynamic, and time is of significant importance. Sticking catheters in 5 mm thick applicators is time-consuming, and therefore, more time dedicated to this procedure is needed. As already mentioned, there is a risk of applicators’ detachment. Therefore, the 10 mm thick applicator is a more practical solution, which should be introduced into clinical practice due to excellent results of comparative analysis.
Conclusions
The process of preparing applicators for surface brachytherapy in 3D printing technology was developed. A method for measuring the dose around the applicators was compiled using EBT3 radiochromic film in anthropomorphic phantom. The planned doses in the treatment planning system were compared with the measured doses. The obtained results confirm the agreement of the planned and measured doses at an appropriate level, the analysis of the gamma parameter at a 1%/1 mm level. Based on the current study on the applicator preparation process and the obtained dose distributions, the potential clinical usefulness of brachytherapy applicators using fused deposition modeling was confirmed.


