
Purpose
Low-dose-rate brachytherapy (LDR-BT) is a treatment recommended for patients suffering from low-risk or favorable intermediate-risk prostate cancer [1-3]. For this purpose, specific radioactive seeds (typically, iodine-125 [125I] or palladium-103 [103Pd]) are inserted permanently inside the prostate using dedicated transperineal needles, which are manually or semi-automatically introduced [4, 5]. LDR-BT can be performed without any pre-planning, but the number of seeds to be implanted depends on prostate volume. Providers of technical devices often recommend ordering a satisfactory number of seeds for patient, according to expected prostate volume. It is then reasonable to add a volume margin (for example 10%) or to add supplementary seeds (e.g., 10) in order to have sufficient number of seeds for treatment. As a consequence, the amount of unused seeds after treatment can vary widely. Since the volume of prostate as measured during treatment may differ from the expected one, there may remain a high number of unused radioactive seeds, which need to be stored and managed according to legal and strict radiation protection procedures. These remaining seeds are usually stored for natural decay and later returned to manufacturer. For a center treating 100 patients a year, a mean of 20 unused seeds per patient would lead to an annual amount of 2,000 unexploited radioactive seeds. This is both costly and time-consuming, not to mention the environmental impact of such an amount of unused radioactive sources. In this context, the aim of the present study was to propose a tool able to predict the exact number of seeds required for a given patient. As stated above, general recommendations are sometimes provided by manufacturers; however, it quickly becomes clear to develop prediction methods, specific for each institutions’ prostate LDR-BT technique and its constraints [6]. In the past, studies have been conducted in an attempt to build practical tools, from curve fitting [7, 8] to nomograms [9]. However, these interesting methods are somewhat out-of-date [10, 11], and may no longer correspond to today’s medical devices or practical habits. Others approaches are specific to certain dose prescriptions, e.g., 125 Gy [12], or restricted to certain radionuclides, such as 103Pd [13]. For this reason, the method proposed here was based on machine-learning applied to an existing database to build an abacus able to predict the exact number of necessary seeds for future patients.
There were several objectives of the study. First, dosimetric and efficiency data from 409 successive treatments were presented. This database was then used in a systematic machine-learning approach to find an algorithm with satisfactory predictive capability. Finally, this algorithm was chosen to generate an abacus representing past experience and capable of predicting the number of seeds for future patients, which was based solely on the expected prostate volume and estimated before treatment. The abacus was also assessed in an independent series of 38 new patients.
Material and methods
Technical platform and LDR-BT database
Database consisted of a set of 409 treatments performed by a dedicated LDR-BT team in our hospital between January 2015 and November 2020. Each patient had a series of 125I radioactive titanium-coated seeds inserted in his prostate, using a conventional implantation pattern, with approximately 75% of the seeds at peripheral part of the prostate and 25% deeper inside the organ. Treatments were planned intra-operatively only, with no pre-planning. Technical solution was supplied with BARD Medical Division, using B-mode endorectal echography (BK Medical) and VariSeed v. 9.0 treatment planning system (Varian Medical Systems). Endorectal probe was monitored using a dedicated stepper (Civco EX3). Prescription dose was set at 160 Gy to the prostate, with specific dosimetric constraints for both urethra and rectum as organs-at-risk.
Considering seed strength, there were two main strategies, one advocating the same activity for all patients, the other adapting activity to the expected prostate volume Vpi [10, 11, 14]. We have chosen the latter approach with the following activities: 0.398 mCi for Vpi < 25 cm3, 0.460 mCi for Vpi < 40 cm3, 0.498 mCi for Vpi < 50 cm3, 0.543 mCi for Vpi < 60 cm3, and 0.585 mCi for Vpi = 60 cm3 (1 mCi = 1.27 U = 1.27 cGy cm2/h for 125I). Prostates with a volume less than 25 cm3 are generally considered very small, and dosimetric planning becomes more challenging in such cases, especially with regard to the risk of hot spots for urethra and rectum. For this reason, seed strength is significantly reduced when Vpi < 25 cm3, in order to facilitate planning. To conclude, it is important to note that seed strength should be fixed in advance as a function of Vpi.
A list of 25 dosimetric and efficiency parameters was carefully reported at the end of each treatment. For the prostate, parameters, including expected or pre-implant volume, volume measured during treatment, D90%, V200%, V150%, V100%, and V90% were assessed. Concerning organs-at-risk, D10% and D30% were evaluated for the urethra, while D2cm3, D0.1cm3, and V100% were assessed for the rectum. The expected prostate volume was a pre-implant rough estimate obtained from an ellipsoid that was manually drawn on echography during biopsy procedure [15, 16]. This volume estimation was made a few weeks before the actual treatment day. Volume measured during treatment was obtained by means of a meticulous manual delineation on 1 mm transverse B-mode ultrasound slices. Measurement of this volume on the day of treatment was performed in two steps. First contouring was performed before the insertion of needles in order to exploit good quality of ultrasound images, without metallic artefacts. This contouring was then adjusted after insertion of the needles to account for any deformation of the prostate caused by oedema.
From now onwards, the expected or pre-implant prostate volume would be referred to as ‘Vpi’, while the prostate volume measured during treatment would be referred to as ‘Vt’. The number of inserted needles (both peripheral and internal) and the number of implanted seeds (both peripheral and internal) as well as the amount of radioactivity, total, peripheral, internal, and per seed, with quantities of ordered and delivered seeds were all documented.
Data selection for machine-learning training
Data features used to train machine-learning algorithms for regression purposes significantly influence performance that can be achieved. Irrelevant or partially relevant characteristics can negatively impact model performance. Additionally, it is important to reduce data redundancy to limit overfitting and to improve accuracy. In this context, not all data were used in the current study. More specifically, linearly dependent parameters or those clearly uncorrelated to the number of seeds or, on the contrary, perfectly related to the number of seeds, were removed from the treatment database.
Two classical data preparation methods were also tested to possibly improve performance of prediction. The first method was standardization during which, features values were transformed to a Gaussian distribution, with a mean of zero and a standard deviation of 1. The second method was scaling, where features values were re-scaled into the range of 0-1.
Machine-learning assessment
The objective was to find an algorithm able to correctly predict the number of implanted seeds. However, it is impossible to predict in advance an algorithm that is best suited to a given database. For this reason, a systematic approach was used, in which classical machine-learning algorithms, well-adapted to regression, were analyzed and compared. Non-linear algorithms were support vector machines for regression (SVR) [17], K nearest neighbors regressor (KNN) [18], multilayer perceptron (MLP) [19], and classification and regression trees (CART) [20]. Linear algorithms included ElasticNet (EN) [21], Lasso regression [22], and Ridge regression [23]. Also, CatBoost [24] and XGboost [25] classical gradient boosting approaches were tested.
The key to a correct comparison of machine-learning algorithms is to ensure that each algorithm is trained in the same way and on the same data. In this context, ten-fold cross-validation was used to obtain reliable statistics during training process. Eighty percent of the whole dataset (i.e., 327 treatments) were used for this purpose, while the remaining 20% were used for testing a trained model on an independent set of treatments. Comparison of predictions was quantified with coefficient of determination R2, with best possible score of 1. Training and testing of algorithms were performed using Python v. 3.7.6, scikit-learn v. 0.22.2 open-source toolkit [26], and Keras v. 2.3.1 for MLP implementation.
Abacus for future patients
An algorithm that obtained the best R2 score in predicting the number of seeds from the dataset was used to build a practical abacus. From clinical point of view, the only parameter available prior to treatment was the pre-implant prostate volume Vpi, whereas the analyzed algorithms were trained and tested on a wide series of data obtained principally at the end of treatment. As a consequence, such a trained algorithm could not be used directly for upcoming patients. Therefore, the clinical dataset was transformed to generate an artificial dataset, where each treatment feature value was replaced by a predicted value. For the sake of simplicity, the algorithm, which obtained the best score in predicting the number of seeds, was also used in successful prediction of each feature of the dataset for a given Vpi. Hence, the artificial dataset consisted of one series of individually predicted feature values for each Vpi from 20 cm3 to 60 cm3. In the last step, for each Vpi and its own set of predicted features, the prediction of number of seeds St was obtained by applying a trained algorithm. The abacus was composed of the predicted St value for each Vpi.
Finally, the obtained abacus was applied to an independent series of 38 records of new patients to evaluate real savings in seeds compared to manufacturer’s method. This comparison was made from a practical clinical perspective. The expected prostate volume was measured for each patient during biopsy, and a 10% margin was added as a usual precautionary measure. The number of seeds to be ordered was then calculated on the basis of this 10% increased volume, using the manufacturer’s method on the one hand, and the abacus on the other. The remaining number of seeds was then calculated after the treatment, according to the number of seeds actually implanted. It should be noted that in practice, the abacus was effectively used to order the seeds.
Results
Table 1 summarizes the 25 dosimetric and efficiency features analyzed from 409 treatments of the database. Figure 1 provides an overview of the real number of implanted seeds, with respect to the pre-implant volume Vpi and Vr prostate volume measured during treatment Vr. Mean values for Vpi and Vr were 41.8 ±10.0 cm3 (min = 20, max = 65) and 42.6 ±11.3 cm3 (min = 18.0, max = 71.6), respectively, while the mean number of implanted seeds was 64.2 ±9.0. In sixty-seven patients, the number of remaining seeds was equal or more than 20, with a maximum of 37 remaining seeds. Circles at regular intervals, such as 25 cm3, 30 cm3, and so on, were more frequent, because values were very often rounded by the operating physician.
Fig. 1
Number of implanted seeds according to the expected and measured prostate volumes. Each of the 409 treatments is represented twice: small black dots correspond to prostate volume measured with echography during brachytherapy procedure, while circles correspond to pre-treatment prostate volume estimation. Empty circles refer to cases, where the number of remaining seeds was lower than 20, whereas full circles describe the cases where this number was higher than 20
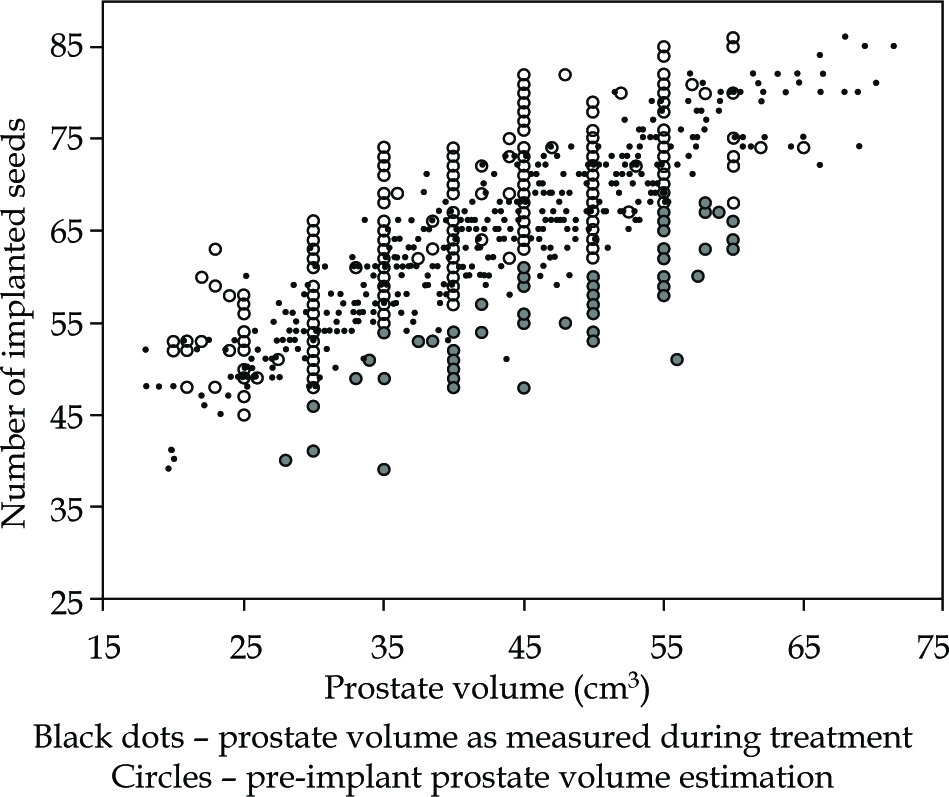
Table 1
List of efficiency and dosimetric parameters reported after each treatment. Eighteen features (underlined) were used for machine-learning evaluation. For 125I source strength, 1 mCi = 1.27 cGy cm2/h
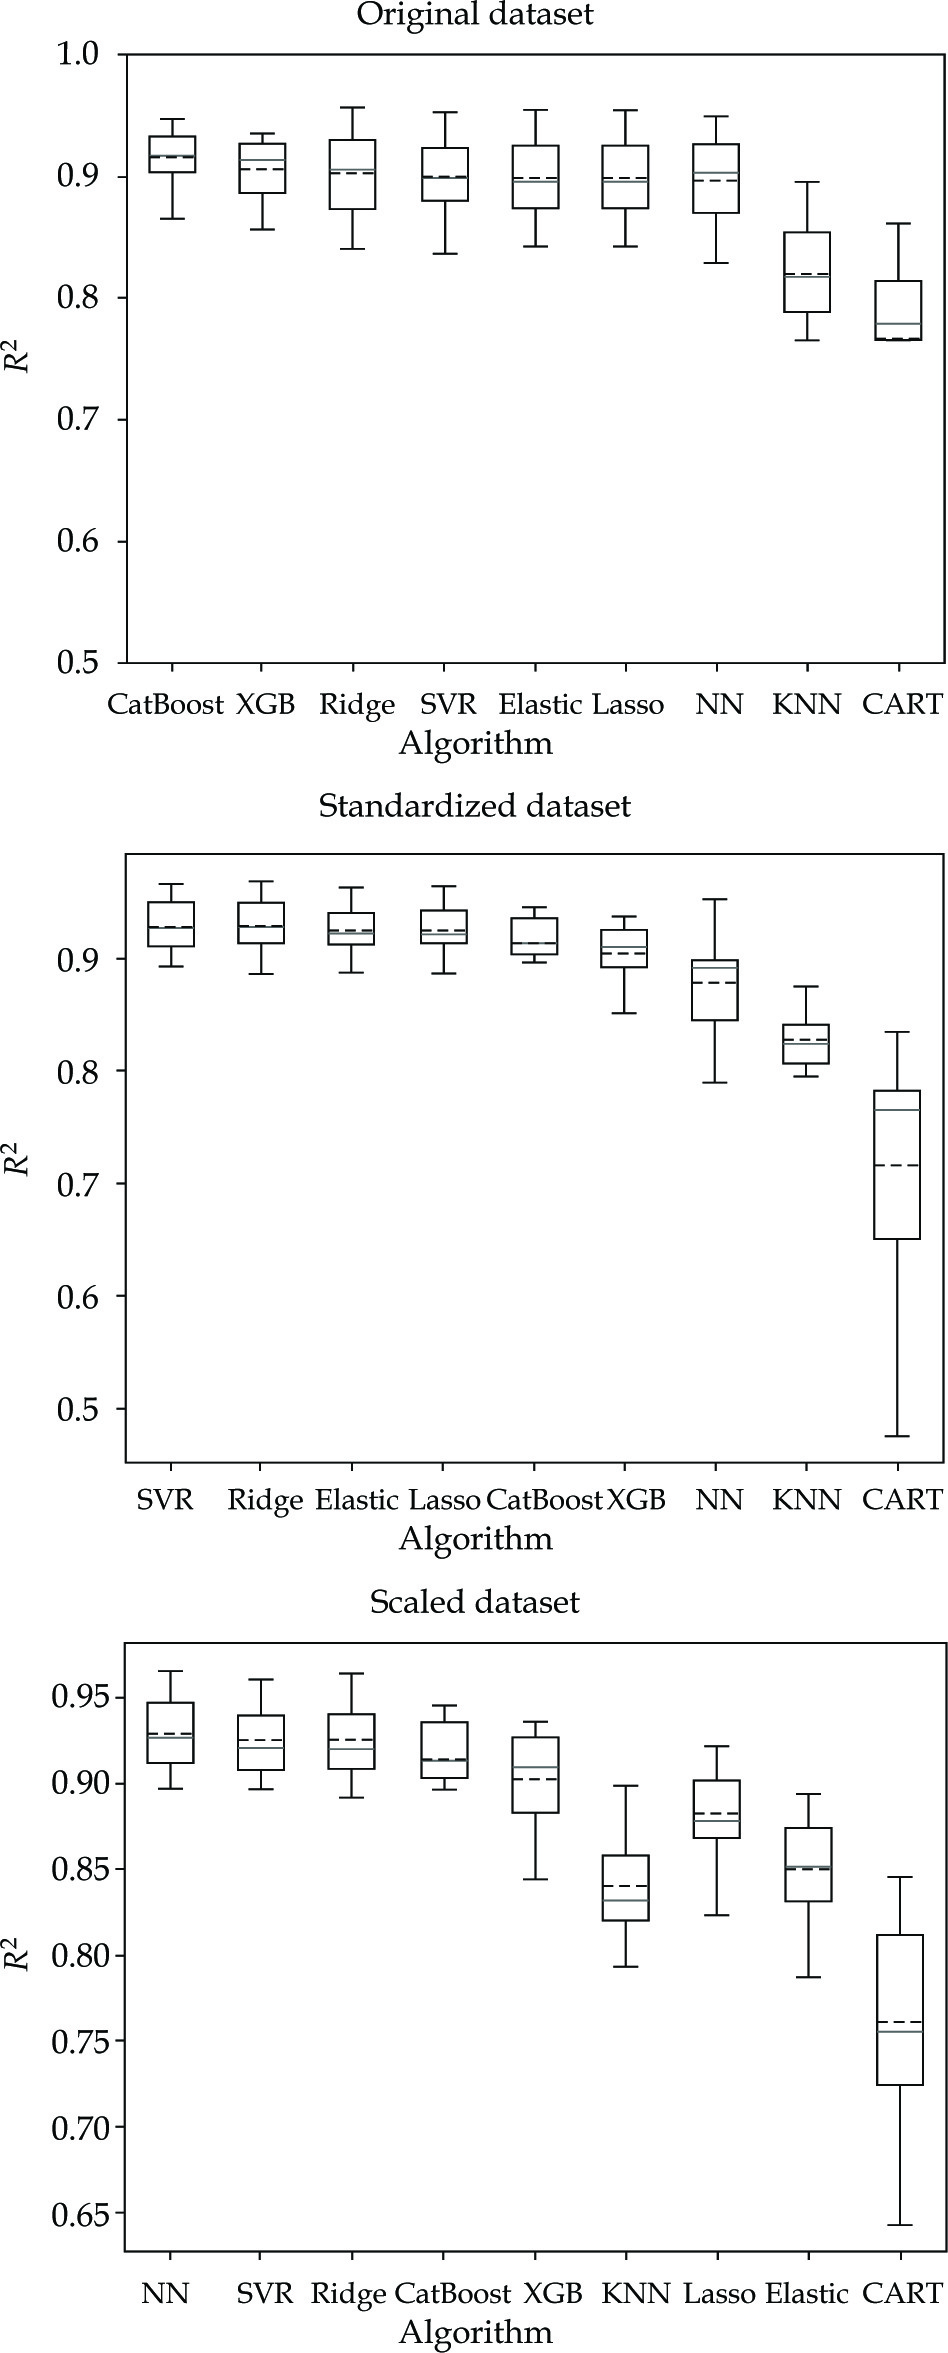
Concerning the machine-learning analysis, only 18 features out of initial 25 were used to reduce redundancy and overfitting. It was indeed ineffective to consider the total number of needles Nt, when internal Ni and peripheral Np needles were already known. Total, peripheral, and internal activities in mCi were also discarded due to direct correlation with the numbers of implanted seeds. The 18 features used are presented in Table 1, which are underlined. Coefficient of determination R2 using 10-fold cross validation on the trained dataset is described in Figure 2 for each tested algorithm. The best result was obtained by using SVR algorithm on standardized data, with a 0.928 ±0.023 R2. Once trained, this SVR model was applied to an independent test in dataset and the value of obtained R2 was 0.948, while mean square error, median absolute error, mean absolute error, and maximum error were 5.58, 1.31, 1.78, and 7.14, respectively. When the trained SVR model was applied to the whole set of 409 treatments, these values became 2.55, 0.92, 1.21, and 7.29, respectively, with R2 of 0.968. The maximum error of 7.29 seeds could be compared to the 67 treatments, where the number of remaining seeds was 20 or more (Figure 1).
Fig. 2
Performance of algorithms. From top to bottom: without data pre-processing, with standardized data, and with scaled data. The aim of regression was to predict the exact number of implanted seeds from 18 pre-selected features. The overall best result was obtained with SVR on standardized features, while CatBoost and neural networks performed well on raw data and scaled data, respectively. Plain and dash lines inside the boxes indicate median and mean values, respectively
Considering the satisfactory R2 results in both trained and tested parts of the dataset, the SVR model was chosen to build a practical abacus able to predict the number of seeds from the expected prostate volume only. For this purpose, an artificial dataset was generated by successively computing values for each of the 18 features. The same process as previously described was used, but instead of predicting St, each of the 18 features was predicted independently and successively, leading to a whole predicted dataset, computed from the real data. As a final step, SVR was applied to this synthetic dataset to generate St values for each possible Vpi value. The obtained abacus is presented in Figure 3A, while the significant numerical values are summarized in Table 2. The corresponding total activity is shown in Figure 3B, and would be useful for users who wish to choose different seed strengths than those proposed in the current study.
Fig. 3
Abacus obtained from trained SVR algorithm applied to artificial dataset. A) This abacus (plain line) is specific to our center and considers the 409 treatments. The number of seeds that is predicted according to the pre-treatment prostate volume is always lower than the result obtained with suggestions of manufacturer. Also, there is a noticeable difference when comparing with mean number of seeds. In particular, SVR model tends to predict more seeds than the mean value for Vpi < 40 cm3, and less seeds than the mean value for Vpi > 40 cm3. B) Corresponding total implanted activity according to the abacus (grey disks) and from experimental mean values (black squares). Polynomial fitting is also indicated
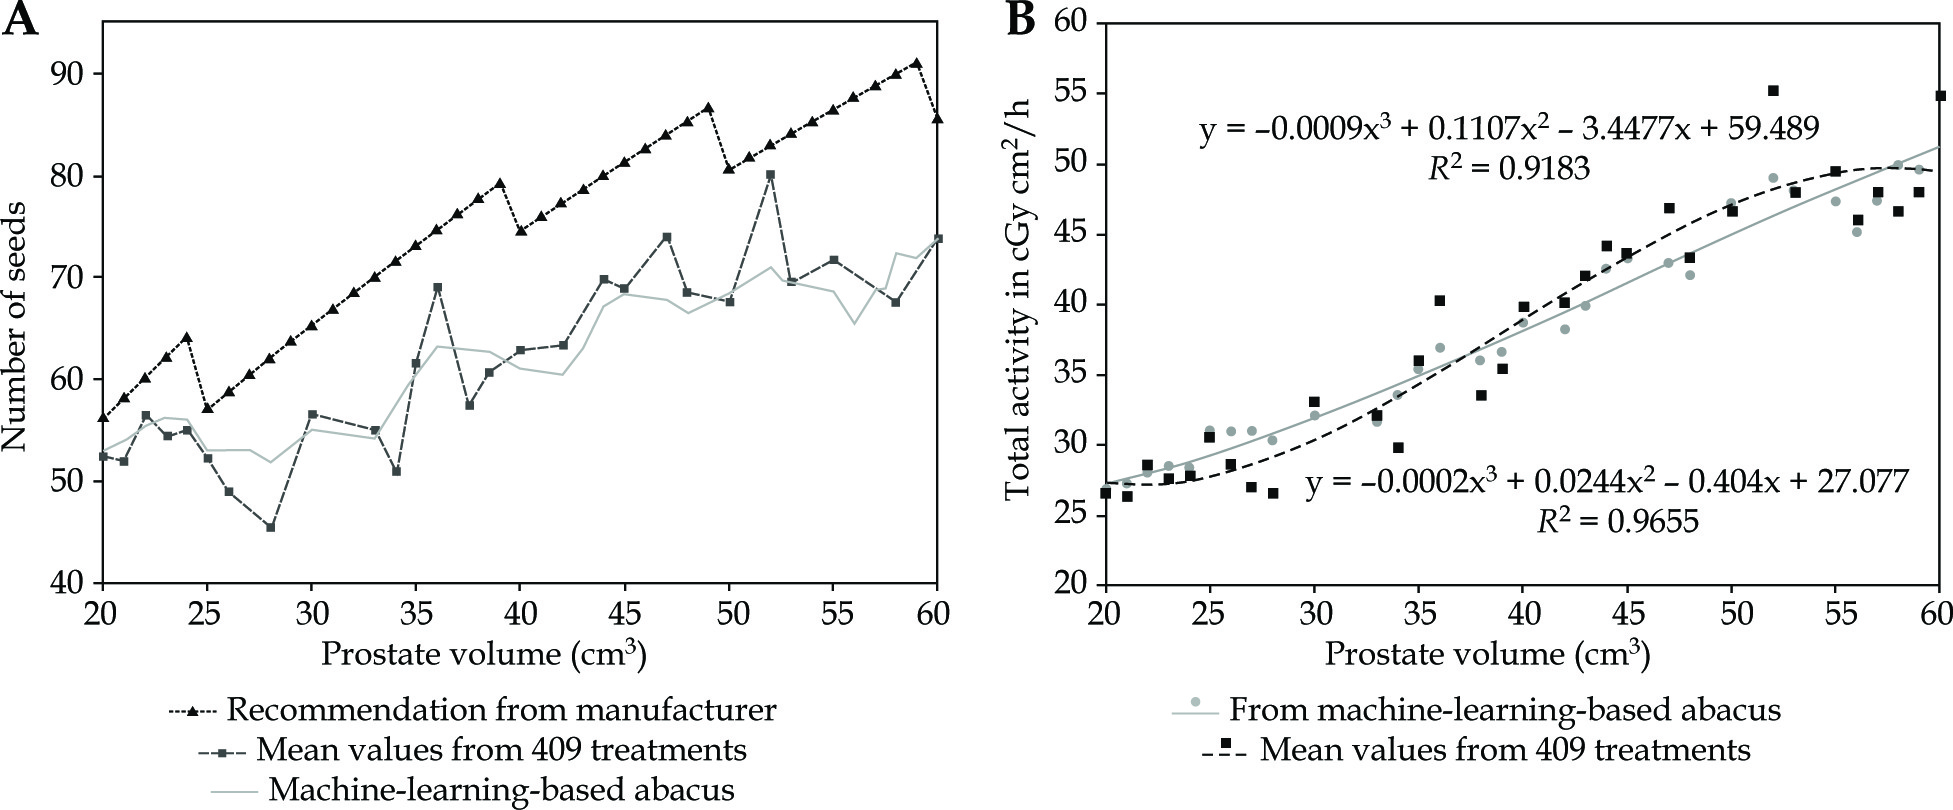
Table 2
Predictive number of seeds according to pre-treatment prostate volume estimates. These values are now routinely used for our new patients. Seed strength is given in U (cGy cm2/h), with 1 U = 0.787 mCi for 125I
| Pre-implant prostate volume (cm3) | Suggested seed activity (U) | Expected number of seeds |
|---|---|---|
| 20 | 0.506 | 53 |
| 25 | 0.584 | 53 |
| 30 | 0.584 | 55 |
| 35 | 0.584 | 60 |
| 40 | 0.633 | 61 |
| 45 | 0.633 | 68 |
| 50 | 0.690 | 68 |
| 55 | 0.690 | 69 |
| 60 | 0.743 | 74 |
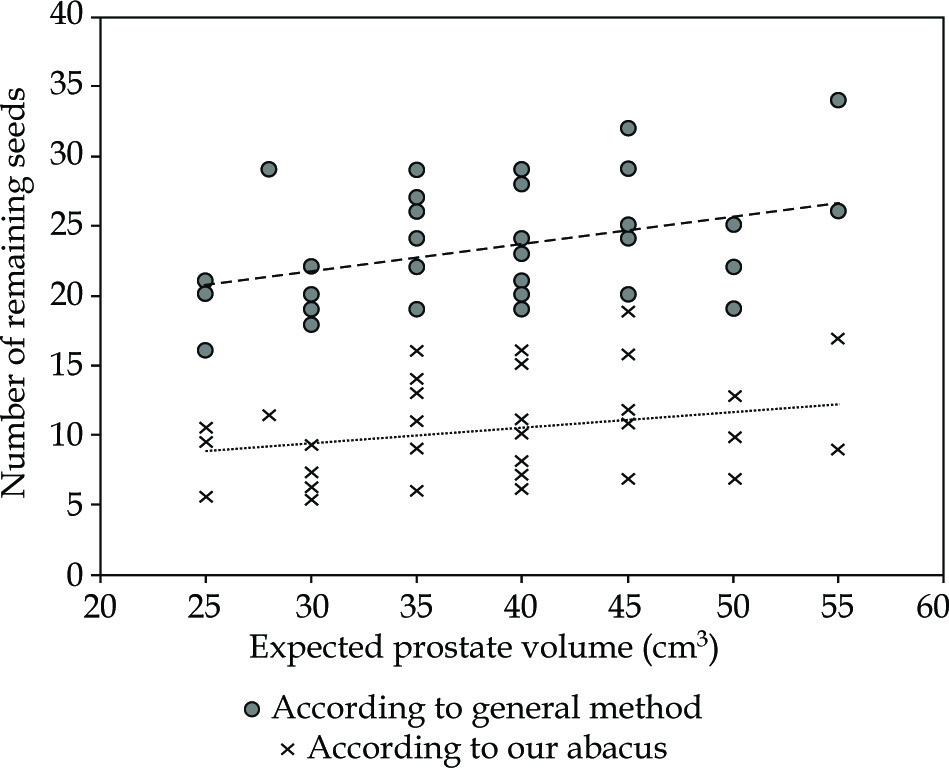
Results of the actual use of this abacus in 38 other patients as well as a comparison with the conventional method are described in Figure 4. Overall, in these 38 treatments using the abacus, a reduction of 493 seeds (886 remaining seeds for the method suggested by the manufacturer vs. 393 using the abacus) was obtained. It is important to note that a 10% margin was added in both cases to limit the probability of running out of seeds.
Discussion
Low-dose-rate brachytherapy remains a key treatment for the prostate, and still benefits from both technological innovations [27-30] and clinical research [31-33]. The number of seeds implanted in the prostate during a procedure mostly depends on the volume of prostatic gland. This latter can be estimated before treatment in order to predict a sufficient number of seeds, but the precise delineation performed during treatment may lead to a different measured volume (Figure 5). There are many reasons for this. First, pre-treatment volume is estimated using approximated methods, most of the time based on three axes, which define an ellipsoid theoretically similar to the shape of the prostate. Second, in the day of actual treatment, the volume is measured by careful delineation of the prostate slice by slice using endorectal echography. Another reason is an inflammation that sometimes occurs after insertion of needles, with an increase in prostate volume due to oedema [34]. As a consequence, the expected (pre-implant) and actual (during treatment) volumes differ. Providers of medical devices propose general methods for ordering the seeds that are necessary for a correct dosimetric coverage of the prostate. However, these methods are recommendations that cannot be specific to all habits and objectives of every team performing brachytherapy. Each center has its own procedure and material for estimating the volume before treatment. In the same way, experience may influence brachytherapy team to adopt new choices of dosimetric objectives and doses to organs-at-risks, which can lead to more or less number of inserted seeds for a given prostate volume. As the number of patients increases, manufacturer’s recommendations may become unsuitable to local practice. For these reasons, the number of remaining seeds per patient may become very high. This poses a problem in terms of material management, cost-effectiveness, and working time, not to mention an environmental impact of unnecessarily produced radioactive sources. In this context, it seems logical to imply a method capable of calculating the number of seeds for future cases according to already treated patients, giving the habits of team involved.
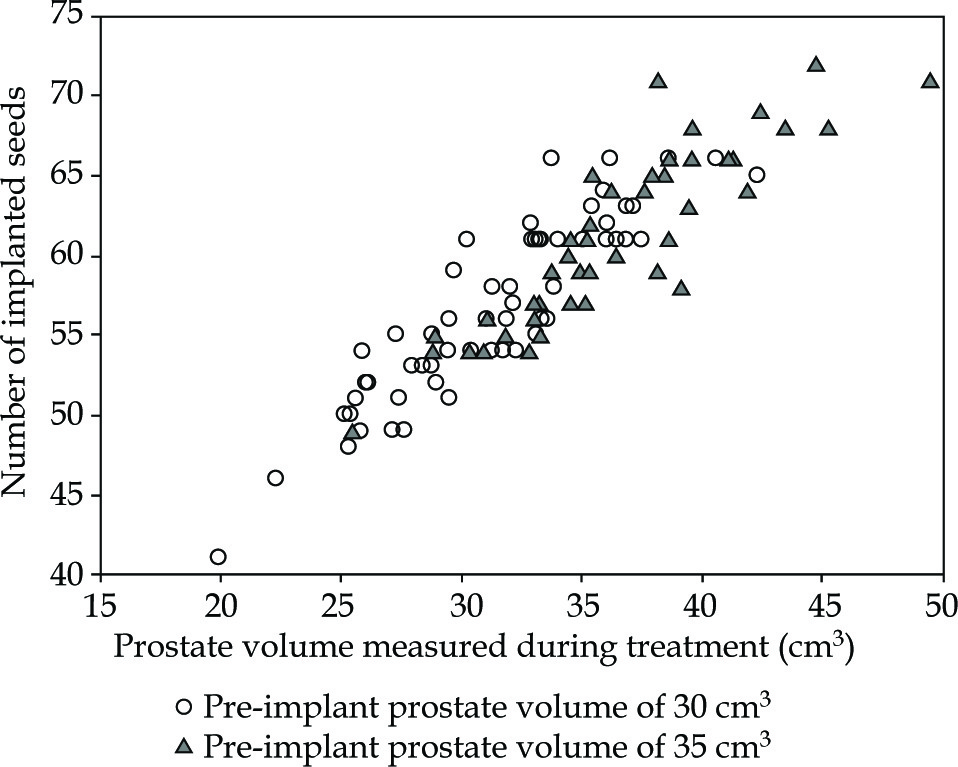
Fig. 5
Number of implanted seeds for 30 cm3 (circles) or 35 cm3 (triangles) pre-implant prostate volumes. One can observe that the real prostate volume measured carefully during treatment can be different from the pre-treatment measurement. These two populations can have similar prostate volumes measured during brachytherapy, but the number of ordered seeds will differ, since a pre-implant volume vary (either 30 cm3 or 35 cm3). Values actually measured during treatment were 31 ±4 cm3 and 36 ±5 cm3 for 30 cm3 and 35 cm3 volumes, respectively
This was the objective of the current study, in which machine-learning algorithms were applied to a series of 409 consecutive treatments. A simpler solution could have been to choose a mean or median St value for each typical Vpi volume, but the observed numbers of implanted seeds appeared to be complicated and intricated distributions, with significant overlaps between the volumes (Figure 4). Therefore, it seemed reasonable to make the most of all relevant data available, a choice of well-adapted machine-learning technique. The obtained results show that the mean difference between the manufacturer’s recommendation and the proposed abacus was 15.9 seeds (min = 3, max = 24).
When using machine-learning algorithms, it is almost impossible to predict most suitable model for studied dataset. For this reason and to evaluate a series of classical models, cross-validation-based re-sampling method was applied in order to obtain an estimate of accuracy of each model on unseen data. Tested algorithms were the representative of usual approaches with both linear and non-linear models. This systematic approach was simple to acquire a reliable comparison of typical performances during a training process. This was further confirmed by the fact that R2 was found very similar in both trained and tested sets.
As a last comment, it should be noted that the main aim of the study was to propose a practical abacus based on data of our previous patients, and thus specific to the habits of our team. Therefore, a real and classical predictive approach could not be performed since the model was trained and tested within a series of 18 features that were not all available before treatment. That was the reason why we developed a synthetic dataset in order to make a link between previous data and the abacus for future patients. One could suggest that mean values for the 18 features could have been used instead of the predicted ones, but the use of SVR model to generate the expected values for these features was consistent with the present study. The expected numbers of implanted seeds according to principal values of the estimated prostate volumes are provided in Table 2.
Conclusions
In LDR-BT without pre-planning, the prostate volume is estimated before treatment for calculating the required number of seeds. Prostate volume is also measured during treatment using careful manual contouring on trans-rectal ultrasound images. These two obtained values may significantly differ, due to, for example, oedema caused by implanted needles. While it is reasonable to add a safety margin to avoid running out of seeds on the day of treatment, it is important to start with the most accurate estimate possible. The reason is to generate a limited inventory of unused radioactive seeds, which are difficult to manage afterwards. In this context, the machine-learning-based abacus proposed in the present study could help in estimating the exact number of seeds for future patients, since it is based on a solid experience of 409 treatments.


