
Purpose
Apart from prostatectomy, radiotherapy is the most used therapeutic option for localized prostate cancer, with external beam radiotherapy (EBRT), brachytherapy (BT), or both techniques applied. Since mid-1990s, high-dose-rate-brachytherapy (HDR-BT) started to be used as monotherapy [1,2,3] and demonstrated to be an effective therapy, with precise dose distribution, reduced total treatment time and cost as well as increased patient comfort [4,5].
According to evidences accumulated in recent years, prostate cancer appears to be particularly sensitive to fractionation, much more than the healthy tissues also affected by radiotherapy. This sensitivity appears in a low value of the α/β parameter of the linear-quadratic (LQ) model, where to calculate the equivalence between different fractionation schemes used in clinical practice, a value of α/β between 1.5 and 3.0 Gy is usually considered [6]. All of this has led to the proliferation of clinical studies and applications of hypofractionation in HDR-BT for prostate cancer, as in case of EBRT [7,8].
Recently, the possibility of single fraction monotherapy HDR-BT comparable to treatments involving several fractions has been explored. Mavroidis et al. [9] estimated the dose of that single fraction and found that a dose between 19.2 and 19.7 Gy is required to produce a tumor control equal to or greater than that of a scheme with 4 fractions, 9.5 Gy each, specifically 95.9% to 97.8% vs. 93.5% to 97.8%. However, for the latter scheme, a biochemical control probability (BC) at 5 years between 91% and 97% was obtained for low- and intermediate-risk patients [10,11,12], while for the same groups of patients, 66 ±6% and 82 ±3%, both at 95% confidence interval (CI) for single doses of 19.0 Gy [13] and 20.5 Gy [14], respectively, were found.
These differences between predictions and clinical results could be due to the fact that the LQ model is not appropriate for high doses per fraction, requiring some modification in order to be employed in this context [15,16], or the value of the α/β parameter obtained in the region of low doses per fraction is not valid when these doses per fraction are high [17].
In this work, we analyzed the discrepancies between the published clinical results and the predictions of the radiobiological models to determine the value of absorbed dose required in an extreme, single fraction, hypofractionation regime in HDR-BT monotherapy, leading to a biochemical failure rate similar to that of the most widely used regimes. In order to do that, we analyzed the published HDR-BT clinical results, establishing a dose-response relation in terms of BC by means of statistical methods based on a Monte Carlo procedure.
Material and methods
Clinical data analyzed
The clinical data analyzed in the present work were collected after a systematic search in PubMed in January 2019, with key terms including “high-dose-rate brachytherapy” or “HDR brachytherapy”, “prostate cancer”, and “monotherapy”, followed by a more detailed search within the bibliography found in the first step, and by looking for prospective or retrospective clinical studies verifying the following conditions:
HDR 192Ir interstitial BT was the only radiotherapy technique used, without EBRT.
The endpoint considered was BC obtained as 1 minus prostate-specific antigen (PSA) failure, defined as nadir plus 2 ng/ml, according to [18].
The BC at 5 years for the fractionation schemes considered was explicitly provided. Studies in which this endpoint may be obtained indirectly from their outcomes were not considered.
Patients of low- and/or intermediate-risk were included. BC values in both groups together or separately were considered. Studies involving high-risk patients were considered only if BC was applied for low- or intermediate-risk patients, separately.
Table 1 summarizes characteristics of the 13 clinical studies [10,11,12,13,14,19,20,21,22,23,24,25,26] verifying the conditions mentioned above. They include 16 different fractionation schedules, with a number of fractions varying between 1 and 9, for a total of 22 empirical data sets. Table 1 includes dosimetric details of these fractions, the risk group, and the BC at 5 years, with the 95% CI when quoted by the study authors.
Table 1
Summary of the prostate cancer HDR-BT monotherapy data analyzed. The number of sessions, the dose per fraction, d, the total dose, D, the number of patients, the average BC at 5 years endpoint, and its 95% CI are given for low (L)- and intermediate (I)-risk patients. The last two columns show the µ and σ considered in the fitting procedure described in the text. For the study of [21], the total dose and dose per fraction averages were considered. The study [22] was included despite involving three high-risk patients. The BC of [23] is for 6 years
| Reference | Fractionation schedule | Risk | # of patients | BC at 5 years (%) | µ | σ | |||
|---|---|---|---|---|---|---|---|---|---|
| n | d (Gy) | D (Gy) | Average | 95% CI | |||||
| [10] | 4 | 9.5 | 38.0 | L/I | 171 | 91.0 | 91.0 | 2.6 | |
| 6 | 7.0 | 42.0 | 77 | 87.0 | 87.0 | 3.8 | |||
| [11] | 4 | 9.5 | 38.0 | L | 196 | 94.0 | 94.0 | 2.4 | |
| I | 81 | 92.0 | 92.0 | 3.7 | |||||
| [12] | 4 | 9.5 | 38.0 | L/I | 319 | 97.0 | [93.5, 98.7] | 96.1 | 1.3 |
| 2 | 12.0 | 24.0 | 79 | 87.0 | [68.0, 95.1] | 81.6 | 6.9 | ||
| 2 | 13.5 | 27.0 | 96 | 90.0 | [63.8, 97.6] | 80.7 | 8.6 | ||
| [13] | 1 | 19.0 | 19.0 | L/I | 60 | 66.0 | [60.0, 72.0] | 66.0 | 3.1 |
| [14] | 1 | 20.5 | 20.5 | L/I | 60 | 82.0 | [79.0, 85.0] | 82.0 | 1.5 |
| [19] | 9 | 6.0 | 54.0 | L | 15 | 85.0 | [66.0, 100.0] | 85.0 | 8.7 |
| I | 29 | 93.0 | [83.0, 100.0] | 93.0 | 4.3 | ||||
| [20] | 6 | 6.5 | 39.0 | I | 284 | 94.4 | [90.1, 98.7] | 94.4 | 2.2 |
| [21] | 3 | 10.0 | 30.0 | L/I | 19 | 85.1 | [72.5, 94.5] | 85.1 | 5.6 |
| 10.5 | 31.5 | 19 | |||||||
| 11.0 | 33.0 | 19 | |||||||
| 11.5 | 34.5 | 22 | |||||||
| [22] | 3 | 15.0 | 45.0 | L/I | 77 | 96.7 | 96.7 | 3.8 | |
| [23] | 6 | 7.25 | 43.5 | L/I | 448 | 98.6 | [96.9, 99.4] | 98.6 | 0.6 |
| [24] | 3 | 11.5 | 34.5 | L | 198 | 96.1 | [92.4, 99.3] | 96.1 | 1.8 |
| I | 135 | 96.1 | [92.1, 99.9] | 96.1 | 2.0 | ||||
| [25] | 2 | 13.5 | 27.0 | L/I | 119 | 96.0 | 96.0 | 3.1 | |
| [26] | 7 | 6.5 | 45.5 | I | 48 | 97.4 | 97.4 | 4.9 | |
| 7 | 7.0 | 49.0 | L | 26 | 100.0 | 100.0 | 6.6 | ||
| I | 52 | 88.9 | 88.9 | 4.7 | |||||
| 9 | 6.0 | 54.0 | I | 39 | 100.0 | 100.0 | 5.4 | ||
Dose response model
In this study, BC was described by means of [27]:
is the maximum normalized dose-response gradient, and D50 is the total dose needed to achieve BC = 50%.
To compare different HDR-BT schemes, we considered the biologically effective dose [28]:
Here D is the total dose, d is the dose per fraction, and the α/β LQ parameter allows quantifying the sensitivity of fractionation. The equivalent dose EQD2 is defined as the total dose imparted in a scheme with 2 Gy per fraction that produces the same biological effect than another scheme:
BED(EQD2, 2 Gy) = BED(D, d). (3)
Using equation (2) we have:
The total treatment time of the various schemes analyzed was not considered and its effect is not included in equations (2) and (4).
It is possible to establish a dose-response relationship including all the fractionation schemes, in which the total dose D in equation (1) is substituted by the equivalent dose EQD2, and using equation (4) we have:
Statistical methods
The BC data shown in Table 1 were used to determine the free parameters D50, γ, and α/β in equation (5), using the Monte Carlo procedure described below.
1. For each clinical study in Table 1, two parameters were calculated. The first one, μ, was chosen as the average BC provided in the study (column #7 in the Table 1). In three studies of [12], where 95% CI (column #8) is markedly asymmetric with respect to the average value, μ was chosen as the center of the CI.
The second parameter, σ, was calculated as:
for the studies providing 95% CI [(BC)high, (BC)low], and its variation with the number of patients, n, was fitted with the function , with a being the fitting parameter. The data obtained are shown in Figure 1 with symbols and the curve fitted to all these data is the dashed one. If the data shown by open squares, considered as outliers, are not included in the fit, the solid curve is obtained. As both fitting curves produce the same final results, the σ values considered in our analysis were calculated with equation (6) or obtained with the dashed fitting curve depending on availability of 95% CI.
Fig. 1
σ, defined in equation (6) vs. the number of patients n of clinical studies with CI available. The curves are fits of the function σ = a n –½ to all data (dashed curve) and to data shown with solid circles (solid curve), excluding the outliers (open squares). The values of the fitting parameter a in both cases are given
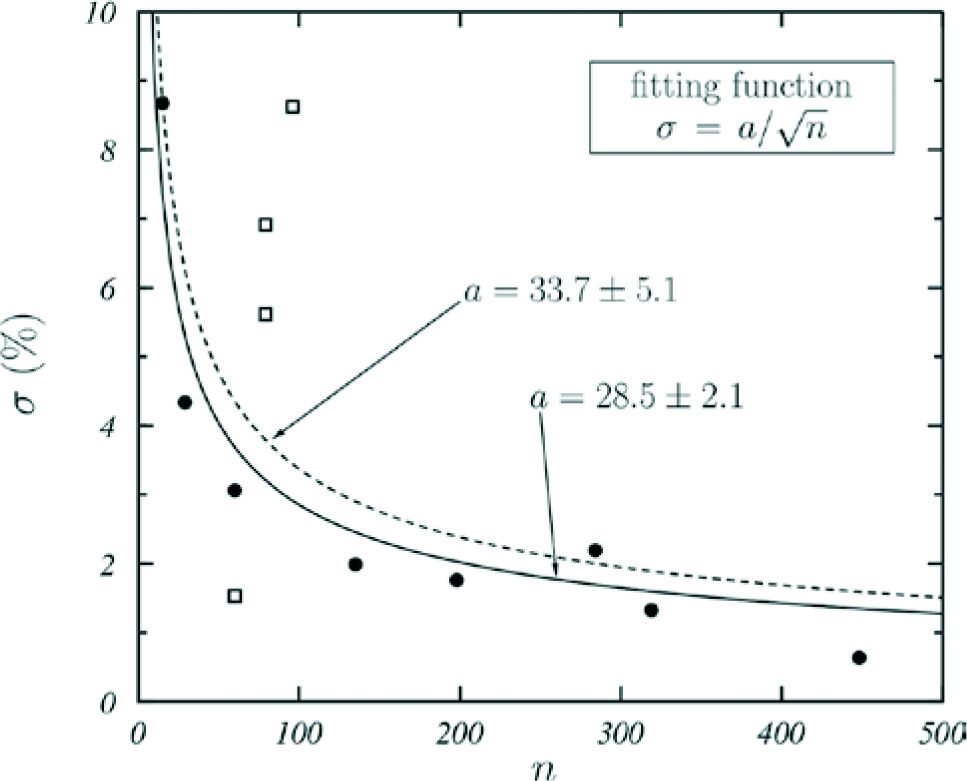
The value 3.92 = 2 × 1.96 in equation (6) is due to the fact that CI corresponds to 95% probability. The μ and σ values used in our analysis are those shown in the last two columns in Table 1.
2. Values of BC were sampled for each clinical study analyzed according to the corresponding Gaussian distributions N[μ, σ], and the function in equation (5) was fitted to the set of values obtained (or subsets characterized by specific fractionation schemes) using the Levenberg-Marquardt method [29]. As a result, the values of D50, γ, and α/β were found. In this process, the distributions were truncated to avoid BC values above 100.
It must be indicated that, in case of asymmetric CI, it is possible to consider other distributions for BC. However, as it has been shown in [30], they produce equivalent results.
3. Step 2 was repeated 10,000 times, thus providing the statistics required to determine the distributions of D50, γ, and α/β. For each of them, the median and the 95% CI were calculated. The uncertainties quoted in this work correspond to these CIs, which are indicated between square parentheses accompanying the average values of the corresponding quantity.
To check the convergence of procedure, fits in which α/β was fixed to a given value were performed. In these fits, D50 and γ were obtained as well as their χ2 per degree of freedom, χ2/v.
Results
We used equation (4) to calculate EQD2 corresponding to the fractionation schemes analyzed, with α/β = 1.5 and 3.0 Gy as the values usually employed in the last years for comparing different fractionation schemes in prostate cancer. BC at 5 years of the various clinical studies are shown in Figure 2, as a function of EQD2 and grouped according to their fraction number.
Fig. 2
BC at 5 years vs. EQD2 calculated using equation (4) with α/β = 1.5 Gy (a), 3.0 Gy (b), and 22.8 Gy (c). Data are grouped according to the number of fractions
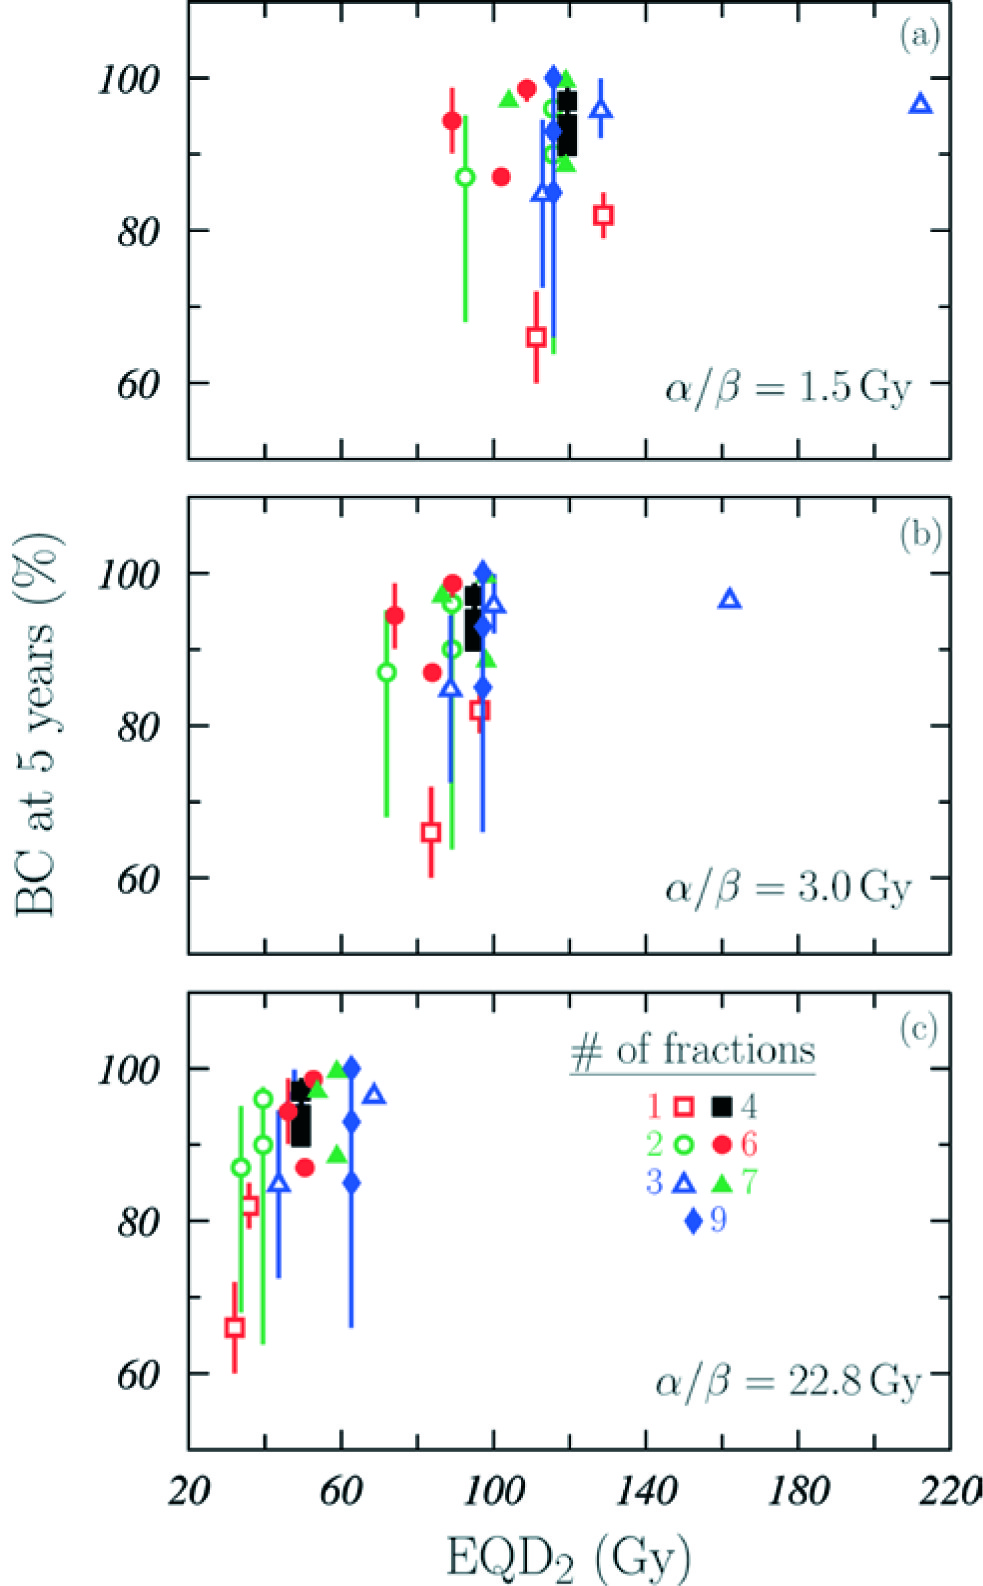
No correlation among the various fractionation schemes was observed, particularly for the two single fraction schemes included (red open squares). This may be due to the fact that the α/β considered could be incorrect. To investigate whether this is the case, we analyzed the data by using the Monte Carlo procedure described above. The results obtained for the medians and 95% CI of distributions of the fitting parameters are shown in Figure 3, with dose d90% additionally given. This is the dose required to produce, in a single fraction scheme, BC = 90% at 5 years, which is approximately the average BC value found for all the studies analyzed.
Fig. 3
BC data vs. EQD2 grouped according to the number of fractions. The results in the inset tables are the medians and 95% CI of the fitting parameter distributions obtained in the Monte Carlo procedure. Solid curves represent the function in equation (5) obtained for the medians of the Monte Carlo fitting parameters. The χ2/v for these fitting curves are given. A) All the data in Table 1 were included in the Monte Carlo analysis. B, C) Only the data with d ≥ 9.5 Gy and d ≤ 11.5 Gy, respectively, were included. Finally, the d90% values are also shown
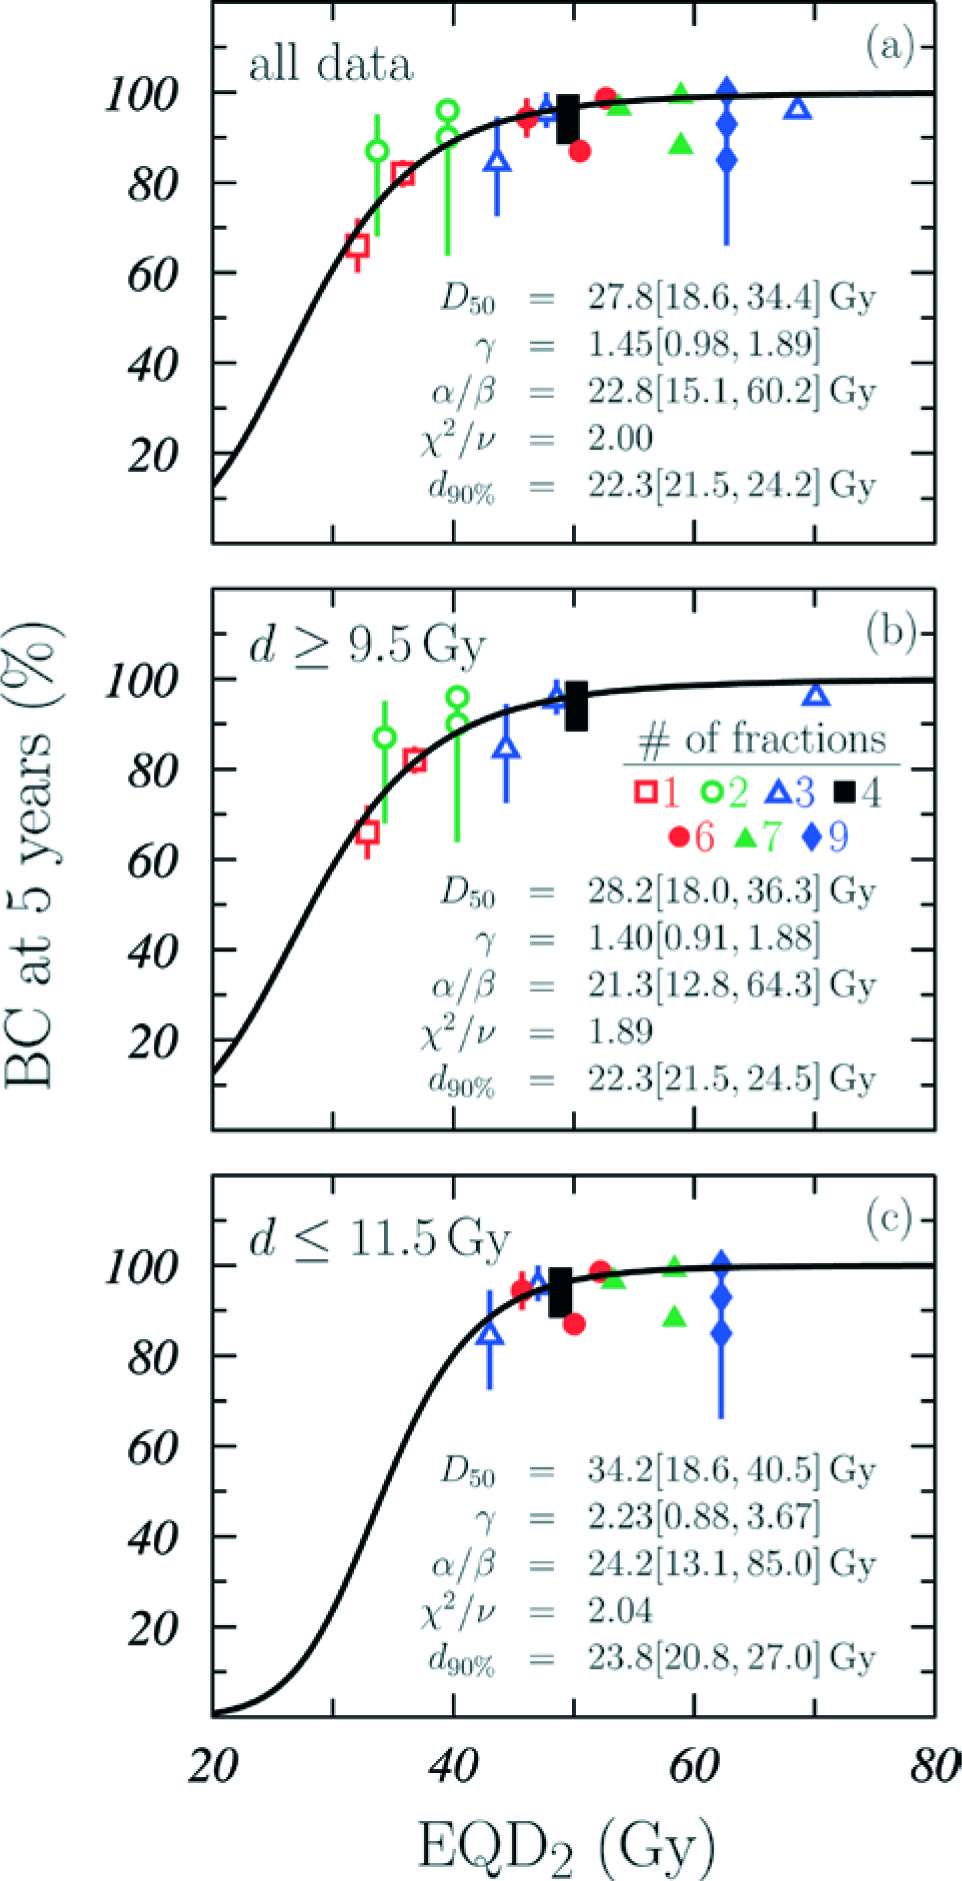
Three datasets were studied. The first one included all the schemes shown in Table 1. The other two corresponded to more restricted regions of dose per fraction, and were considered to study whether the fitting parameters change significantly. We analyzed d ≥ 9.5 Gy, choosing large doses per fraction, where the failure of LQ model has been suggested (e.g. [16]), and d ≤ 11.5 Gy, neglecting the highest doses per fraction and, in particular, the only two studies with a single dose. The curves obtained with fitting parameters determined in the Monte Carlo analysis are shown with solid lines in Figure 3, together with χ2/v values of the fits.
Figure 4 shows the results obtained by fitting the function in equation (5) to all data included in Table 1 for fixed values of α/β. The variation of D50, γ, χ2/v, and d90% with α/β is shown in the several panels. The vertical dotted lines indicate the value α/β = 22.8 Gy, where χ2/v = 1.90 reaches a minimum that corresponds to D50 = 27.7 Gy, γ = 1.45, and d90% = 22.3 Gy. In Figure 2C, we show BC at 5 years of the various clinical studies analyzed as a function of EQD2, grouped according to their fraction number for this value of the α/β parameter.
Fig. 4
Dependence of (A) D50, (B) g, (C) χ2/v, and (D) d90% with α/β. For each value of α/β, a fit of the function in equation (5) to all the data considered in the present analysis was performed. Vertical dotted lines correspond to α/β = 22.8 Gy, where χ2/v reaches a minimum
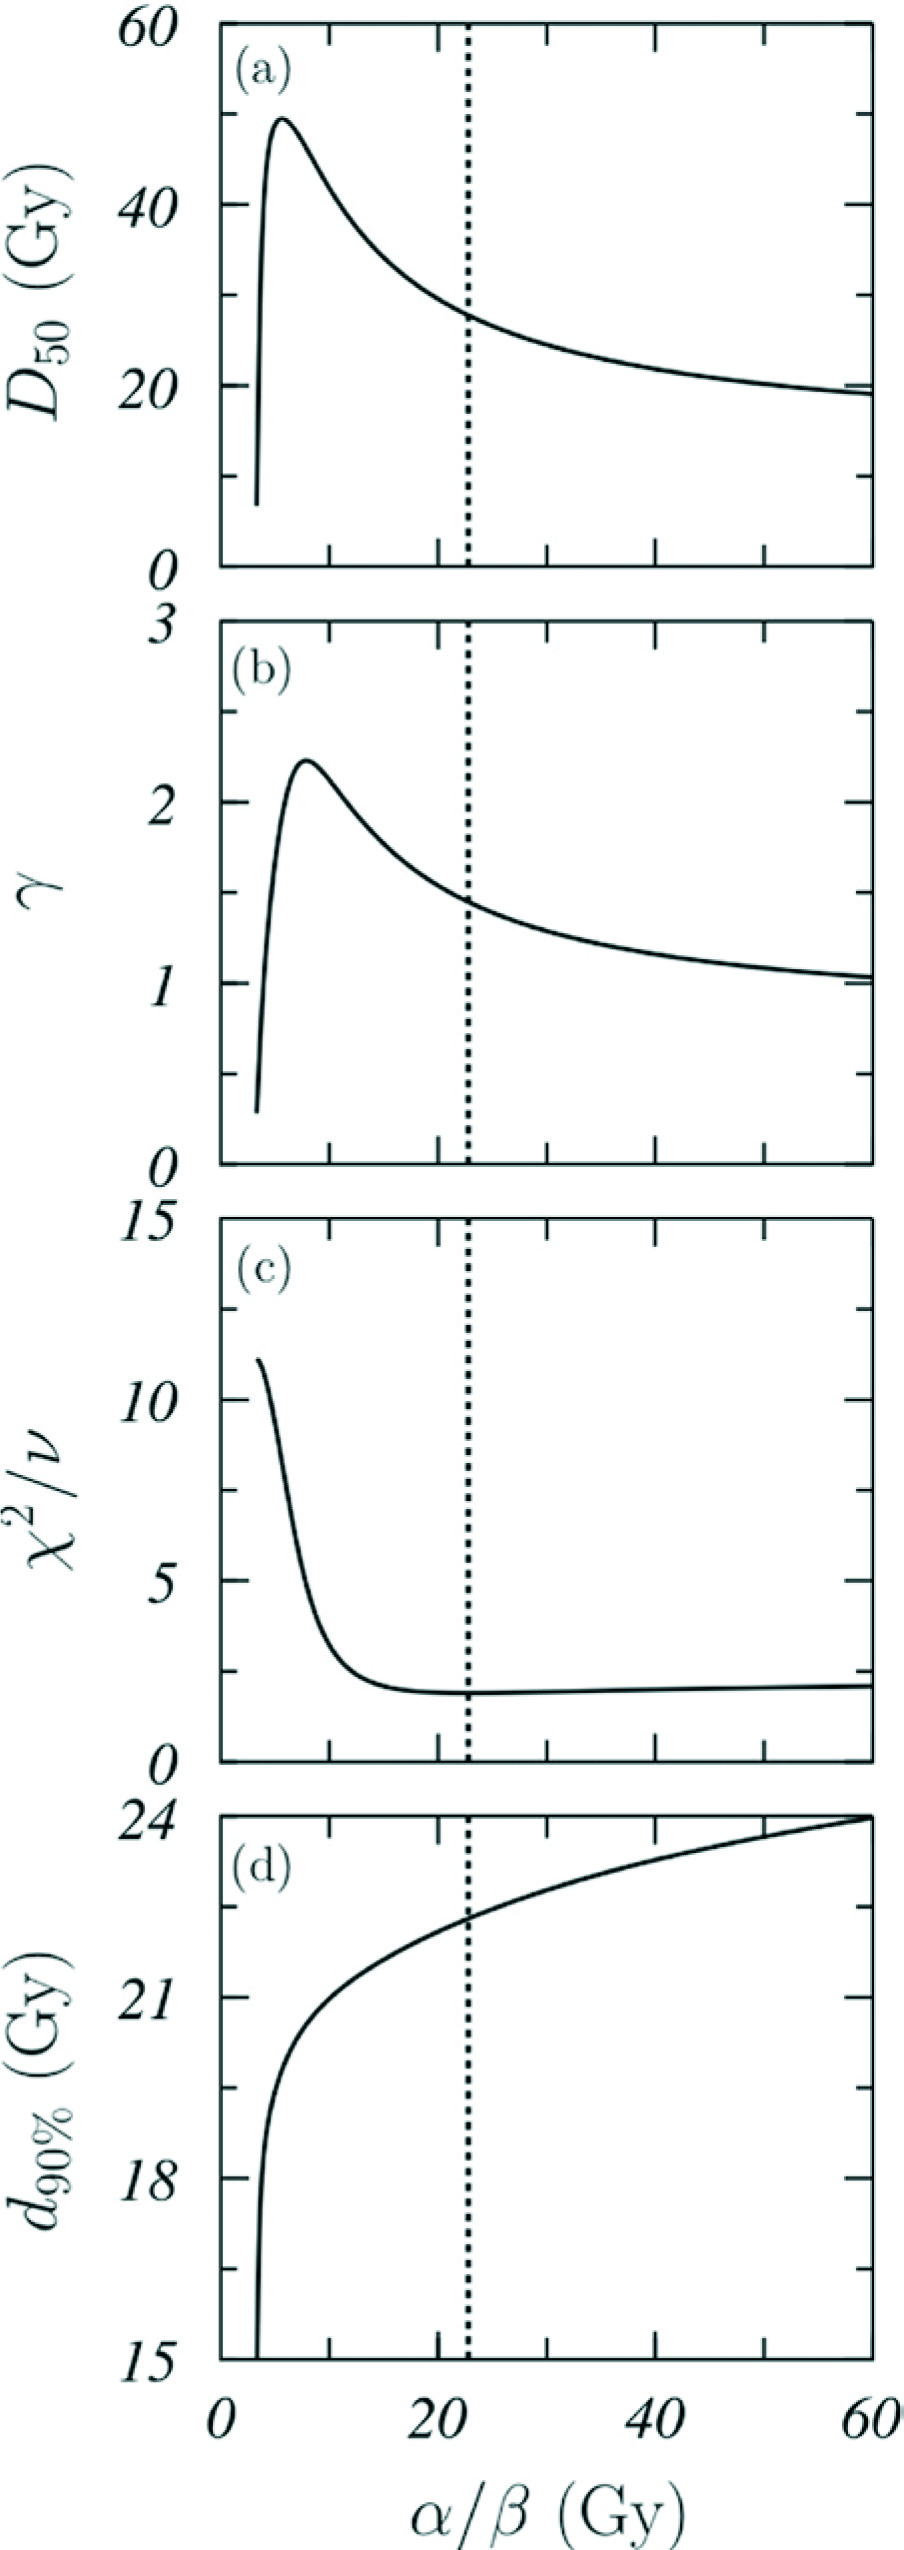
These results are consistent with those obtained in the Monte Carlo analysis where, for the three datasets considered, a high value of α/β and above 18 Gy was found. The situation observed for χ2/v in Figure 4C is very indicative: after a rapid reduction and once the minimum is reached, χ2/v remains almost constant with increasing α/β.
Discussion
The analysis of clinical studies about monotherapy HDR-BT in prostate cancer indicate that high α/β values are required to describe adequately the data available. As shown in Figure 3C, this occurs even if only the data with doses per fraction 6 Gy < d ≤ 11.5 Gy are considered and the schemes with a single fraction are excluded.
When all data are included, the single fraction schedule producing BC = 90% is d90% = 22.3 Gy [21.5, 24.2 Gy], which corresponds to EQD2 = 40.6 Gy [32.1, 46.6 Gy]. In this case, a single fraction of 19 Gy used in a study by Prada et al. [13] and corresponding to EQD2 = 32.0 Gy would produce BC = 69.6% [64.8, 74.6%], close to the value of BC = 66% [60, 72%] quoted by these authors, and much smaller than the prediction of Mavroidis et al. who estimated BC above 95% for a single fraction between 19.2 and 19.7 Gy [9]. On the other hand, we found BC = 81.4% [78.6, 84.0%] for a single fraction of 20.5 Gy, for which Prada et al. obtained 82% [79.0, 85.0%] [14].
The lower α/β average obtained in the three data subsets analyzed was 21.3 Gy [12.8, 64.3 Gy] (see Figure 3B), well above 1.5 and 3.0 Gy values usually considered (Figure 2). Our results indicate low sensitivity of prostate cancer to fractionation with high doses per fraction, much lower than that indicated by the small α/β mentioned above. This has been claimed by other authors, high-lighting that the design of hypofractionated schemes for prostate cancer radiotherapy need to be proceed with caution [8].
It is worth noting that LQ model results are fully correct only in the dose per fraction region where its defining parameters were fitted. Low values of α/β are consistently obtained in studies where low doses per fraction are used [31]. However, some authors have observed that the LQ model using these low values of α/β for high doses per fraction, produces local control levels below expectations [32], which is in agreement with our findings. Therefore, we can consider the LQ model as a valid approximation in a restricted range of dose per fraction, whereas a pragmatic solution recently proposed for cervix cancer [17] can be adopted using an α/β value when one compares fractionations in which low doses per fraction are given, and a different one to evaluate schedules in the high-dose per fraction region.
This high α/β explains why the single fraction schemes have not produced the clinical results expected from the LQ model, when the α/β determined for low doses per fraction is considered [13,14]. In this case, relatively high EQD2, calculated with low values of α/β, produce modest BC probabilities (see Figure 2).
In this respect, it is worth mentioning that three studies were not included in our analysis because they do not match the selection criteria. The first one is that of Hoskin et al. [33], who quoted BC = 94% for treatments with a single fraction of 19 or 20 Gy for 49 months of follow-up for 49 patients having intermediate- or high-risk disease. These BC values are similar to those shown by other fractionation schemes, with high control rates confirmed after completion of patient’s follow-up (as the authors themselves indicate). Moreover, a larger patient sample would be desirable.
In the second study, Mendez et al. [34] indicated that the biochemical failure rate found at 30 months was around 10%, which is larger than expected for a single fraction of 19 Gy.
Finally, Barnes et al. [35] included 28 patients with low- and intermediate-risk, and observed 80.6% biochemical failure-free survival after 3 years. This value was qualified by the authors as a suboptimal biochemical control.
The estimated D50 is significantly smaller than those of classical schemes. For the whole sample of studies, we found D50 = 27.8 Gy, while Trada et al. obtained 39.8 and 45.1 Gy, respectively, for low- and intermediate-risk patients, after analyzing various clinical studies of prostate cancer EBRT, with fractions between 1.8 and 2.0 Gy [36]. This may be due (at least to some extent) to the shortening in the overall treatment time in HDR-BT schemes with respect to EBRT, which could produce an increase of the treatment effect for low- and intermediate-risk patients [37].
With regards to γ, the value obtained for the whole set of clinical studies analyzed was γ = 1.45 [0.98, 1.89]. Trada et al., in the same revision above mentioned, quoted average γ values between 1.2 and 3.2 [36]. In a similar work, in which studies using hypofractionation were excluded, Diez et al. [38] found γ = 1.78 [0.54, 3.02] for low-risk patients and γ = 1.63 [1.13, 2.14] for intermediate- and high-risk patients. Even though these values are compatible with ours, it is worth noting that the non-randomized studies analyzed by Diez et al. defined biochemical failure according to ASTRO criterium instead of that used in our study.
Our results show that doses used in a single fraction must be above 22 Gy to obtain BC ≥ 90% and above 24 Gy for BC ≥ 95%. A single fraction of 22-24 Gy may compromise the toxicity for normal tissues, and it would be interesting to analyze this aspect with a methodology similar to that used in our study, including possible changes in the α/β of normal tissues for high doses per fraction. In any case, it is interesting to consider other fractionation alternatives. The results are shown in Table 2. For 3 and 4 fraction schemes, doses per fraction similar to those already utilized in some of the studies shown in Table 1 were found. The only exception was that of Kukiełka et al., who used 3 fractions of 15 Gy [22]; however, according to our calculations, it is not necessary to reach such high values to achieve adequate BC. For 2 fraction schemes and BC = 90%, we found that fraction doses of approx. 13.5 Gy are necessary, a value similar to that considered in references [12,25].
Table 2
Dose per fraction needed to reach BC values of 90 and 95% according to the results of the present work. Results for various schemes including 1 to 4 fractions are presented
| d (Gy) | ||||
|---|---|---|---|---|
| BC | 1 fraction | 2 fractions | 3 fractions | 4 fractions |
| 90% | 22.3 [21.5, 24.2] | 13.8 [13.4, 14.0] | 10.2 [9.6, 10.5] | 8.1 [7.4, 8.5] |
| 95% | 24.3 [23.0, 27.9] | 15.1 [14.6, 16.2] | 11.2 [10.9, 11.6] | 9.0 [8.6, 9.3] |
A fractionated treatment can be analyzed in terms of BED. For a single fraction of 22.3 Gy and assuming α/β = 22.8 Gy, we found BED = 44.1 Gy for BC = 90% (see eq. (2)), much smaller than those obtained, assuming the low α/β values currently adopted (188.1 Gy and 353.8 Gy for α/β equal to 3 Gy and 1.5 Gy, respectively). α/β and BED can be considered as mutually dependent quantities that must be chosen according to the specific treatment and fractionation. Reference BED values must be used carefully considering the clinical context, for which they were estimated. For example, Zaorsky et al. [39] used the same α/β for EBRT, with doses per fraction relatively low, and HDR-BT. These authors concluded that increasing the BED obtained for α/β = 1.5 Gy above 200 Gy does not produce any effect. However, the BED may be wrongly calculated for HDR-BT because of the very low α/β value considered. In the same way, as can be seen in Figure 2, the value of EQD2 depends on the value of α/β considered to calculate it. Therefore, the EQD2 values estimated for the set of treatments studied in this work are valid only in the specific range of doses per fraction analyzed.
The results presented in this work have some limitations: 1. The dataset fulfilling the criteria imposed is small and is affected by uncertainties that are considerably large; 2. There is some heterogeneity among treatment techniques employed in the different studies; 3. The two single fraction studies included in our analysis belong to the same institution. In addition, the use of hormonal therapy, the implant technique, the heterogeneity of absorbed dose, different criteria for prescribed dose used by various institutions, limitations imposed on dose that normal tissues may receive, uncertainties due to the presence of low and intermediate patients in the cohort analyzed, etc., are the conditions that may modify the value of the fitted parameters.
Conclusions
The α/β value of 22.8 Gy found in our analysis, with a range of dose per fraction between 6.0 and 20.5 Gy, is much greater than 1.5 Gy or 3.0 Gy currently considered for prostate cancer radiotherapy with low doses per fraction. This high value of α/β explains reasonably well the data available in the region of the high doses per fraction considered. The absorbed dose in monotherapy HDR-BT, in a single fraction scheme, allowing to obtain BC = 90% and 95% are 22 Gy and 24 Gy, respectively.
The limitations of our analysis, such as the strong influence of single fraction schemes in the fitting procedure or the heterogeneity of data, can be overcame by considering additional clinical studies.


