
Purpose
Radiotherapy of cervical cancer is usually delivered as a combined treatment [1]. Dose deposited in the target volume is delivered through a system of several external photon radiation beams (EBRT) and intracavitary application of ionizing radiation sources (BRT). EBRT is a multi-fractional radiation, with total dose (e.g., 50.4 Gy) delivered in more than ten (in this case 28) radiation fractions [2]. In BRT, total dose (e.g., 28 Gy) is delivered in several (in this case 4) radiation fractions [3]. The combination of EBRT and BRT enables a higher biological dose to be administered while shortening the total treatment time [4].
The challenge faced by researchers is the summation of doses from both methods in selected critical organs [5,6]. One of the main critical organs in cervical cancer radiotherapy is the bladder.
For EBRT, owing to some tools implemented in treatment planning systems, it is possible to precisely measure the parameters of dose distribution in the bladder. In the case of BRT, the applicator-induced artefacts during brachytherapy application substantially reduce the correctness of bladder volume determination and, consequently, limit the assessment of the distribution of deposited doses. During EBRT, the patient is usually in a standard supine position, with a padding placed under her knees. Whereas during BRT, the patient lies in a supine position, with legs spread apart and specially supported to enable a brachytherapy applicator to be inserted. Both patient’s position and applicator placement require different morphological conditions than those applied for EBRT [7,8].
To adjust the image of patient’s anatomy during BRT (deformed image) to the image of patient’s anatomy during EBRT (reference image), rigid image registration allows only the possibility of up-scaling/down-scaling, shifting, and rotating (in each direction of the Cartesian system) of the projected image in relation to the reference image [9]. With deformations of organs (i.e. bladder) not reflected, it is impossible to merge the images, so that anatomical structure visible in the projected image would be appropriately deformed and adapted to the shape in the reference image [7]. Consequently, it is impossible to reconstruct the distribution of doses deposited in particular structures during BRT in images used during the development of EBRT plan. Therefore, a merger of medical images obtained during EBRT and BRT should be based on deformable image registration methods [5].
The main algorithms applied in a deformable image registration are algorithms with diffusive model (demon registration), algorithms using a transformation and analysis of B-spline functions (B-spline registration), and hybrid algorithms, which combine functionalities of both [9]. Deformable registration methods often employ supporting structures, such as triangular meshes generated from contours of selected anatomical structures of patient [10]. The triangular meshes are used to reduce the calculations made during the registration for a selected structure and, thus, reconstructing its deformation more precisely.
It also needs to be remembered that medical images used during BRT and EBRT may be created by means of various imaging methods, e.g. cone-beam computed tomography images (CBCT) often used in BRT planning, and conventional CT images applied for EBRT planning.
The aim of the present study was to assess selected methods of image registration available in the RaySearch treatment planning system (RaySearch Laboratories AB, Stockholm, Sweden) and their impact on the accuracy of mapping of doses deposited in the bladder during BRT in images used during EBRT.
Material and methods
The study was retrospective in nature. Analysis was made for 10 cervical cancer patients. Each of the patients was treated with BRT using a three-channel Fletcher applicator, and EBRT involving photon beams delivered by a linear accelerator.
Brachytherapy
Brachytherapy (BRT) dose planning and optimization was based on medical images obtained from Acuity simulator (Varian Medical Systems, Palo Alto, USA). Two orthogonal two-dimensional topographical images (2D-keV) were produced, and CT images were obtained through CBCT. The slice thickness was 0.2 cm, and the pixel size was 0.088 cm × 0.088 cm. All images were made within a single imaging session for a patient set-up used in BRT, with an applicator placed inside the uterine cavity and a catheter placed in the bladder. Based on the 2D-keV images, a treatment plan was made for iridium-192 source (192Ir) with radiation energy of 0.397 MeV (treatment planning system BrachyVision version 11; Varian Medical Systems, Palo Alto, USA, algorithm TG-43). Dose distributions were calculated for a homogeneous medium, with density equivalent to that of water. The 2D-keV images were merged with the CBCT images using the rigid registration method with a particular focus on bone anatomy compatibility [11]. Then, the planned dose distributions (based on the 2D-keV images) were copied onto the CBCT images. The bladder was contoured on the CBCT images.
External beam radiation therapy
To deliver radiotherapy, each of the patients was CT-scanned by Somatom Definition AS scanner (Siemens Medical Solutions, Erlangen, Germany). During CT imaging, the patients were arranged in a supine position with a padding under their knees. They had no applicator placed in the uterus nor catheter in the bladder. The slice thickness was 0.3 cm, and the pixel size was 0.127 cm × 0.127 cm. Structures necessary to create and deliver the EBRT plan, including the bladder, were contoured on CT images. Radiation therapy plans were delivered by photon energy beams of 6 MeV and 15 MeV using IMRT technique (Eclipse version 11 planning system, algorithm AA 11031; Varian Medical Systems, Palo Alto, USA). Total dose of 50.4 Gy was administered in 28 radiation fractions. Bladder contours in both the CBCT and CT images were made by the same radiotherapist.
Data preparation and migration
Both the BRT plans created in the BrachyVision planning system and the EBRT plans (Eclipse planning system) were exported to the RaySearch treatment planning system (version 9A), where image registration and dose distribution mapping procedures were carried out. When performing those procedures, the following data were used:
– for BRT plans, dose distribution and CBCT images with bladder contour;
– for EBRT plans, CT images with bladder contour.
To evaluate the correctness of data migration, a comparison was made between volumes of the bladder contoured in Varian systems (BrachyVision, Eclipse) and the same volumes, which were determined based on contours of those structures imported and reconstructed in the RaySearch system. These were:
– for BRT plan migration (BrachyVision → RaySearch), bladder volume calculated on the basis of the contour made in CBCT images;
– for EBRT plan migration (Eclipse → RaySearch), bladder volume calculated on the basis of the contour made in CT images.
Protocol of operations performed in the RaySearch system was as follows:
– registration of CT images (from EBRT plan) and CBCT image registration (from BRT plan);
– propagation of the bladder contour based on CBCT images (BRT) and its transfer to CT images (EBRT);
– mapping of dose distributions from the BRT plan in CT images (EBRT), according to the registration result.
CT and CBCT image registration
CT and CBCT images were registered by three methods: 1. Rigid registration based on bone structures (Reg_1); 2. Deformable registration using anatomically constrained deformation algorithm (ANACONDA) (Reg_2a and Reg_2b); 3. Deformable registration with biomechanical algorithm (MORFEUS) (Reg_3).
In each case, the CT image set was a reference image, while the CBCT image set was a deformed image. By mapping CBCT images on CT images, the bladder contour can be propagated from CBCT images onto CT images [12]. However, it should be noted that rigid registration (Reg_1) does not cause the bladder contour to be transferred from CBCT to CT to change its form, but only to change its orientation [13]. Therefore, Reg_1 was used as a starting point for operations, which enabled monitoring of anatomy changes (deformations) between CT and CBCT images.
Accordingly, two deformation algorithms available in the RaySearch system were used. First of them (ANACONDA) is a hybrid algorithm that combines the diffusive model (demon) with that employing the B-spline functions [9]. Registration using that combination can be based on both structure contours and contour-based structure triangular meshes [14]. Both registration models were used in this study: Reg_2a – hybrid registration, where the control area was formed by bladder contours, and Reg_2b – hybrid registration, where the control area was formed by a triangular mesh based on the bladder contours. The other algorithm applied was the biomechanical algorithm (MORFEUS) [15,16]. Using that algorithm, a registration (Reg_3) was made, where the control area was formed by a triangular mesh based on the bladder contours.
The deformable mesh in all the cases (Reg_2a, Reg_2b, and Reg_3) was 0.3 cm in the sagittal plane and 0.25 cm in the frontal and transversal planes.
Sørensen-Dice similarity coefficient (DSC) was used to assess the similarity between the shape of the bladder in the reference image (CT) and that of the bladder from the deformed image (CBCT) transferred to the reference image
where V(Bref) is the volume (V) of the bladder (B) defined on the base of contours in the reference image (ref), and V(Bdef) is the volume (V) of the bladder (B) delineated based on contours from the deformed image (def) transferred to the reference image.
DSC assumed values were from 0 (no overlap) to 1 (full overlap).
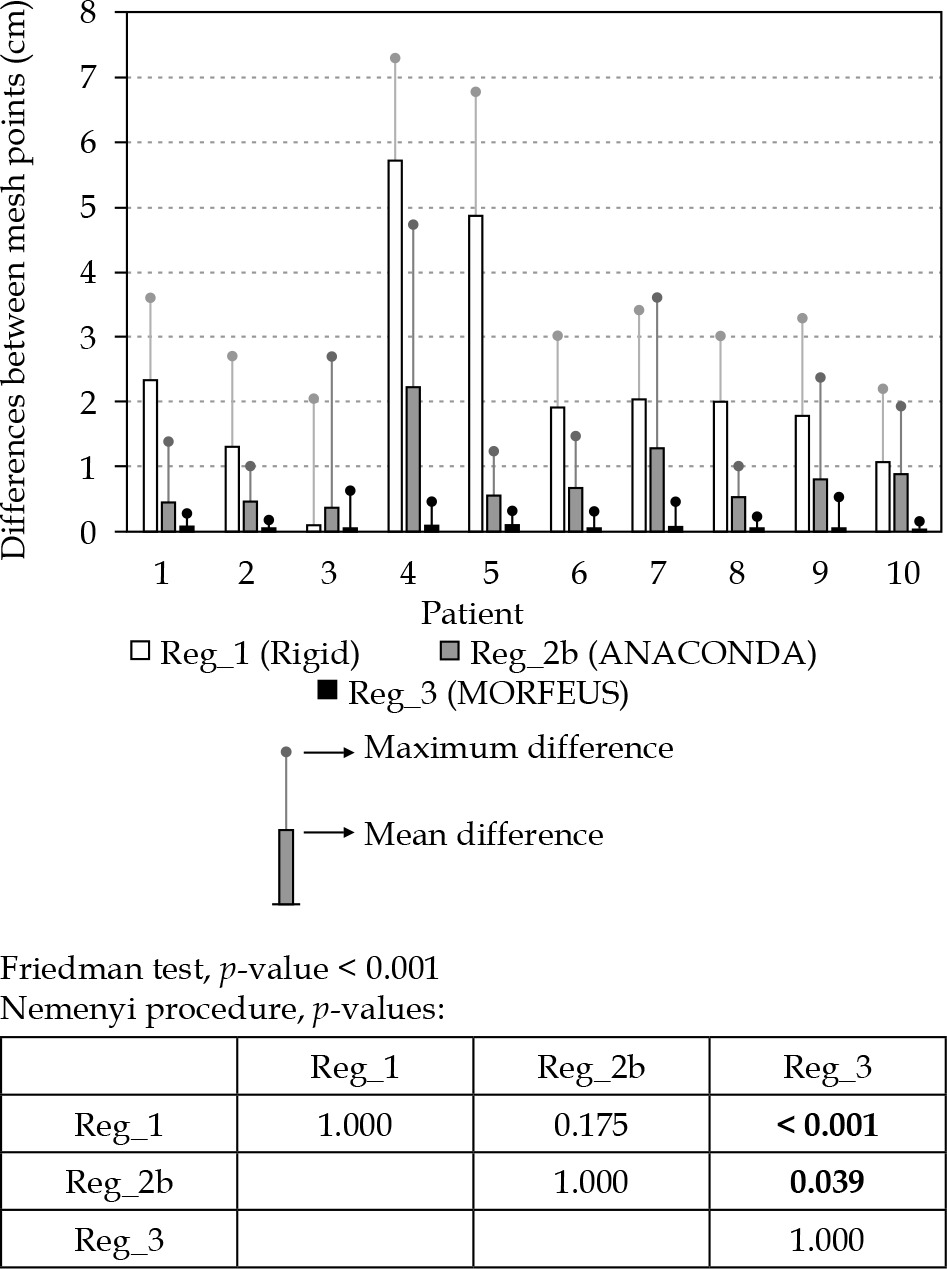
Furthermore, for methods using a triangular mesh (Reg_1, Reg_2b, and Reg_3), medium and maximum discrepancies were assessed between corresponding points of the reference mesh (in CT images) and deformable mesh (from CBCT images).
Dose distribution mapping
Dose distributions from the BRT plans were transformed according to registration results, then transferred and associated with data (CT images, bladder contour) representing patients’ anatomy during EBRT.
Assuming ideal registration conditions (DSC = 1), dose distribution analysis with BRT in the bladder, visualized in CT images (EBRT), should only show dose displacement in the bladder, while maintaining maximum dose values. However, each non-ideal image registration (DSC < 1) leads to a situation, where deformed bladder contours from CBCT images are not fully aligned with reference contours from CT images. Respecting the above, a comparative analysis was made of BRT doses deposited in 2 cm3 of the bladder, visualized in CBCT images (primary BRT dose distribution) and in CT images (transformed BRT dose distribution).
Statistical analysis
Wilcoxon test was performed to assess differences between the volume of the bladder determined during assessing treatment plans in the BrachyVision and Eclipse systems, and the volume reconstructed in the RaySearch system. The same test was used to evaluate differences between the volume of the bladder during BRT (visualization in CBCT) and EBRT (visualization in EBRT). Differences between the registration results and dose mapping results were evaluated using Friedman ANOVA test, with supporting post-hoc tests (Nemenyi’s procedure). All the tests were performed at a statistical significance level of 0.05.
Results
Bladder volume analysis
The reconstruction of contours in the RaySearch system leads to an increase of bladder volume in relation to that determined in the BrachyVision and Eclipse systems (Table 1). The exception was one observation shown in Table 1 related to the reconstruction of contour in the CT images (EBRT plan) for patient 2.
Table 1
Volumes of the bladder based on the contours made during treatment planning in the BrachyVision and Eclipse systems, and reconstructed after data migration to the RaySearch system
The observed increase of the bladder volume was independent on the data source: Δ(RS-BV) vs. Δ(RS-E); p = 0.557, respectively. Moreover, there was no correlation found between the volume of the bladder and the extent of its increase caused by the reconstructions performed in the RaySearch system. The coefficients of determination obtained, and the related p-values were: R2 = 0.011 and p = 0.773 for BRT (CBCT images) and R2 = 0.001 and p = 0.931 for EBRT (CT images), respectively.
However, it should be noted that bladder volumes during BRT differed significantly from those observed during EBRT (p = 0.044) (Figure 1).

CT and CBCT image registration
Figure 2 shows DSC values for the bladder obtained using the four different methods of registering CT images from CBCT, i.e.: rigid registration (Reg_1) two hybrid registrations based on bladder contours (Reg_2a) and triangular meshes (Reg_2b), and biomechanical registration (Reg_3). DSC values obtained for deformable registrations were significantly higher than those obtained for rigid registration (p = 0.011 for Reg_1 vs. Reg_2a; p = 0.014 for Reg_1 vs. Reg_2b, and p = 0.001 for Reg_1 vs. Reg_3). No statistically significant differences were found between DSC values for deformable registrations. However, 9 out of 10 observations made for Reg_3 displayed DSC values higher than 0.95, whereas for hybrid registrations (Reg_2a, Reg_2b), such high DSC values were observed for 4 and 5 observations, respectively (Table 2).
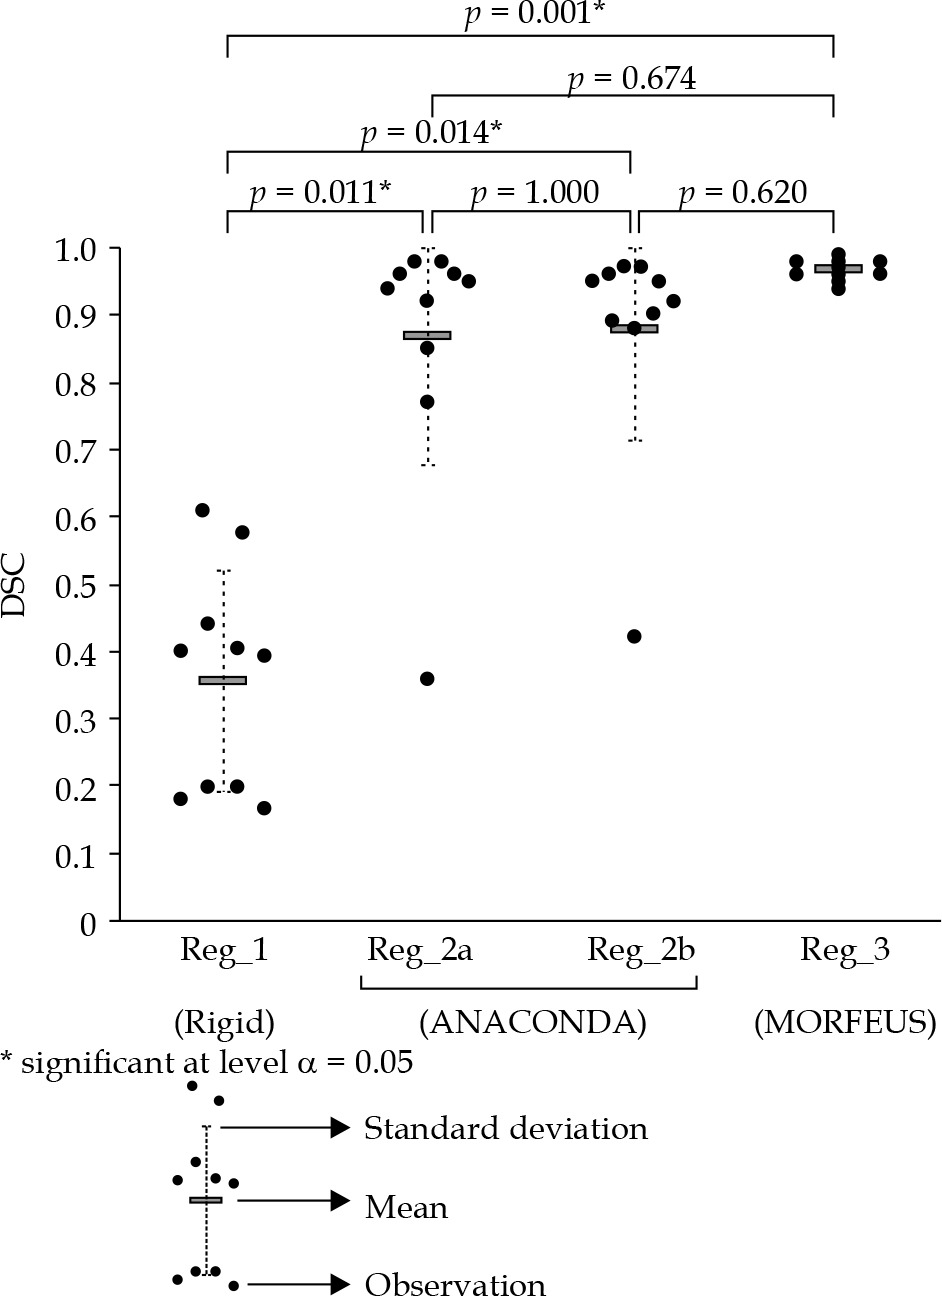
Table 2
Number of observations according to the extent of DSC values for the four registration methods of CT images from CBCT
| Number of observations | ||||
|---|---|---|---|---|
| DSC (range) | Rigid | ANACONDA | MORFEUS | |
| Reg_1 | Reg_2a | Reg_2b | Reg_3 | |
| [0.00, 0.70] | 10 | 1 | 1 | 0 |
| [0.70, 0.90] | 0 | 2 | 2 | 0 |
| [0.90, 0.95] | 0 | 3 | 2 | 1 |
| [0.95, 1.00] | 0 | 4 | 5 | 9 |
Observations shown in Table 2 were confirmed by analyzing the discrepancies between corresponding triangular mesh points located on the surface of the bladder. The analysis showed a statistically significant reduction of discrepancies for Reg_3 compared to Reg_2b, with p = 0.039 (Figure 3).
Dose distribution mapping
Table 3 demonstrates doses deposited in 2 cm3 of the bladder, including doses for the bladder volume determined in CBCT images (initial BRT treatment plan), and doses for BRT distribution transformed by the three deformable registration methods and reading of the bladder volume determined in CT images, when developing the EBRT plan.
Table 3
Doses measured for bladder on CBCT images (initial BRT plan) and corresponding doses mapped by three registration methods, and displayed for bladder on CT images
Differences between BRT doses in CBCT images in the bladder and the same doses transformed and visualized in CT images are shown in Figure 4.
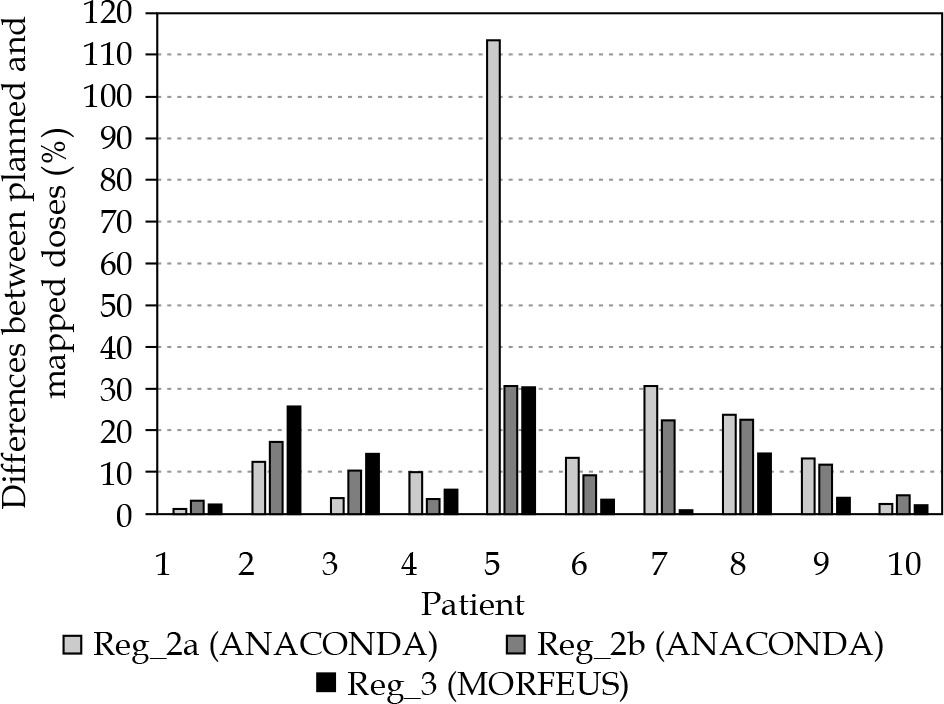
There are no statistically significant differences between the results for the three registration methods (p = 0.273). However, the highest uniformity in all registrations were found in Reg_3 (Figure 4). Moreover, dose mapping in CT images based on Reg_3 had the least error: for Reg_3, 5 out of 10 observations yielded error of less 5%, while for Reg_2a and Reg_2b, there were only three of such observations. Also, there were some observations where the discrepancy between the original and mapped dose, regardless of the registration method, was unacceptable (data for patients 2, 5, and 8 in Figure 4).
Discussion
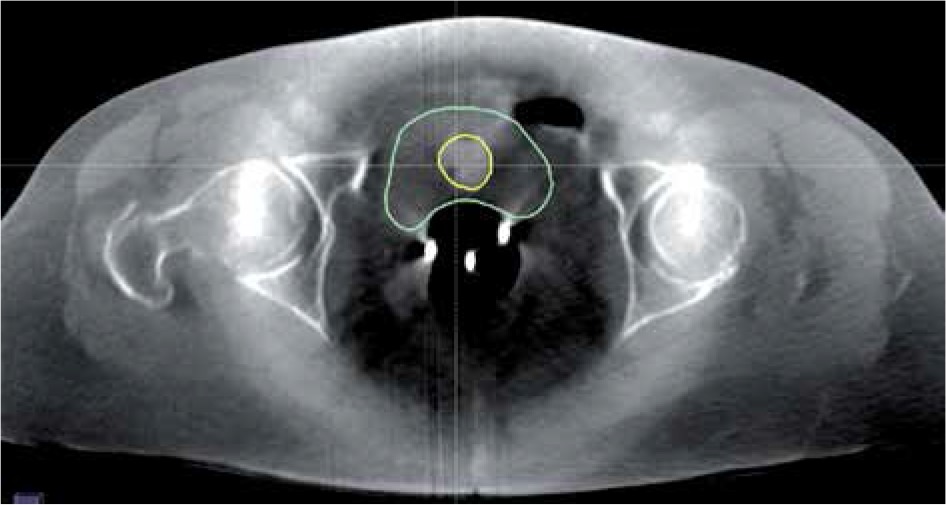
Modern BRT planning systems enable the visualization of doses on CT images by combining information of dose distribution with that of patient’s anatomy [18,19]. The quality of CT images is one of the key factors determining the complexity of dose distribution analysis in patient’s body. While CT images enable doses to be measured in most organ/regions during BRT, the quality of CBCT images reduces substantially the extent of those analyses [20]. Figure 5 shows a CBCT image made on an Acuity simulator for a volume treated with BRT. It displays the bladder (contoured with a green line), Foley’s catheter placed in the bladder (yellow line), and a three-channel Fletcher applicator (three bright points located centrally in the patient’s body). The quality of CBCT images makes it impossible to specify the exact location of the rectum and target volume and, thus, to perform a spatial analysis of doses deposited in those structures. It is, however, possible to analyze dose distribution in the bladder.
The bladder is an organ prone to substantial changes in its volume, shape, and position. As shown in Figure 1, bladder volume during BRT (CBCT) differs considerably from that during EBRT (CT). Therefore, to map BRT doses in the bladder visualized in CT images (EBRT), advanced image registration methods need to be applied. For the sake of clinical utility, it is important to measure the error caused by those transformations., and for that reason, the present study did not raise issues related to combining doses deposited in particular BRT fractions [21] or combining doses between BRT and EBRT [5]. The study only evaluated the accuracy of image registration and dose-based transformations performed. Reduction of the research to the assessment of accuracy of image registration and dose mapping methods was also dictated by a traditional way of BRT dose calculations, which did not reflect the inhomogeneity of irradiated medium reducing the possibility of combining BRT doses with EBRT doses (calculated in CT images, considering the inhomogeneity of medium) [22].
This study evaluated the methods implemented in the RaySearch system, with data imported from Varian treatment planning systems (BRT – BrachyVision, EBRT – Eclipse). Even though the resolution of images did not change during the import, some differences were observed between the bladder volume (Table 1) measured in the RaySearch system and that measured in the Varian systems. Those differences result from different contour reconstruction methods applied by the BrachyVision/Eclipse and RaySearch [23,24]. It has to be mentioned that the increase in the bladder volume was the same for CBCT images exported from the BrachyVision as for CT images from the Eclipse (mean growth by 0.76%). Therefore, the increase did not distort the evaluations performed by the RaySearch system.
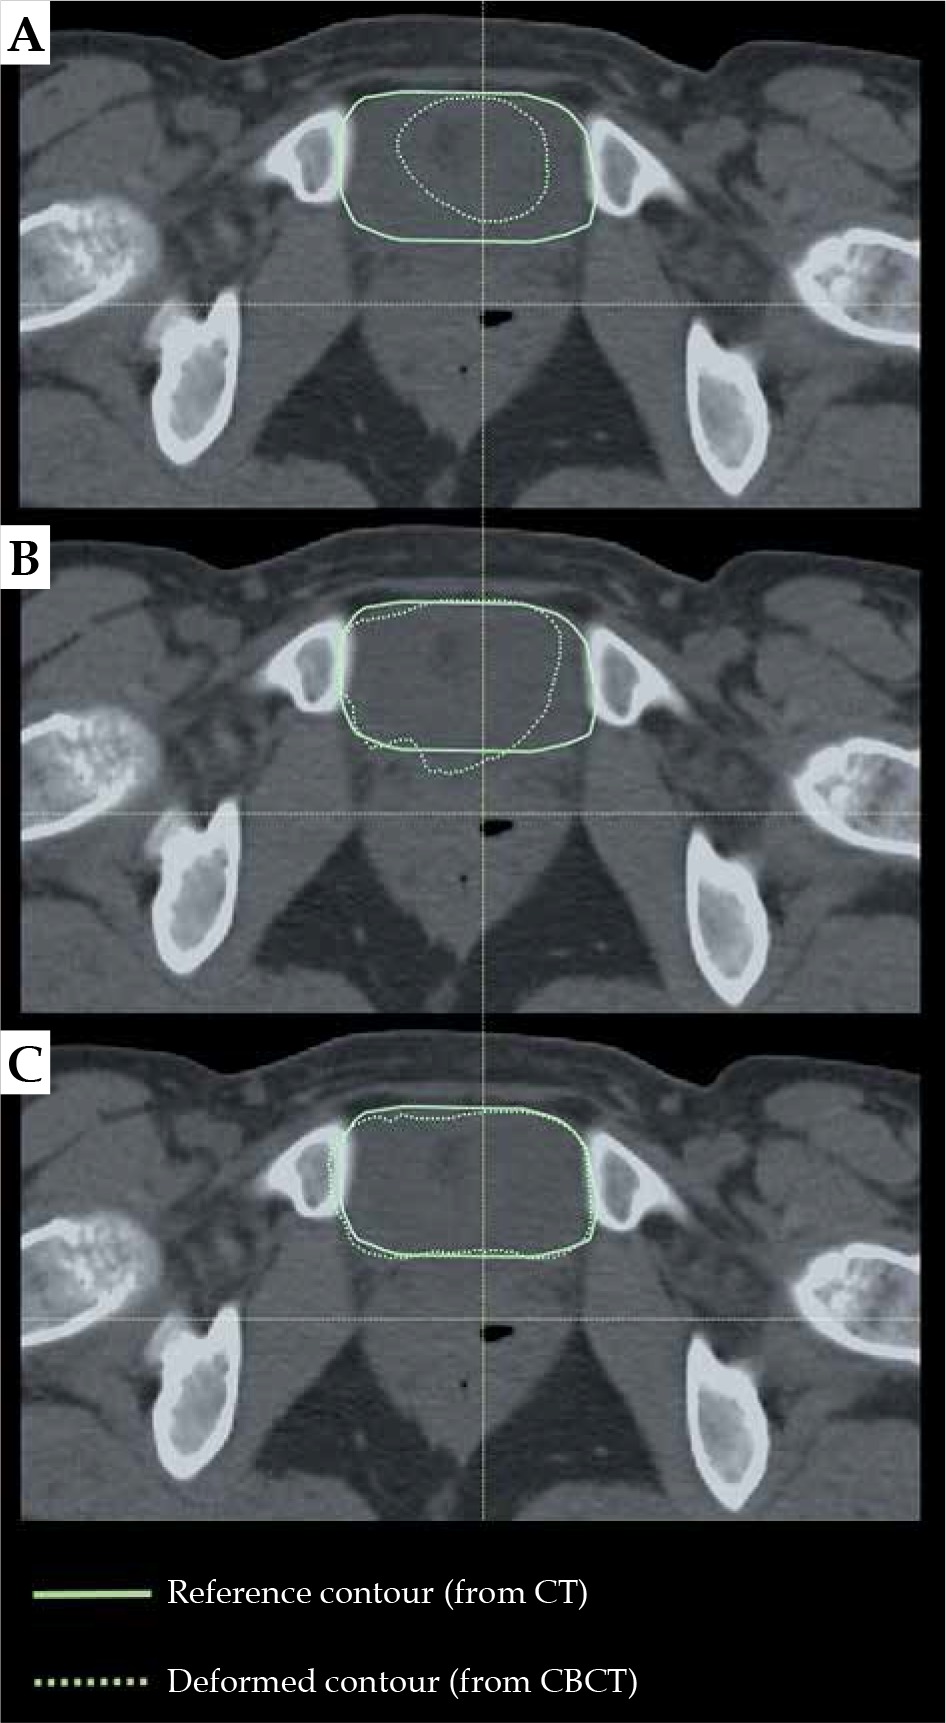
Image registration methods implemented in the RaySearch system enable both rigid and deformable registrations. As shown above, the deformable methods largely improve the quality of image registration as compared to the rigid methods (Figure 2). Evaluating the deformable methods, we demonstrated the biomechanical method to be the most effective one (Reg_3) (Table 2, Figure 3). Figure 6 shows the example alignment of bladder contours based on rigid registration (Reg_1) and deformable registrations: hybrid (Reg_2b) and biomechanical (Reg_3). A triangular mesh based on bladder contours was the control area for all registrations.
Fig. 6
Alignment of bladder contour from CBCT image (dashed line) with the corresponding reference contour delineated in the CT image (continuous line) for A) rigid registration, Reg_1, B) hybrid registration, Reg_2b, and C) biomechanical registration, Reg_3
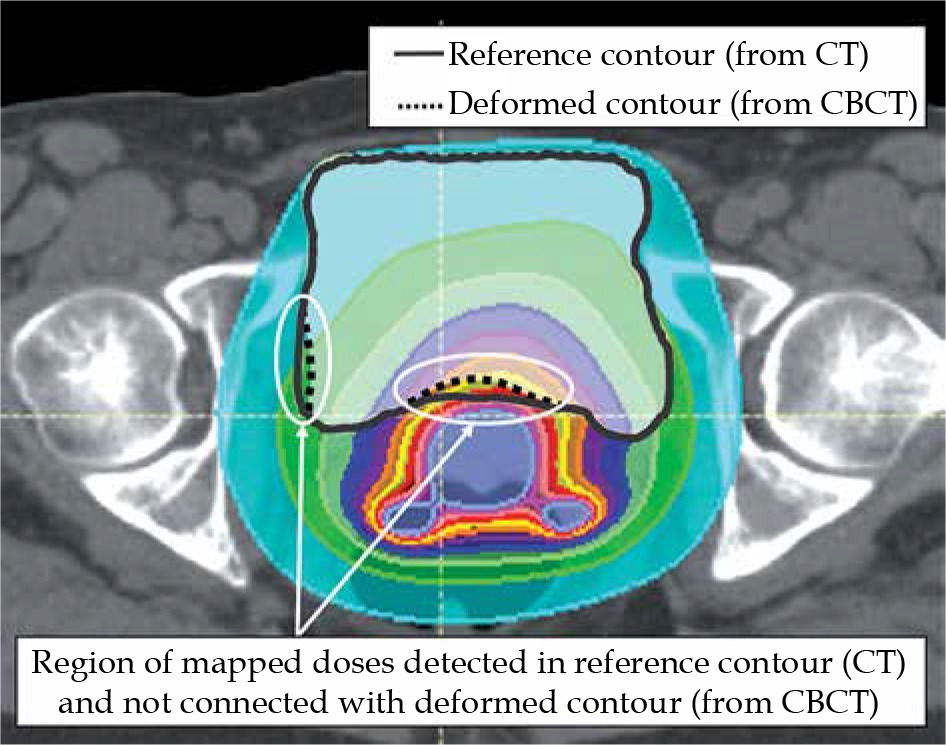
BRT doses initially associated with the CBCT image were transformed according to the registration results. Then, they were combined with the CT image (EBRT). Comparing doses in the bladder in CBCT and CT images, the highest compatibility was achieved in the transformation based on the biomechanical registration results (Reg_3). For 5 out of 10 observations, the discrepancy between doses was smaller than 5% (data patient 1, 6, 7, 9, and 10 in Figure 4). This confirms the observations made by Rigaud et al. [17]. Unfortunately, for 2 out of 10 observations, discrepancies were larger than 15% (data for patient 2 and 5 in Figure 4). It should be noted that the patients with observed discrepancies were marked with a substantial difference in bladder volume in CBCT and CT images, and relatively low DSC values (0.96) obtained with biomechanical registration (Reg_3). Low DSC values prove the inaccuracy in the alignment of bladder contours in the region where BRT doses are deposited. Therefore, prior to result acceptance, each image registration and contour propagation procedure as well as final dose distribution mappings should be visually evaluated. Figure 7 shows the result of dose mapping obtained for biomechanical registrations (Reg_3), which were characterized by various DSC values.
Conclusions
Of all registrations analyzed, it is the biomechanical registration (Reg_3) that enables the most accurate alignment between CBCT images used (in this study) during BRT planning, with CT images used in EBRT planning. Satisfactory registration results of anatomical structures do not guarantee a correct mapping of primary BRT doses to the bladder in CT images. In this study, the results of dose transformation based on the biomechanical registration had an error of less than 5% for only 50% of the observations.


