
Purpose
Brachytherapy is a type of radiation therapy, in which radiation source is placed inside or near the therapeutic target, and has been used to treat both benign and malignant prostate tumors [1-5]. The initial prostate brachytherapy approach involved surgical prostate exposure; however, local disease recurrence was common even after radionuclide implantation under visual control [6, 7], indicating the need for efficient guidance of radiation source distribution [8]. As a result, prostate brachytherapy procedures evolved in the 1970s and 1980s into less invasive techniques performed under sonographic or fluoroscopic guidance [9]. Prostate brachytherapy using trans-perineal needles guided by trans-rectal ultrasonography [10, 11] represents the modern clinical practice. This technique is recommended by the American Brachytherapy Society’s consensus guidelines [12], and was considered most relevant to the current study.
In transperineal prostate brachytherapy, a clinical guide template with a matrix of position channels [13, 14] is available for aligning brachytherapy needles with cancerous tissues identified within the prostate. However, needle bending [15] and ultrasound artifacts frequently interfere with accurate needle visualization during placement and digitization in treatment planning [16]. Siebert et al. [17] found that the range of errors for prostate needle-tip localization using ultrasonography was 0.8-3.1 mm in transverse images and 0.8-2.8 mm in sagittal images. Androulakis et al. [18] observed infrequent, but significant, localization errors of up to 9 mm for ultrasound-based high-dose-rate brachytherapy treatment planning. Such digitizing mistakes can cause disparity between planned and delivered doses, with dose discrepancies potentially resulting in higher toxicity rates [19] or local recurrence [20].
Active ultrasound tracking has emerged in the 1980s and 1990s. A catheter was ultrasonically marked by an embedded piezo-electric crystal, and actively tracked in conventional grayscale scans [21, 22], whereas Frazin et al. [23] showed that a vascular Doppler catheter could produce a trackable “banded color pattern” when scanned with color Doppler echocardiography. In the early 2000s, investigators explored color Doppler tracking by vibrating aspiration needle or other interventional tools to produce a Doppler shift and, thus, a visible color overlay [24, 25]. Others used a time-of-flight (ToF) principle and position triangulation of catheters with embedded sensors [26-28]. Recently, Kasine et al. [29, 30] and McLeod [31] introduced a needle with a piezo-electric sensor placed near its tip for ultrasound-guided peripheral nerve block treatments.
Here, the term “active ultrasound-tracked needle” was used to refer to methods, in which an ultrasound piezo-electric sensor is attached to a needle and spatially navigated by 1. Interacting with ultrasound transducer and generating a guidance marker on the display; or 2. Triangulating the needle’s position by using ultrasound signal time-of-flight (ToF) principle to reference the sensors. Contrary to passive, i.e., visual, needle tracking in conventional grayscale ultrasound scans, active tracking promises to improve radiation safety and treatment effectiveness by reducing operator guidance subjectivity, avoiding susceptibility to ultrasound imaging artifacts, and eliminating the need for frequent complex and expensive multimodality imaging techniques [32-34].
This study evaluated the potential of active tracking using sonomicrometry and the ToF principle for needle localization in the context of transperineal brachytherapy. The study aimed to 1. Validate a prototype of active ultrasound-tracked needle, equipped with a positional sensor (piezo-electric crystal) for guidance by ultrasound; 2. Quantitatively test the distance measurements between the needle and an independent sensor; and 3. Qualitatively assess the location of active ultrasound-tracked needle by spatial triangulation.
Material and methods
Active ultrasound-tracked needle design
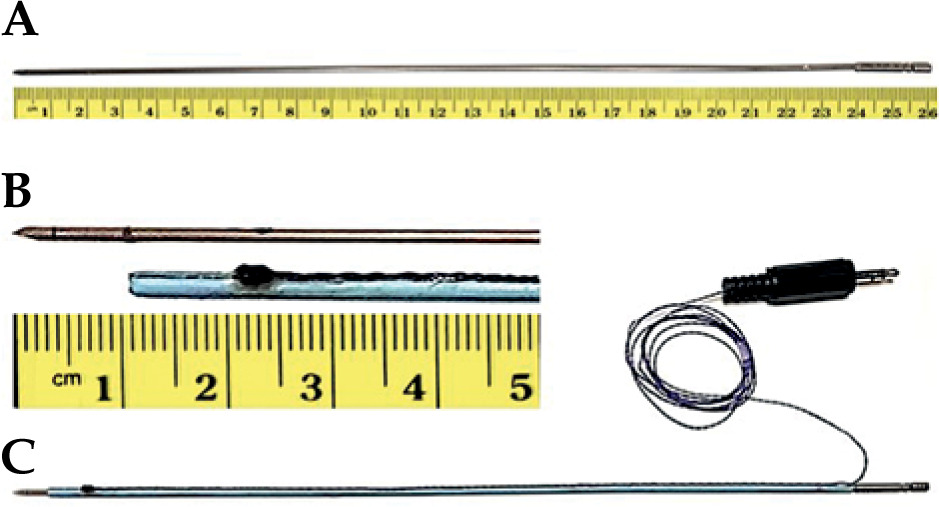
In this study, hollow, 26 cm long, and 17-gauge titanium prostate brachytherapy needles (Varian Inc., Palo Alto, CA, USA) with 1.5 mm outer and 1.2 mm inner diameters were used (Figure 1A). An 8 French angiography catheter (Super Torque, Cordis) was cut into a 23 cm length to serve as a sleeve over the needle (Figure 1B). An oval-shaped piezo-electric sensor, approximately 2 mm in diameter, was partially embedded into the sleeve. A wire connecting the crystal was glued into a narrow crevice along the sleeve. Figure 1C shows the assembled active ultrasound-tracked needle.
Sonomicrometry: the functional principle and ToF measurements
A sonomicrometry system (Sonometrics Corporation, London, Canada) transmits a pulse from a piezo-electric sensor. The pulse impinges on another sensor, producing approximately a 1 MHz received signal (Figure 2A, upper trace). The transmission alternates between the two sensors at a 500 Hz rate in the current setting. ToF was measured between the two sensors from binary signals generated by sonomicrometry using an oscilloscope (DSO 475, Gould) and its electronic caliper (Figure 2A, lower trace). Endpoint of binary signal was triggered by a positive phase (upstroke) of initial cycle of the received signal. Sensitivity to the upstroke amplitude was manually adjustable.
Fig. 2
Sonomicrometry signals and time-of-flight (ToF) measurements. A) Upper trace shows the transmitted pulse and received signal. Lower trace is the corresponding binary signal that provides the ToF value. Triggering of the binary signal endpoint is controlled by a user-defined sensitivity level to the received signal upstroke amplitude. B) An example of level shift. In comparison with (A), the signal is recorded at different distance and with initial upstroke amplitude that is lower than the user-set sensitivity. Hence, the trigger moves to the next upstroke with an amplitude above the sensitivity level, causing a “level shift” and resulting in an erroneously extended ToF value
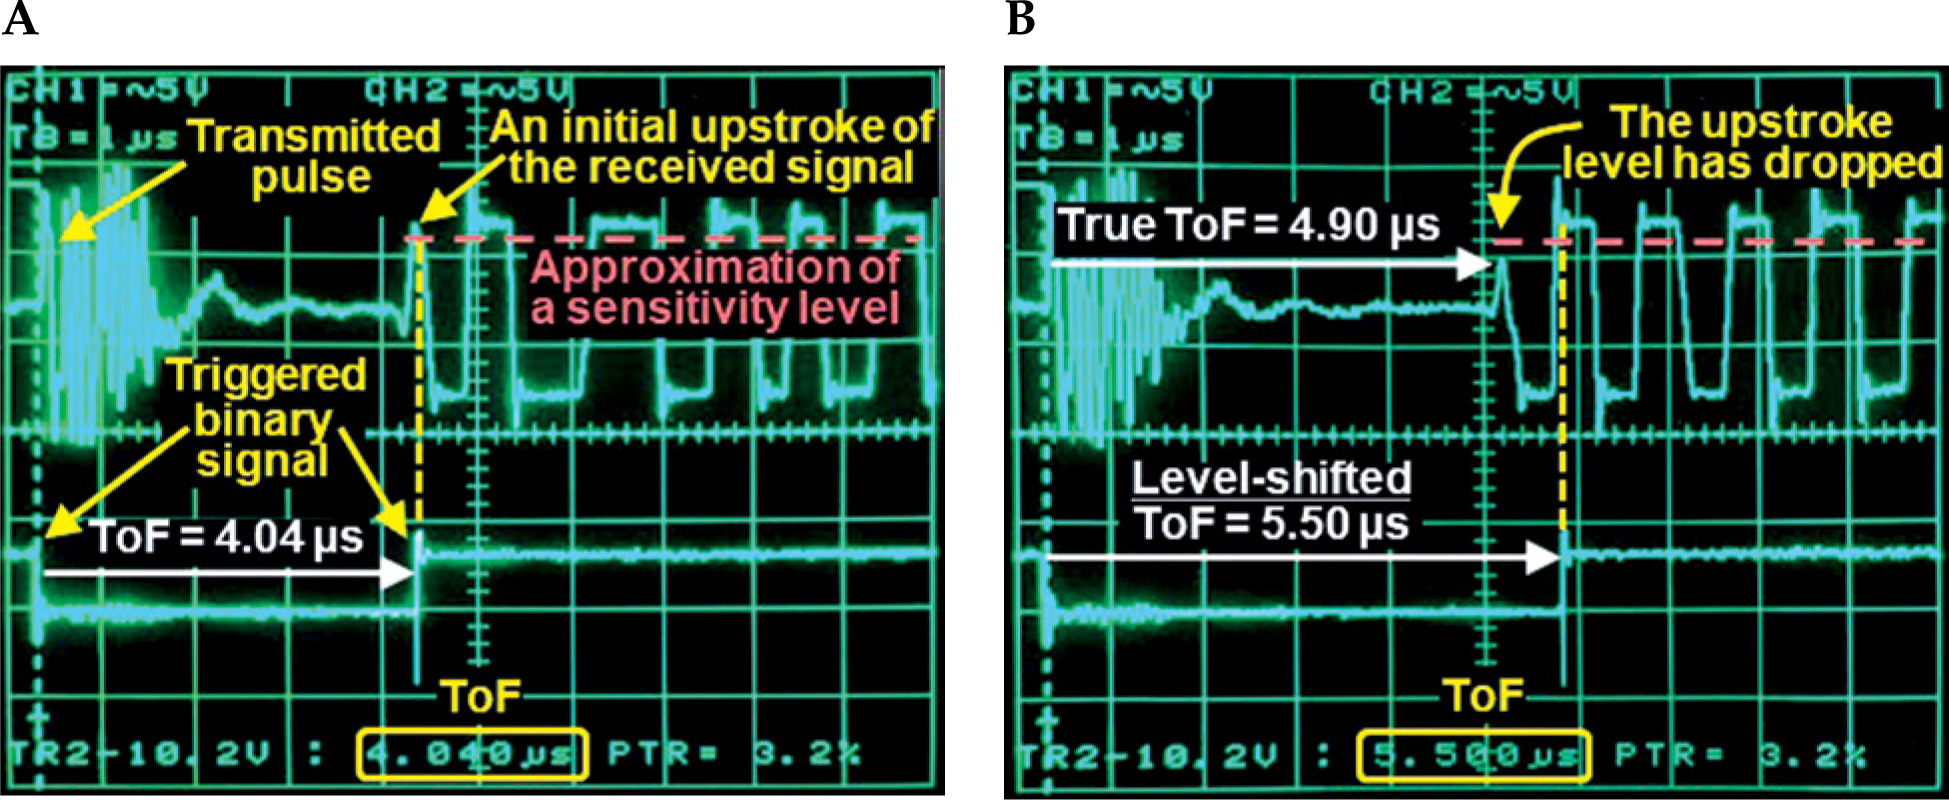
The phase and amplitude of the received signal are potential sources of triggering uncertainty. For example, suppose the initial level of the received signal is below the sensitivity level. In that case, the binary signal is triggered by an upstroke of the next cycle (Figure 2B). This phenomenon is described in the sonomicrometry software manual as a “level shift”, and inversion of the received signal is a recommended mitigation strategy.
Laboratory setup
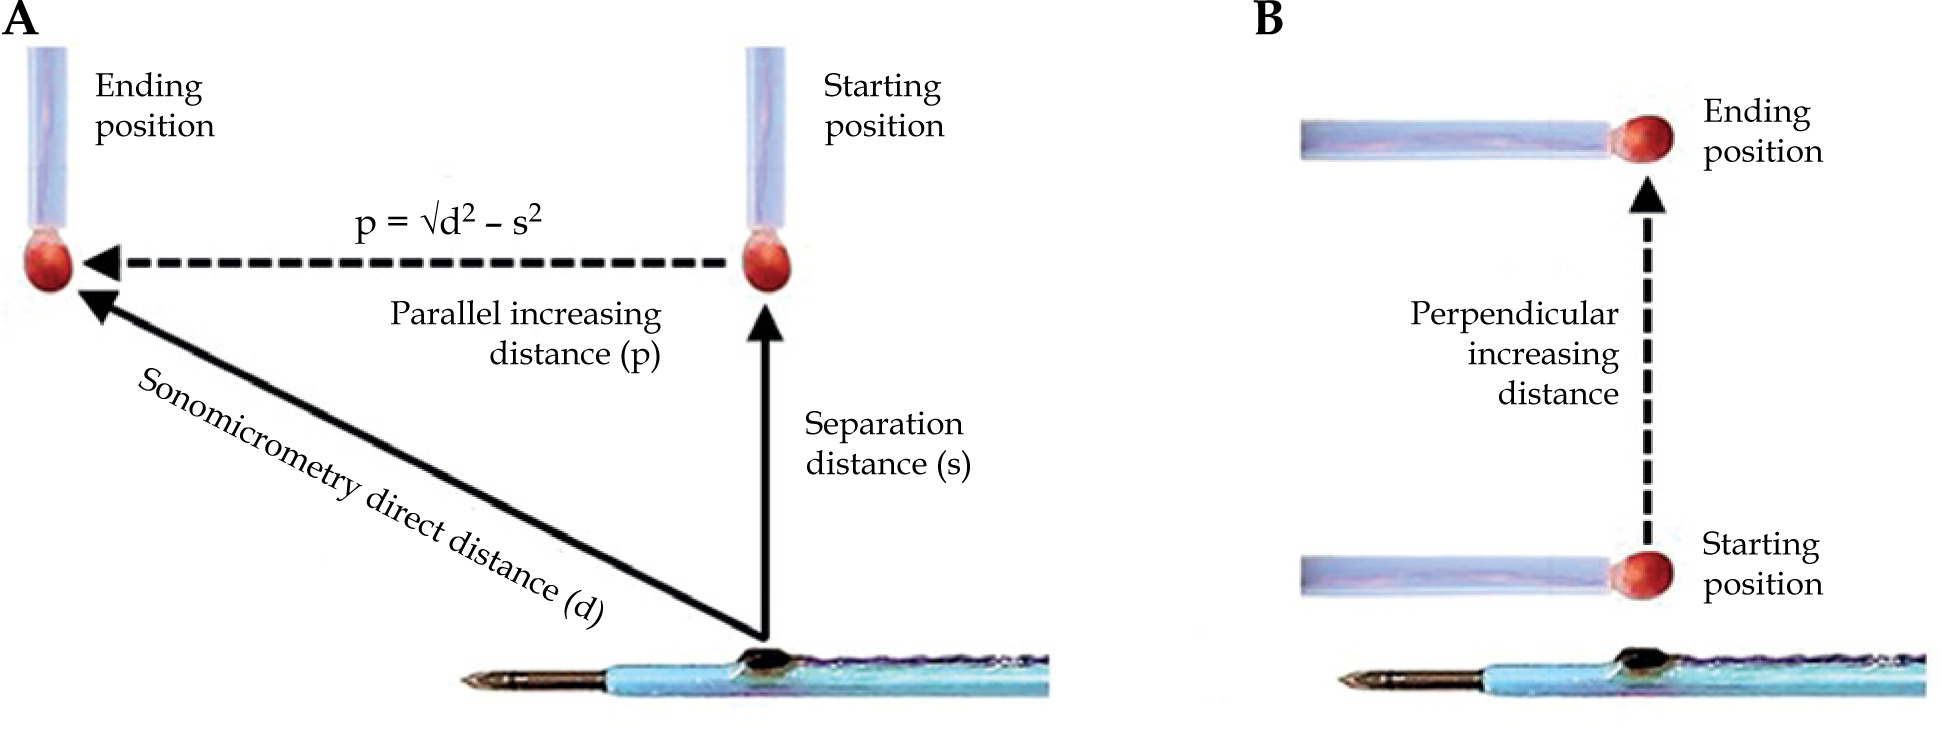
A water tank was padded with a sound-absorbing lining and filled with tap water using an ultrasound propagation speed of 1.48 mm/µs at 18°C, based on our measurements and other resources [35]. For distance measurements, the active ultrasound-tracked needle was clamped in fixed position. An independent sensor, approximately 3 mm in diameter, was attached to manual slider and advanced in direction parallel (Figure 3A) or perpendicular (Figure 3B) to the needle axis. For spatial tracking by sonomicrometry, the needle was advanced in consecutive motion steps along the face of intra-rectal probe model.
Fig. 3
Illustration of distance measurements. A) An increasing distance of independent sensor (red) in direction parallel to the needle axis. The Pythagorean theorem is used to calculate the parallel distance from the direct distance (d) measured by sonomicrometry and manually set separation distance (s). B) An increasing distance in direction perpendicular to the needle axis
Independent crystal motion and incremental distance measurements
Figure 3A illustrates the displacement of independent sensor in direction parallel to the needle axis, with the separation distance constant. The step-wise motion ended approximately 35 mm away from its starting position. Each parallel displacement was estimated using direct distances measured by sonomicrometry and constant separation distance. The shortest separation distance measured by sonomicrometry was 3 mm. Piezo-electric crystals could not be placed closer together, because their protective epoxy coating would cause the sensors to touch one another. We arbitrarily selected 2 testing distances (3.1 mm and 6.7 mm) of the independent crystal from the active ultrasound-tracked needle axis.
Figure 3B depicts displacements of the independent crystal in perpendicular direction to the active ultrasound-tracked needle axis. The independent crystal was placed at a beginning point (about 3 mm from the needle crystal) and gradually moved to a separation of 35 mm.
Triangulation of acoustic needle transition along simulated intra-rectal probe
Five tracking piezo-electric sensors were taped to the surface of the probe model to establish a Cartesian coordinate system for sonomicrometry. Using proprietary sonomicrometry software tools (CardioSoft and SonoXYZ, Sonometrics Corporation, London, Canada), the active ultrasound-tracked needle motion was triangulated from spatial distances between the needle’s positional sensor and the probe’s tracking sensors, and could be displayed as a three-dimensional (3D) wire mesh for any selected time point.
Data analysis
The distances (mm) were calculated as ToF (µs) × 1.48 mm/µs for each testing increment. Fisherbrand™ digital caliper (Fisher Scientific, Hampton, NH, USA) provided a ground truth reference of linear displacements. Normal data distribution could not be accepted; therefore, non-parametric (rank) tests were employed. Correlation plots of ranked data with a non-parametric Spearman correlation coefficient (R) assessed the linearity between the testing and reference measurements. Bland-Altman plots evaluated the agreement by the mean differences and 95% limits of agreement, i.e., ±1.96 × standard deviation (SD) of the mean difference. Wilcoxon rank-sum test determined whether the mean difference reached p < 0.05 significance level. Evaluations of spatial triangulations were qualitative. Wire mesh renderings were visually overlapped by video recordings (i.e., the reference).
Results
Distance measurements
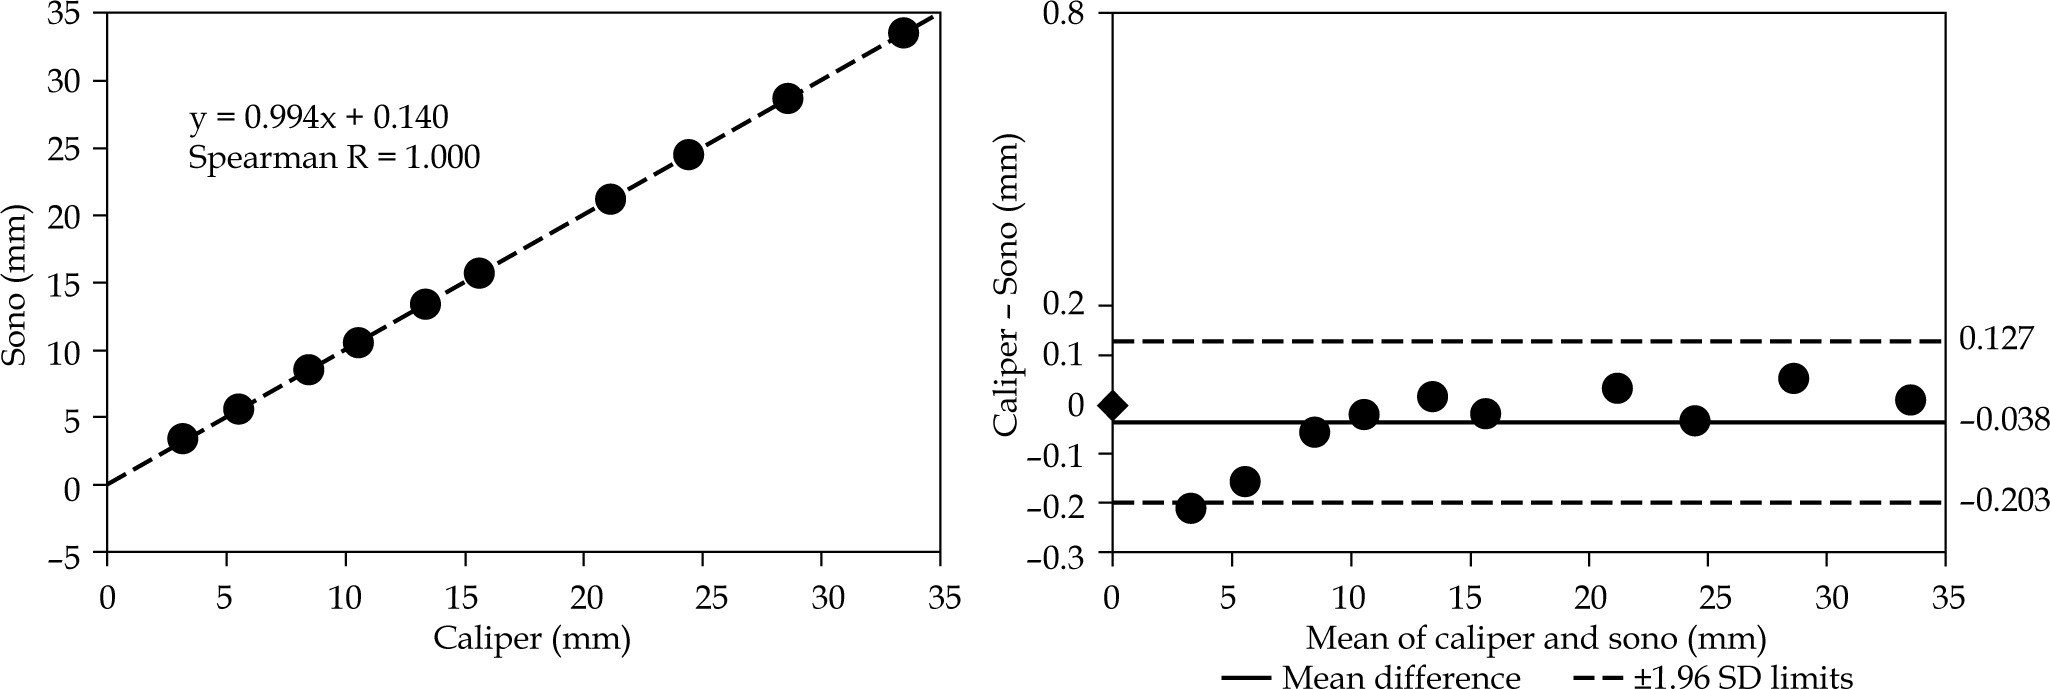
In Figures 4-6, all corresponding plots are on the same scale for ease of comparison. Correlation analyses using Spearman test achieved R = 1.000 in all tests. None of the mean differences in Bland-Altman plots were statistically significant.
Fig. 4
Distance analysis of motion parallel to the needle at 3.1 mm separation. Parallel displacement is calculated as illustrated in Figure 3A. The plot on the left presents a correlation analysis for incrementally increasing distances between the independent sensor and active ultrasound-tracked needle’s sensor. The plot on the right demonstrates an analysis of the same distances using the Bland-Altman method. It shows the mean difference between the digital caliper and sonomicrometry (sono) and ±1.96 standard deviations of the difference.
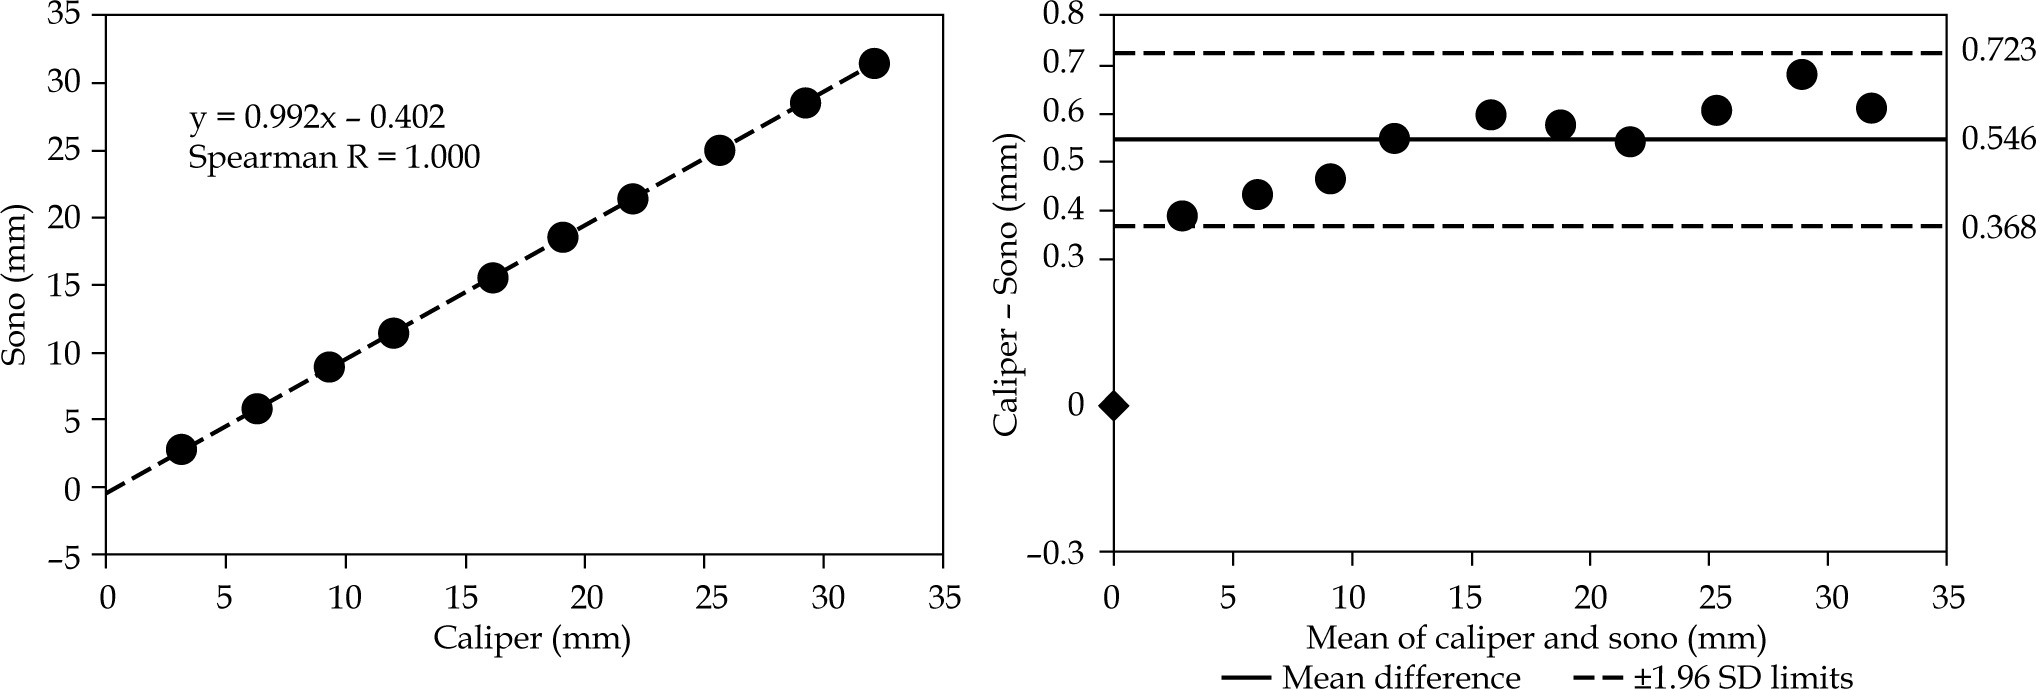
Fig. 5
Distance analysis of motion parallel to the needle at 6.7 mm separation. The distances are measured as illustrated in Figure 3A. The plots are organized as in Figure 4, including the same scale for easier visual inspection. Note the reduced mean difference compared with the 3.1 mm separation setting in Figure 4
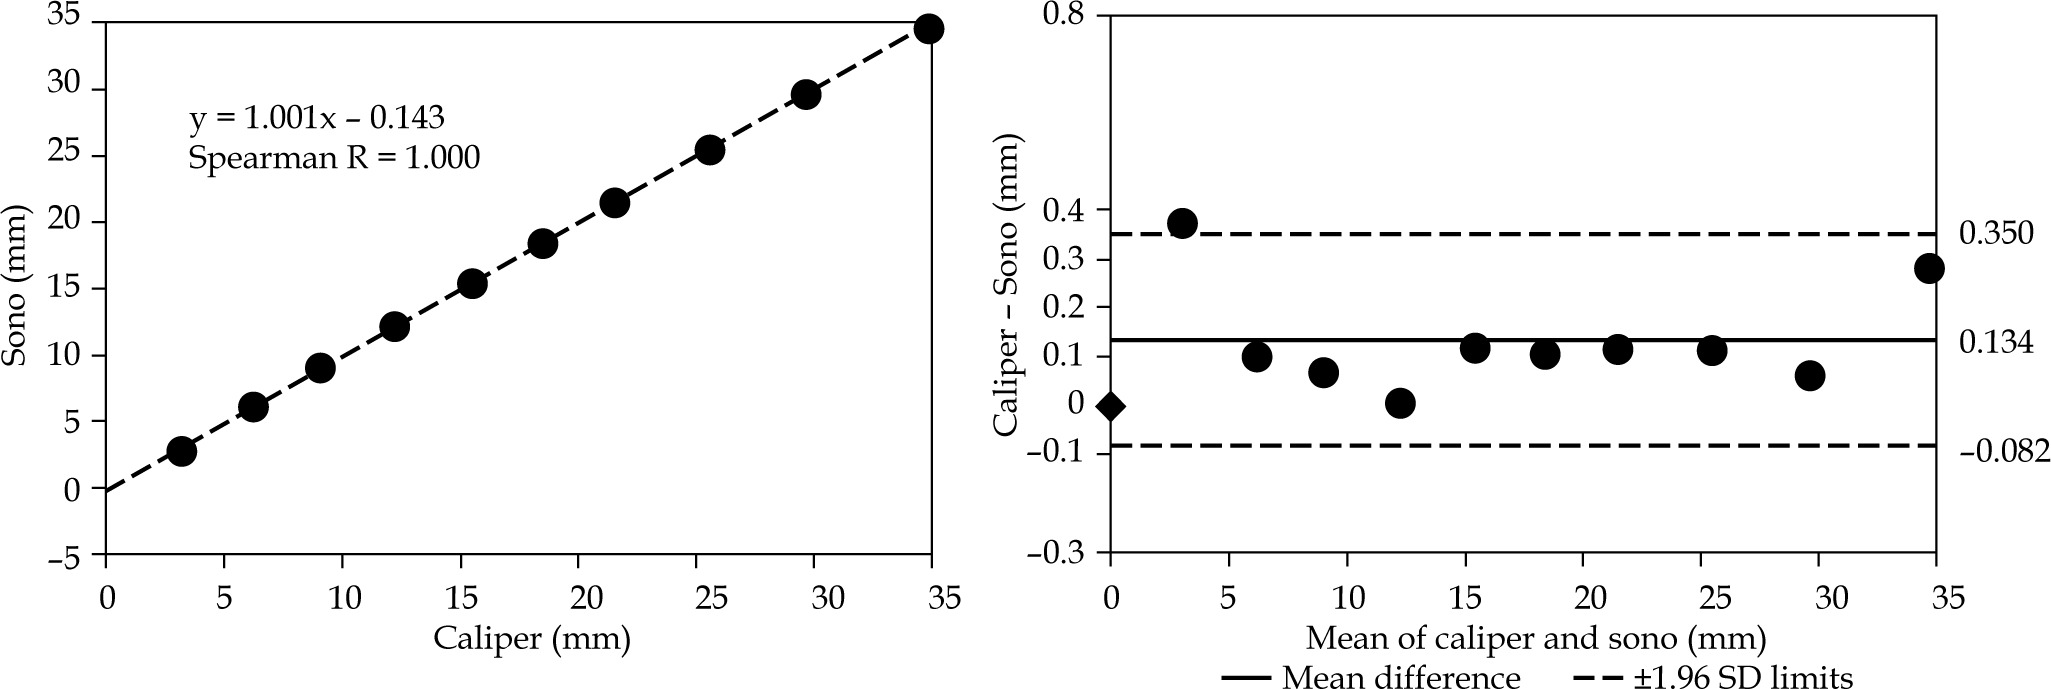
Fig. 6
Distance analysis of motion perpendicular to the needle. The distances are measured as illustrated in Figure 3B. The plots are organized the same way as in Figures 4 and 5, including the same scale for easier visual comparison
The Bland-Altman plot in Figure 4 presents the displacement agreement for the parallel motion of independent sensor at a 3.1 mm separation distance from the active ultrasound-tracked needle. The resulting mean difference was 0.546 mm with 1.96 SD = 0.177 mm.
The Bland-Altman plot in Figure 5 shows the displacement agreement for the parallel motion at a 6.7 mm separation distance from the active ultrasound-tracked needle. The mean difference was 0.134 mm with 1.96 SD = 0.216 mm.
The Bland-Altman plot in Figure 6 illustrates the agreement analysis for incremental displacements measured in perpendicular direction to the needle axis. We found a negative mean difference of –0.038 mm with 1.96 SD = 0.165 mm.
Active ultrasound-tracked needle triangulation
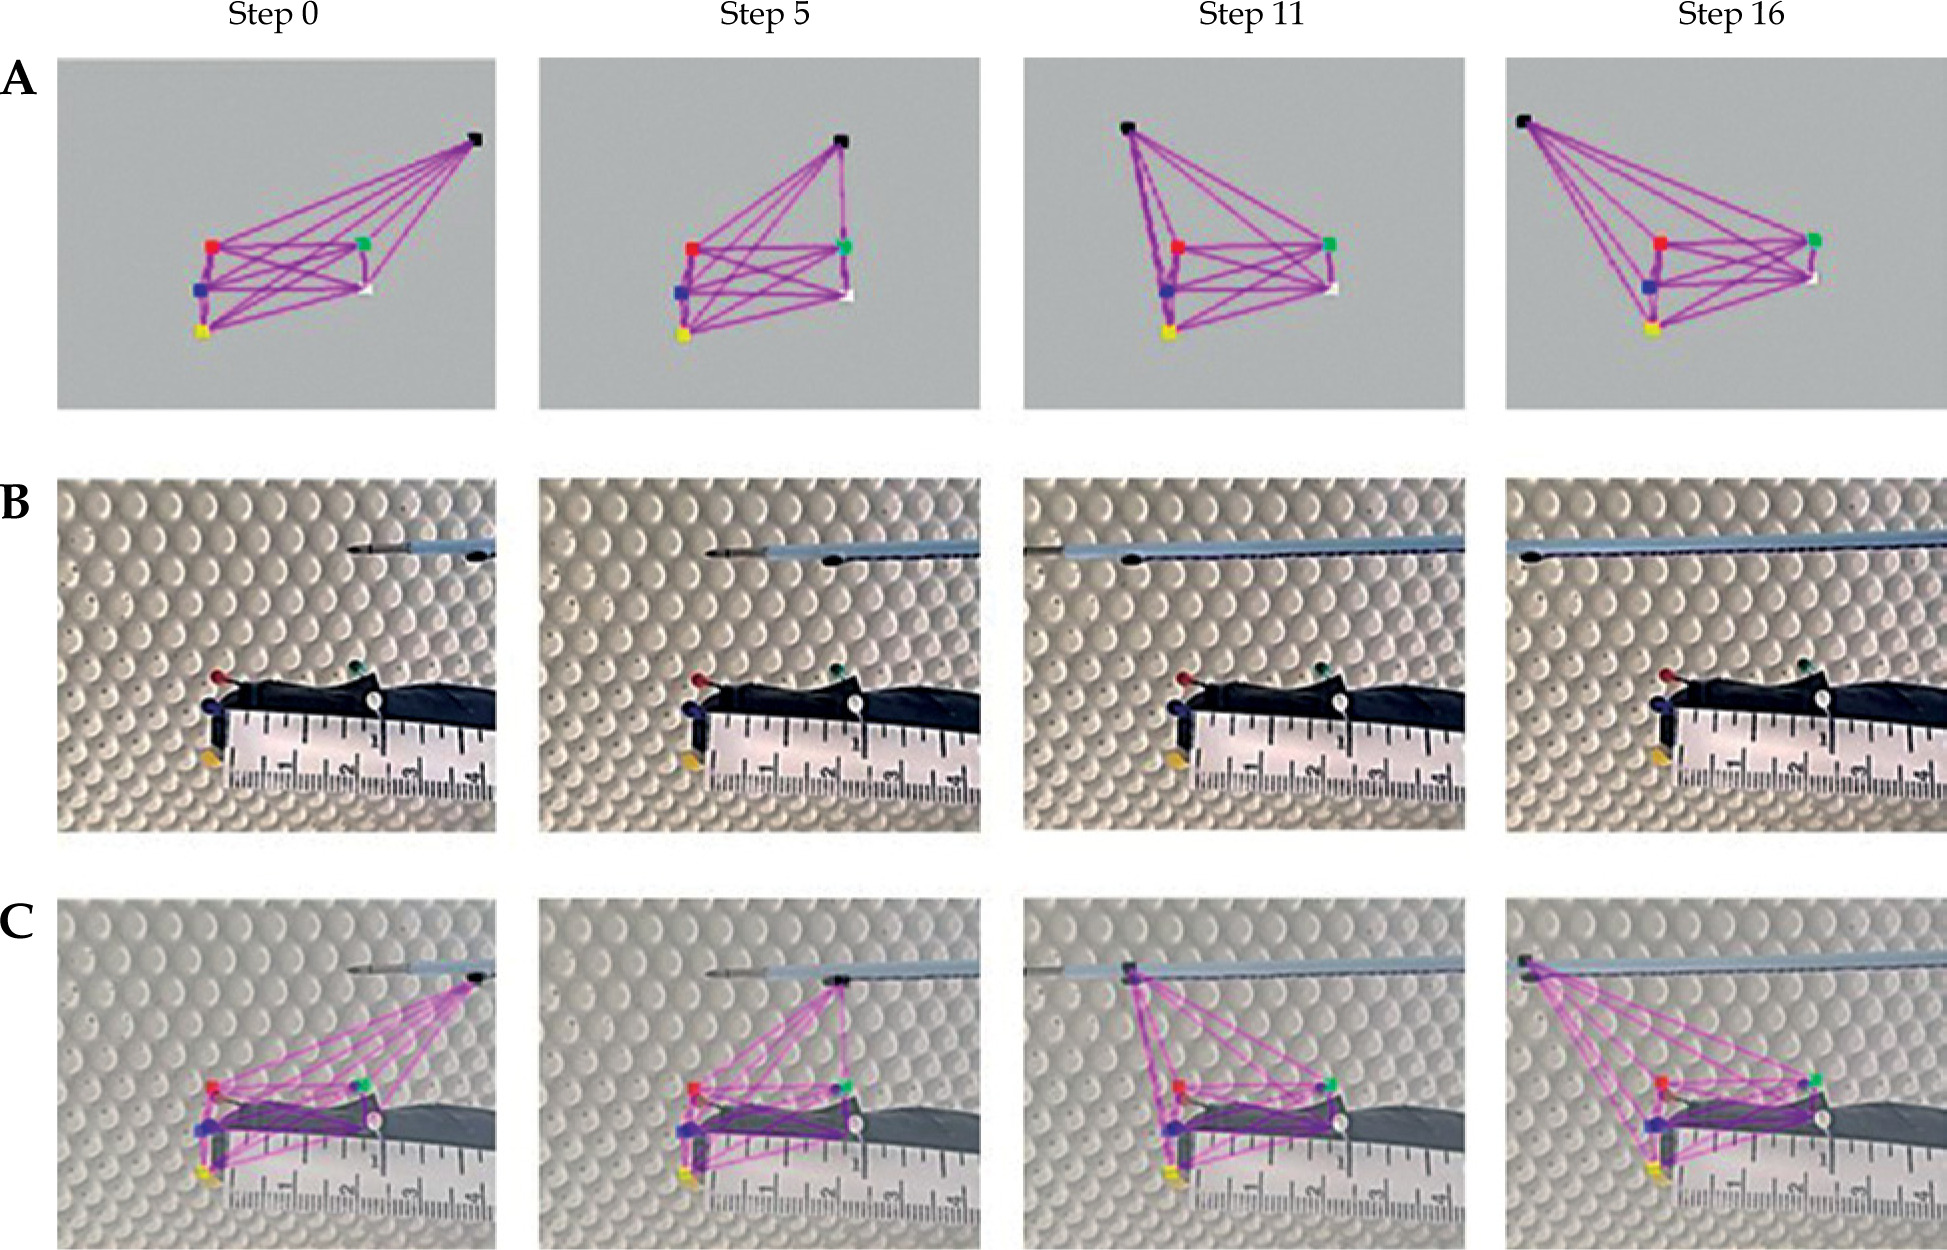
Figure 7A demonstrates virtual triangulations of the active ultrasound-tracked needle’s spatial positions, displayed as a 3D wire mesh at 4 points in time. The wire mesh time points include a beginning position (step 0) and three samples (steps 5, 11, and 16) chosen from 16 successive motion steps created by advancing the probe manually. Figure 7B shows reference video frames from a video clip recorded as the active ultrasound-tracked needle passed by the probe’s face. By overlapping frames from Figures 7A and 7B, Figure 7C illustrates how the triangulation matches the reference.
Fig. 7
Triangulation of the active ultrasound-tracked needle position and motion along the simulated intra-rectal probe in water tank. A) A wire mesh demonstrating the triangulation by sonomicrometry and tracking of the needle sensor; 4 out of 16 reconstructed time points (motion steps) are shown. B) Photographs of the simulated intra-rectal probe with red, green, blue, yellow, and white tracking sensors, and the motion steps of active ultrasound-tracked needle motion along the probe’s face. Sensors on the probe and needle correspond to those in the wire mesh reconstruction in (A). C) Superimposition of the sonomicrometry wire mesh over photographs with the moving active ultrasound-tracked needle to demonstrate its spatial tracking
Discussion
In this study, we demonstrated a functional prototype of an active ultrasound-tracked needle for brachytherapy with a piezo-electric sensor. We examined whether sonomicrometry meets our linearity, accuracy, and precision criteria for measuring prototype displacements. We then investigated whether needle motion could be actively tracked using spatial triangulation by sonomicrometry.
Active tracking techniques and the role of sonomicrometry in our prior studies
In a bench test [36] and pre-clinical research [37], we showed that a catheter tip containing a piezo-electric crystal can be actively spatially tracked by pulsed-wave Doppler imaging. In the subsequent pre-clinical studies, we acoustically tracked an injection catheter [38], an extra-corporeal membrane oxygenation cannula [39], a needle at the tip of injection catheter [40], and an intra-coronary wire [41]. Unlike previous methods used by others, our bench and pre-clinical studies accommodated a variety of actively tracked instruments, in which the ultrasound crystal was driven by a signal generator, and produced an instantaneous color marker that identified and spatially guided the instrument using conventional Doppler imaging systems without any processing console.
Sonomicrometry was employed in most of our earlier investigations [36-38, 40], but as a reliable benchmark for determining distances and a guiding marker. In the current study, sonomicrometry was not utilized as the distance standard, nor was ultrasound imaging to guide the brachytherapy needle by a marker. Instead, sonomicrometric distances between an acoustic brachytherapy needle tip and tracking crystals placed on simulated intra-rectal probe were triangulated. Therefore, sonomicrometry was re-purposed as a spatial guidance system that was principally comparable with GPS tracking.
Linearity, accuracy, and precision criteria
Parallel and perpendicular displacements of up to 35 mm were tested to evaluate a range of needle partitions, which might occur in clinical prostate brachytherapy. We deemed R ≥ 0.95, mean difference ≤ 1 mm, and 1.96 SD ≤ 1 mm as criteria of acceptable linearity, accuracy, and precision, respectively. The experimental results (Figures 4-6) confirmed that sonomicrometry meets the criteria with a considerable reserve.
Level shift and its possible impact on ToF
Considering the roughly 1 µs duration of received signal cycle, level shift events (Figure 2B) may increase ToF values to a point, where errors in distance estimations exceed our accuracy and precision limitations. By watching the signals on the oscilloscope, we eliminated the level shifts by inverting received signals, or using slightly longer or shorter distance increments. Spatial tracking of the active ultrasound-tracked needle by the triangulation method (Figure 7A) may minimize the impact of the level shifts by multi-sensor averaging.
Displacement assessment
The agreement by the Bland-Altman plot in perpendicular distances (Figure 6) was better than that in parallel displacements (Figures 4 and 5). The parallel displacements were obtained from the component (i.e., direct and separation) distances using a Pythagorean theorem (Figure 3A). We hypothesize that a small error in the component measurements translated to larger mean differences (Figures 4 and 5), compared with negligible mean difference in the direct measurements (Figure 3B) of the perpendicular displacements (Figure 6).
Theoretically, an inaccuracy of digital caliper or a lag in mechanical coupling between the moving sensor and the caliper could contribute to the mean differences. However, we compared the digital caliper with another one for the range of testing distances, and found no observable difference at a 1/100 mm level. Moreover, during preliminary (unpublished) tests, we evaluated the consistency of both increasing and decreasing step-wise displacements, which would likely reveal a culprit in the caliper or mechanical coupling.
Spatial tracking assessment
The evaluation of spatial guidance was qualitative, i.e., visual analysis of overlaps between the corresponding virtual meshes (Figure 7A) and the reference video recordings (Figure 7B), and demonstrated that sonomicrometry could closely track the active ultrasound-tracked needle motion in 3D (Figure 7C). However, due to lack of robust synchronization in the current laboratory setting, subjectivity in comparable time points (motion steps) determination could confound the ensuing overlap. Furthermore, minor imperfections in the superimposition of tracking (red, green, blue, yellow, and white) and needle positional (black) sensors in the reconstructed wire mesh (Figure 7A) with those in the related video frames (Fig-ure 7B) occurred due to the differences in planar representations of spatial perspectives between the 3D wire mesh reconstruction and the optical video recording.
It is noteworthy that the sonomicrometry software provided text files with Cartesian coordinates of all piezo-electric sensors and mutual distances of any sensor pair at 3.3 ms increments. Such high temporal resolution data are expected to promote further developments of instantaneous tracking tools and virtual models.
Study limitations and future developments
The manner of acoustic brachytherapy needle customization performed herein (Figure 1) reflected the available resources in our laboratory. In future designs, we plan to embed two or more crystals into the needle’s sleeve to define the long axis and spatial position of the tip, which will be at a constant distance from the distal crystal. Miniature ultrasound arrays in commercial products, such as Doppler wires, imply that a professionally manufactured active ultrasound-tracked needle could have positional sensors installed into its wall or the wall of a sheath, to make the design suitable for clinical prostate brachytherapy education and practice.
Mutual synchronization of 3D reconstruction and video recording will be needed for further validation steps and advancements towards real-time methodology for clinical implementation.
Due to the level shift, distance measurement variations were avoided in our controlled experimental tests. However, an automatic adaptive sensitivity setting with robust detection of ToF or an intelligent triggering mechanism could eliminate the level shift.
Conclusions
In this proof-of-concept study, we documented that sonomicrometry measurements of distances from a reference piezo-electric crystal to a working prototype of an experimental acoustic brachytherapy needle fulfilled our strict linearity, accuracy, and precision criteria. Moreover, sonomicrometry could closely triangulate the spatial position of active ultrasound-tracked needle relative to the simulated intra-rectal probe furnished with reference sensors. Therefore, the active ultrasound-tracked needle combined with sonomicrometry could be an effective planning, guidance, and quality assurance tool for transperineal prostate brachytherapy and other interstitial brachytherapy procedures.
However, the removal of level shift, instantaneous triangulation method, and advances in active ultrasound-tracked needle design must all be completed before the innovative guidance system utilization in clinical prostate brachytherapy practice.


