
Purpose
Prostate cancer is the most common form of cancer among men and the third leading cause of cancer-related deaths among men, with the American Cancer Society estimating 161,360 new cases of prostate cancer resulting in an estimated 26,730 deaths in the year 2017. For men, the current risk of prostate cancer is approximately 1 in 7, and the risk of death due to prostate cancer is approximately 1 in 39 [1]. Prostate cancer screening is done via digital rectal examination and prostate-specific antigen rating (PSA), and is confirmed through biopsy. Depending on the stage, there are several different treatment options for those diagnosed with prostate cancer, one of which is low-dose-rate (LDR) brachytherapy for the early stage disease. LDR prostate brachytherapy consists of the insertion of radioactive 125I seeds into the prostate gland through the perineum. The treatment planning and insertion of the 125I seeds are performed under transrectal ultrasound (TRUS) imaging guidance. TRUS offers real-time imaging capabilities; it is easy to operate and relatively inexpensive [2,3,4].
TRUS images acquired intraoperatively are utilized for the delineation of the prostate and the surrounding organs at risk (OARs), like the bladder and rectum. The delineation of the target and OARs is usually performed on the acquired ultrasound slices. Accurate definition of the prostate and OARs is critical for accurate seed placement during the treatment planning stage.
Despite of the convenience of using TRUS for LDR prostate brachytherapy, TRUS is not ideal for identifying localized prostate cancers; it has variable inter-patient image quality and has more inter-observer variability in delineation of prostate, specifically at the base and apex [5]. On the other hand, MRI has significantly higher soft-tissue contrast that could improve accuracy of prostate contouring, especially at the base and apex, and also allow to identify specific regions within the prostate [2,3,4,5,6,7,8,9,10]. Therefore, MRI is an attractive imaging modality to support LDR prostate brachytherapy.
The focus of this retrospective study is to test feasibility and explore benefits of using TRUS-MRI image fusion intraoperatively to support LDR prostate brachytherapy. In this study, we verified the validity of image registration at the apex and base of the prostate gland, measured the dosimetric effects of prostate volume contouring using TRUS-MRI image fusion, and evaluated treatment plans on specific localized tumor regions within the prostate that were identified using MRI.
Material and methods
Data
In this institutional review board (IRB) approved retrospective study, 14 prostate cancer patients that had undergone both a pre-biopsy MRI and a 125I permanent prostate seed implant with a lifetime dose of 144 Gy, were randomly selected. Their diagnostic data is summarized in Table 1. All patients were staged T1C. The risk evaluation was based on the National Comprehensive Cancer Network guidelines [11]. The transrectal ultrasound (TRUS) images with 5 mm slice thickness were captured intraoperatively during the procedure. The axial T2-weighted MRI image sets (three-dimension fast spin-echo pulse sequence) were obtained, with 1 mm slice thickness as a part of a multiparametric MRI protocol performed on a 3-Tesla scanner (Skyra, Siemens Healthineers, Malvern Pa, USA). The MRI acquisitions were done on average 107 ±57 days (range, 36-263 days) before seed implant procedures.
Table 1
Summary of diagnostic parameters for the 14 patients studied
All 14 TRUS image sets had the prostate, bladder, and rectum volumes delineated intraoperatively by an experienced urologist and radiation oncologist working together for treatment planning purposes using Variseed 9.0 software. A catheter was not used intraoperatively in order to define the urethra because of possible error. The prostatic urethra is a collapsed 3-pointed star, and a catheter in the urethra will naturally dwell in one of the three “points” of the star and give a false impression of the urethra’s location. The intraoperative team includes an experienced radiation oncologist, a urologist, and a medical physicist. The MRI images were not used during the seed implant procedure. To test the feasibility of using MRI intraoperatively, the prostate volume was delineated in all 14 MRI axial image sets retrospectively by an experienced radiologist and reviewed by the radiation oncologist. The tumors were visible on T2-weighted images and contoured by the radiologist in only 5 of the 14 patients, and included 2 tumors in the peripheral zone posteriorly and 3 tumors in the transition zone anteriorly.
Fusion
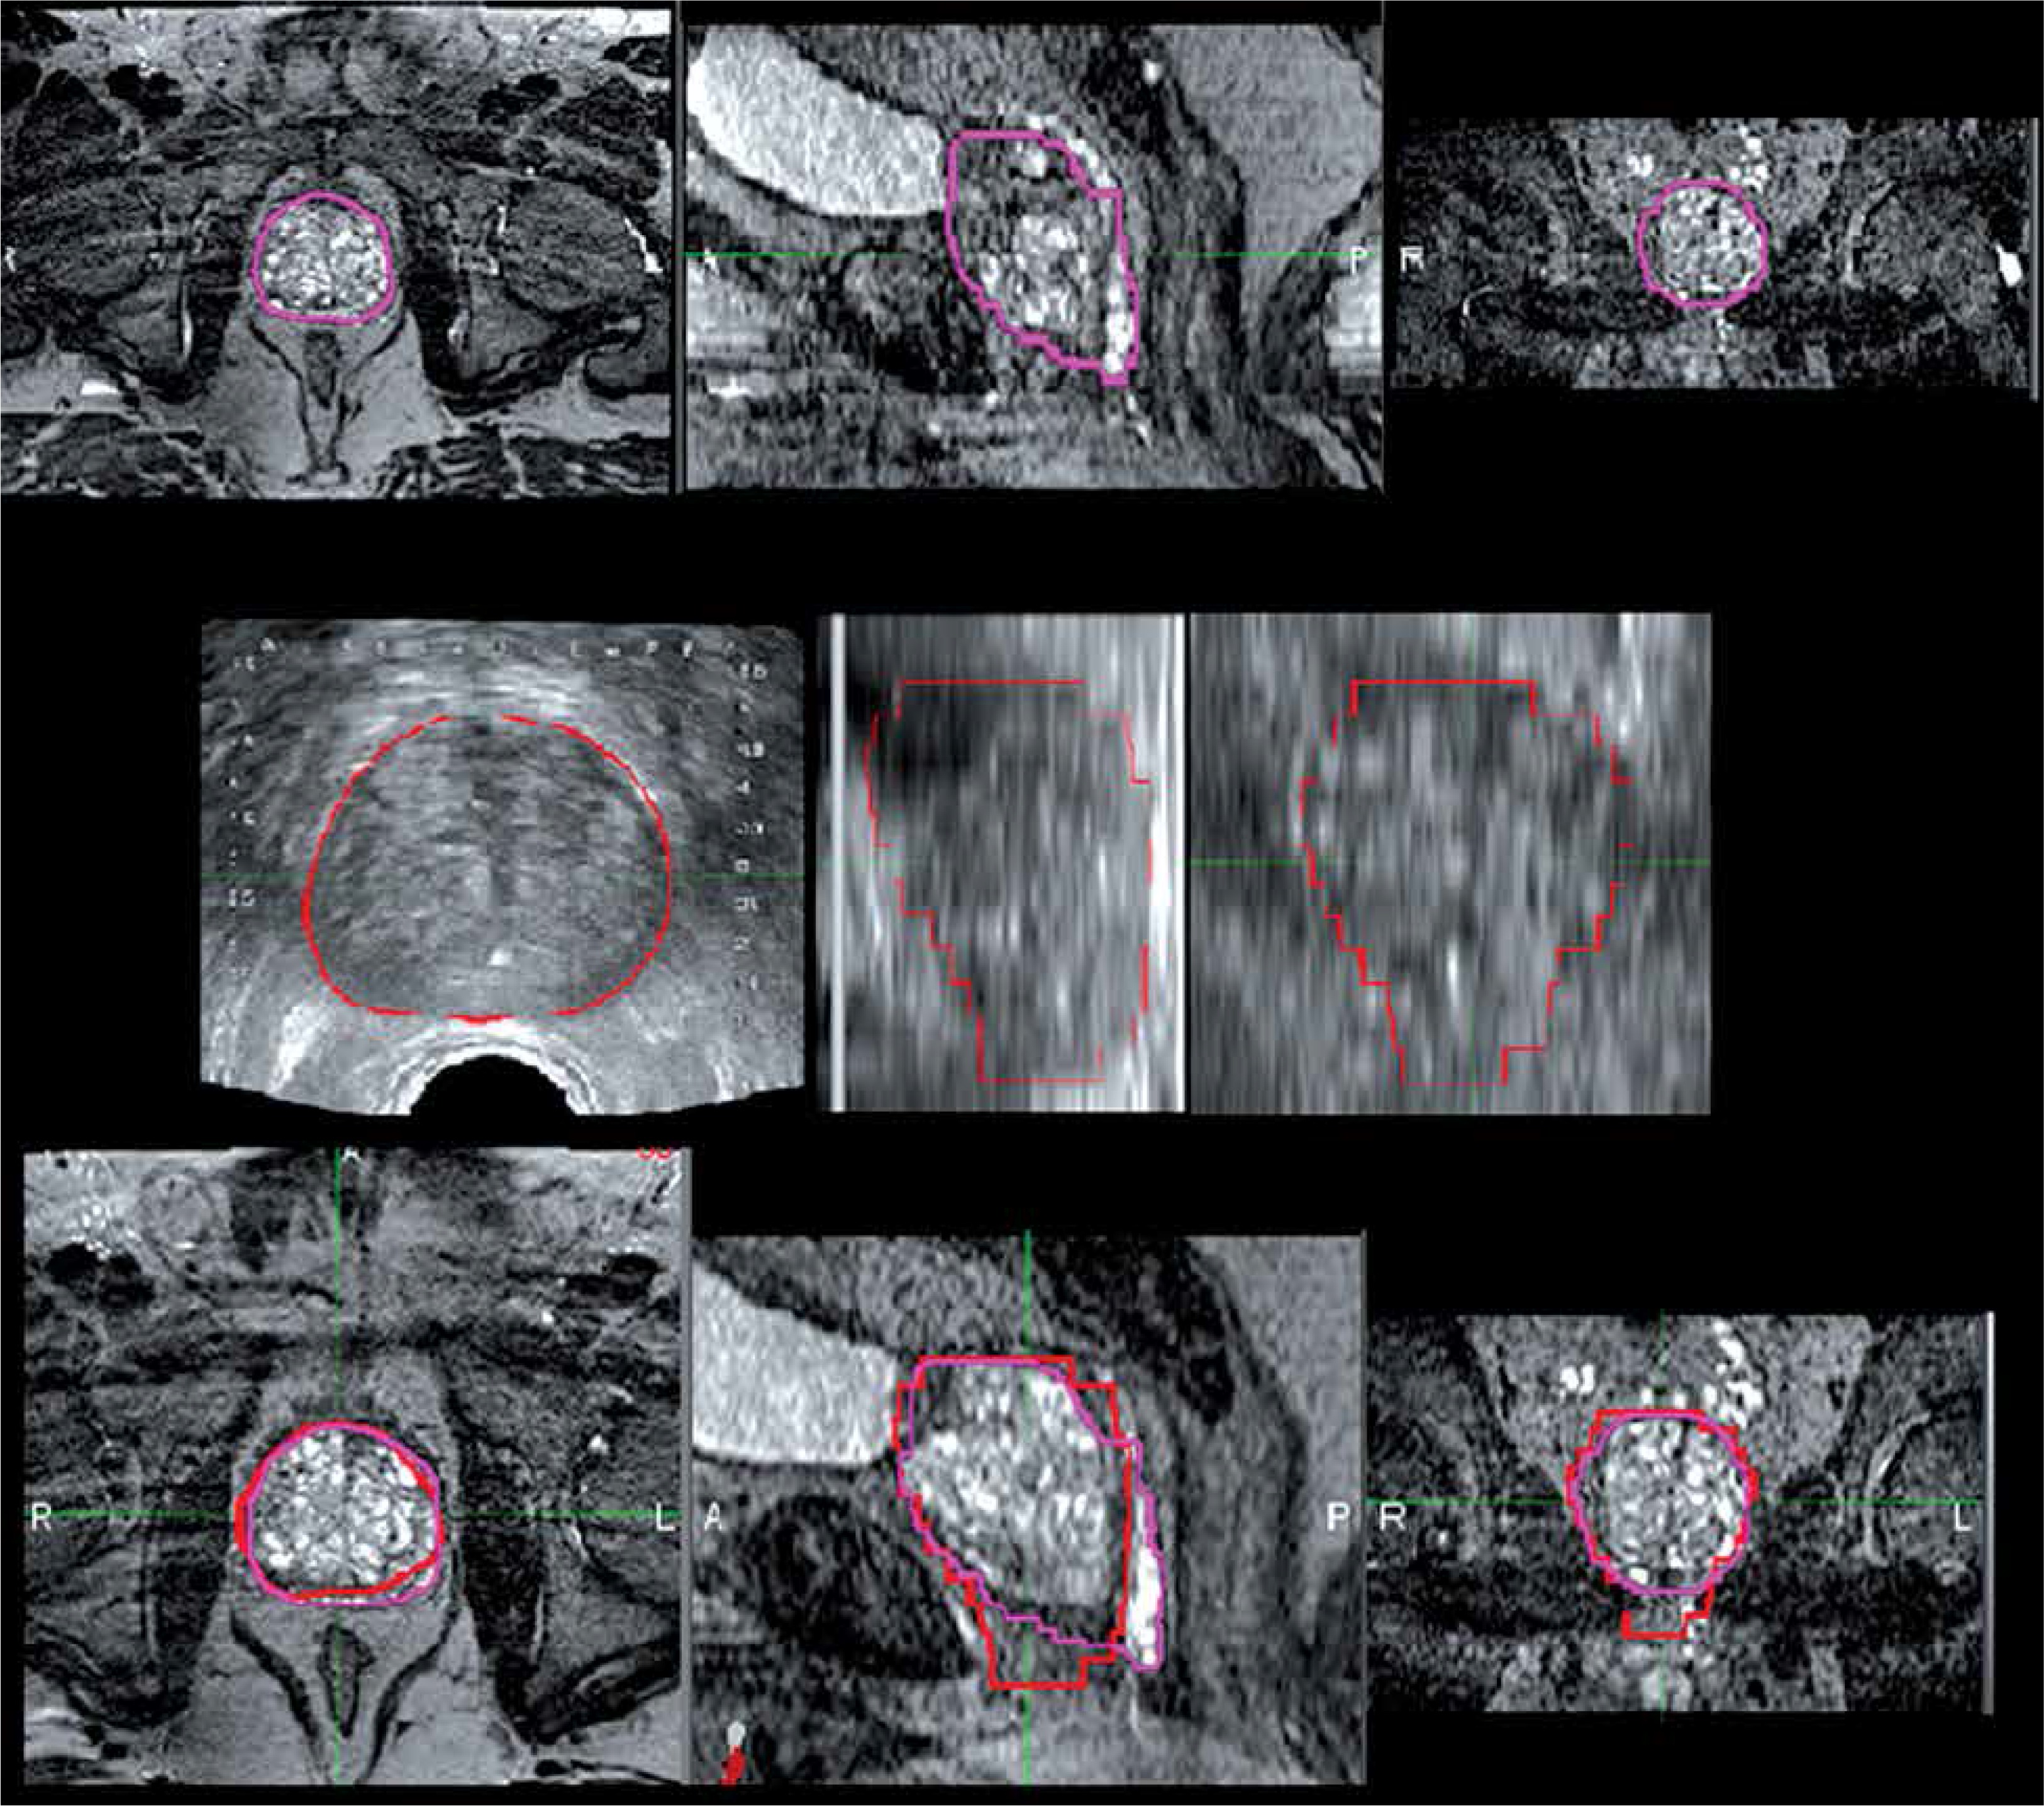
The MRI image set was fused to the TRUS image set in Variseed 9.0 using a rigid and manual image registration technique, with 3 matching points at the apex and base of the prostate border near the bladder and rectal wall, respectively, on both MRI and TRUS images to assist in iterative manual fusion process. An example of fusion with contours is shown in Figure 1. Due to resolution of differences of MRI and TRUS images in cranio-caudal direction, the contours delineated on MRI were reviewed by the radiation oncologist before contour comparison and dosimetric evaluation. Finally, the prostate volume was re-contoured using the fused image sets (MRI-TRUS) by the radiation oncologist to simulate the use of this data fusion intraoperatively.
Treatment planning
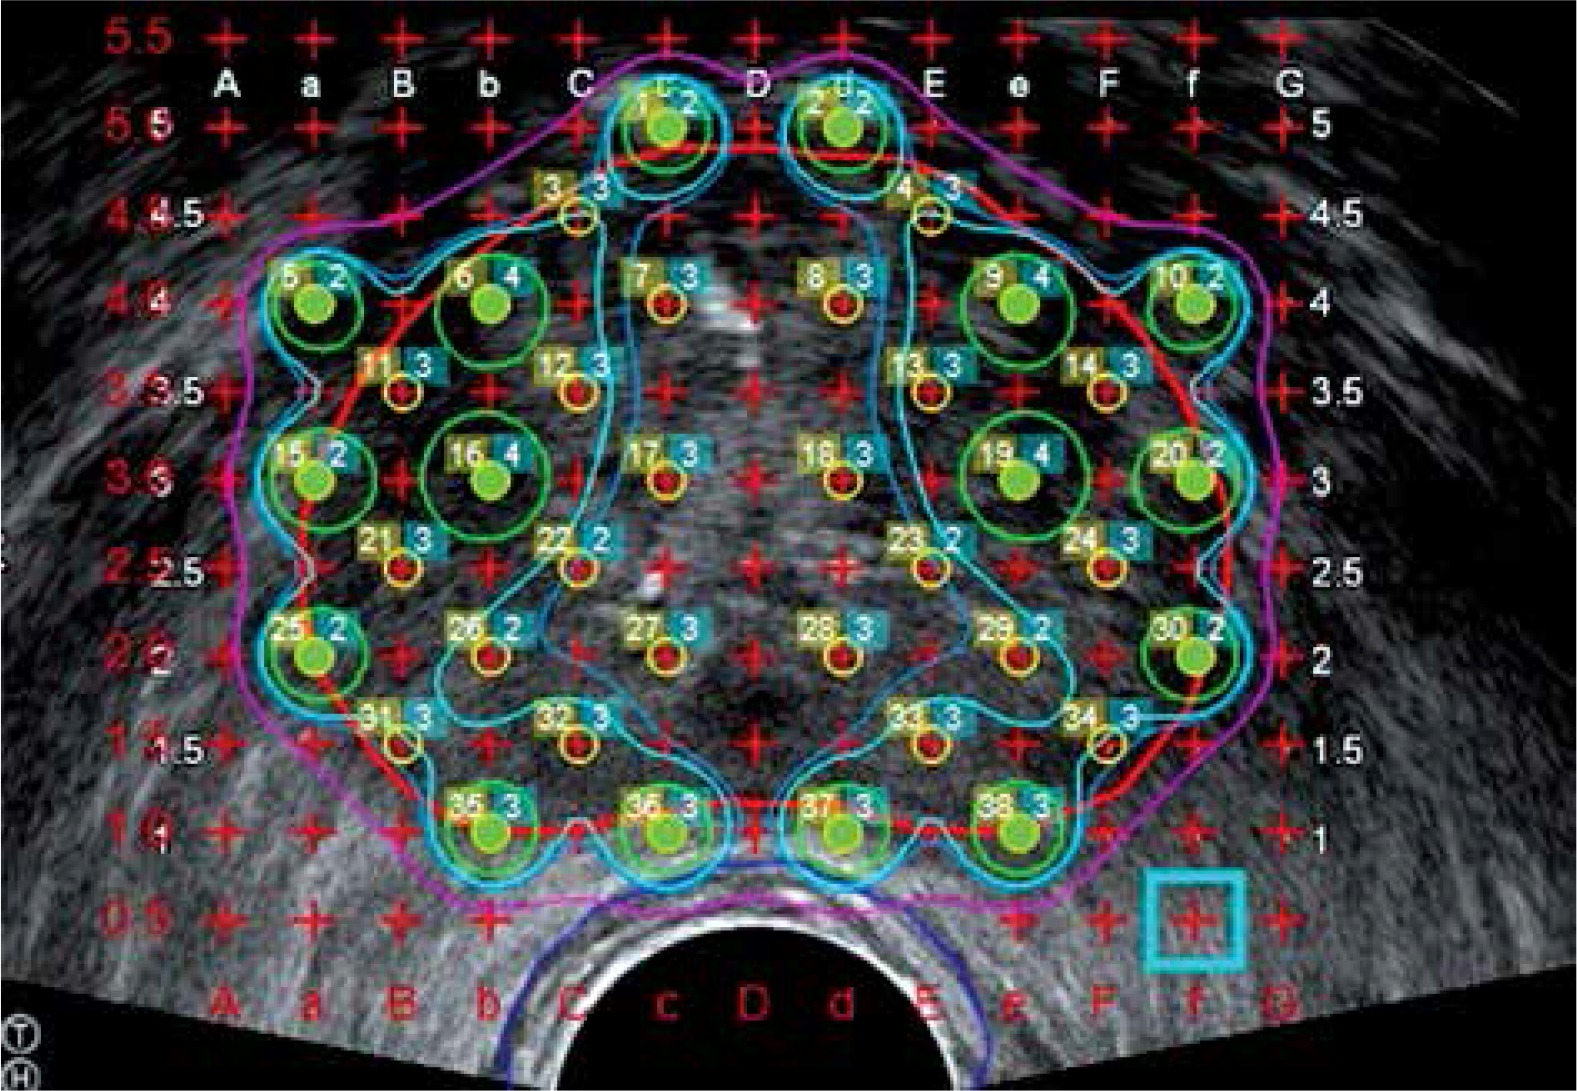
All treatment plans used for dosimetric comparisons were the treatment plans generated intraoperatively. The method of treatment planning employed is a modified peripheral loading technique. This technique was used to account for the urethra by leaving the center of the gland cooler (< 150% of prescription), while maintaining whole prostate coverage with ~5 mm margin by emphasizing seed placement on the periphery of the gland, as shown in Figure 2. Larger margins are usually used for high-risk patients.
Fig. 2
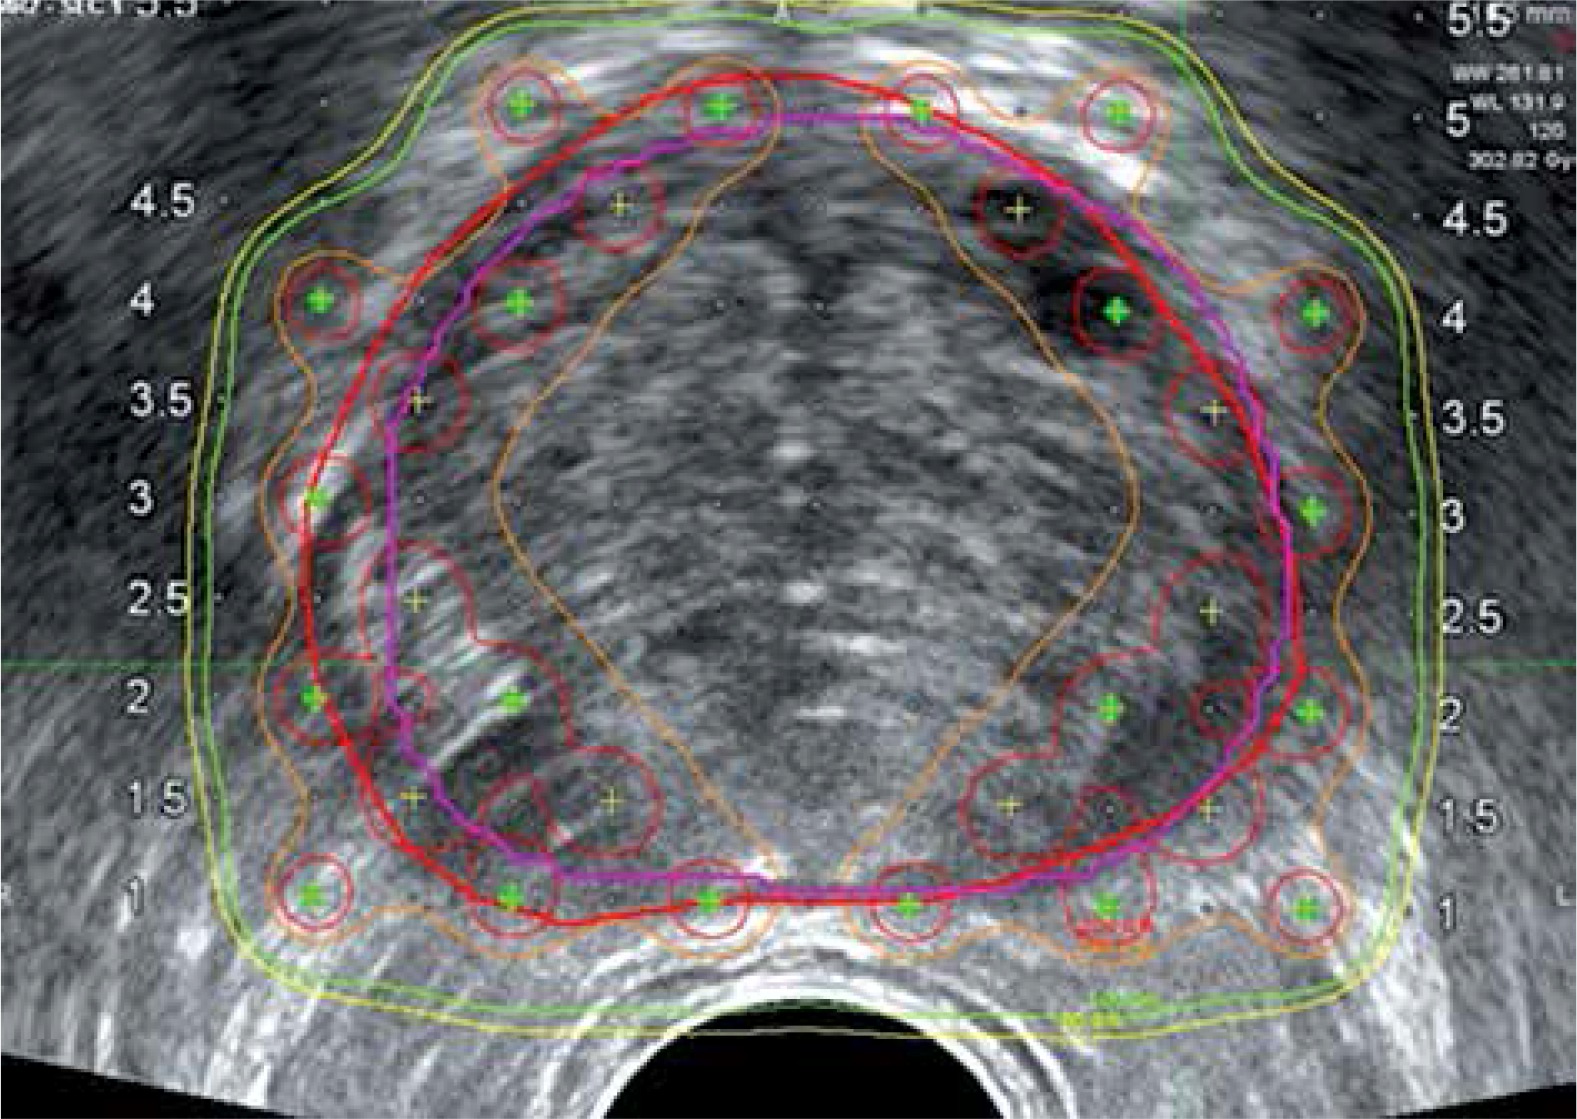
Modified peripheral loading technique is employed for intraoperative treatment planning using TRUS images only. The center of the prostate is left cool to account for the presence of the urethra and to avoid urethral complications. Seeds are placed on the periphery of the gland to allow for a margin of the 100% isodose line (purple) to account for contouring inaccuracies
Data analysis
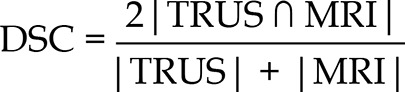
The prostate volume delineated intra-operatively using TRUS was compared to the prostate volume delineated by the radiologist using the MRI as well as the fusion based prostate contour (MRI-TRUS). The DICE similarity coefficient (DSC), percentage volume difference, and the location of largest difference were determined using prostate volumes in both imaging modalities after performing manual fusion. The DSC is used to compare the similarity between the MRI and TRUS prostate volumes and is calculated using the following equation:
The differences between TRUS and MRI in prostate length, width, and height were also calculated by measuring in the transverse, coronal, and sagittal planes.
To assess the dosimetric effects of the differences in prostate volume contouring depending on the technique used, the original treatment plan generated intraoperatively was evaluated using the initial prostate volume generated intraoperatively (used in patient’s treatment planning) and the new prostate contour that was generated using the TRUS-MRI image fusion.
DVHs were analyzed to determine the recommended dosimetric parameters described by the AAPM Task Group 137 for the prostate. Currently, there are no dose recommendations for localized tumor volume, so the dosimetric comparison of the tumor volume in the 5 tumors visible on T2-weighted images was also completed using the same dosimetric parameters and constraints as the entire prostate gland, as mentioned above. The following pre-implant dosimetric constraints were evaluated:
Prostate:
V100 (% of prostate volume receiving the prescription dose and must be at least 95%);
D90 (% of prescription dose that covers 90% of the prostate volume and should be greater than 100% of prescription dose);
V150 (% of prostate volume receiving 150% of the prescription dose and should be less than or equal to 50%).
Three of the cases (tumors located anteriorly) were re-planned to achieve similar V150 as the entire prostate to simulate a dose escalation scenario. All determined values were compared using the Wilcoxon signed-rank test, considering a p value < 0.05 to be statistically significant.
Results
The prostate volumes delineated using the TRUS images (intraoperatively) and using MRI-TRUS fusion were respectively 8 ±10% and 14 ±7% smaller than the ones delineated on MRI images by the radiologist (p < 0.05). The individual patient prostate volume comparisons and the regions of largest differences for each patient are shown in Table 2. Prostate gland contours were larger in 9 areas in intraoperative TRUS images compared to MRI, with 5 occurring at the base of the gland and 4 occurring at the apex of the gland. The contours were smaller in 5 areas, with 2 occurring at the apex, 1 at the base, and 1 at both the apex and base. There was also one instance where the main difference was in the body of the gland due to the large deformation caused by ultrasound probe. The mean DSC was 0.78 ±0.09 showing reasonable agreement between prostate contours in TRUS and MRI images (0.77 is classified as the “substantial” category; 0.61-0.80 in κ statistics) [12]. These differences are presented in Table 2. The mean difference in the height of the gland between TRUS and MRI was –2.6 ±5.4 mm (p = 0.11), the width of the gland was –0.3 ±3.5 mm (p = 0.78), and the length of the gland was –2.6 ±4.6 mm (p = 0.07), with the individual differences being shown in Table 3.
Table 2
The individual patient volume differences can be seen between TRUS-based prostate volume, MRI-based prostate volume, and MRI-TRUS fusion-based prostate volume for all 14 patients with the region of largest differences identified for each patient. DSC is calculated between TRUS and MRI volumes only
| Prostate volume comparison | |||||
|---|---|---|---|---|---|
| Patient number | DSC | TRUS [cc] | MRI [cc] | MRI-TRUSfusion [cc] | Region of difference |
| 1 | 0.86 | 42.0 | 42.8 | 38.2 | Base |
| 2 | 0.83 | 62.8 | 62.0 | 59.3 | Apex |
| 3 | 0.85 | 36.6 | 35.0 | 33.6 | Apex |
| 4 | 0.53 | 27.0 | 29.2 | 25.0 | Base |
| 5 | 0.77 | 33.9 | 36.5 | 30.1 | Apex |
| 6 | 0.80 | 32.0 | 44.4 | 32.2 | Apex/base |
| 7 | 0.76 | 41.1 | 46.4 | 39.0 | Base |
| 8 | 0.78 | 21.4 | 23.4 | 21.0 | Base |
| 9 | 0.67 | 52.4 | 66.7 | 55.0 | Base |
| 10 | 0.82 | 83.7 | 84.3 | 68.8 | Apex |
| 11 | 0.73 | 22.4 | 25.6 | 19.5 | Apex |
| 12 | 0.76 | 39.0 | 35.4 | 33.2 | Base |
| 13 | 0.88 | 40.0 | 46.0 | 39.9 | Apex |
| 14 | 0.82 | 27.4 | 31.4 | 27.5 | Body |
| Average ±SD | 0.78 ±0.09 | 40.1 ±16.2 | 43.5 ±16.5 p < 0.05* | 37.3 ±14.0p < 0.05* | |
Table 3
Dimensional differences in length, width, and height of the prostate in TRUS images vs. MRI images for all 14 individual patients
The dosimetric evaluation of the new MRI-TRUS image fusion-based prostate contour revealed an average difference of –0.5 ±1.1% for V100 (p = 0.25), –1.3 ±1.1% for V150 (p = 0.06), and –0.7 ±0.6% for D90 (p = 0.15) from the original TRUS prostate contour used for treatment planning, as seen in Table 4.
Table 4
Dosimetric constraints, V100%, D90%, and V150% for all 14 patients and the differences between the original treatment plan parameters (TRUS prostate) and the parameters in the new, fusion-based prostate volume
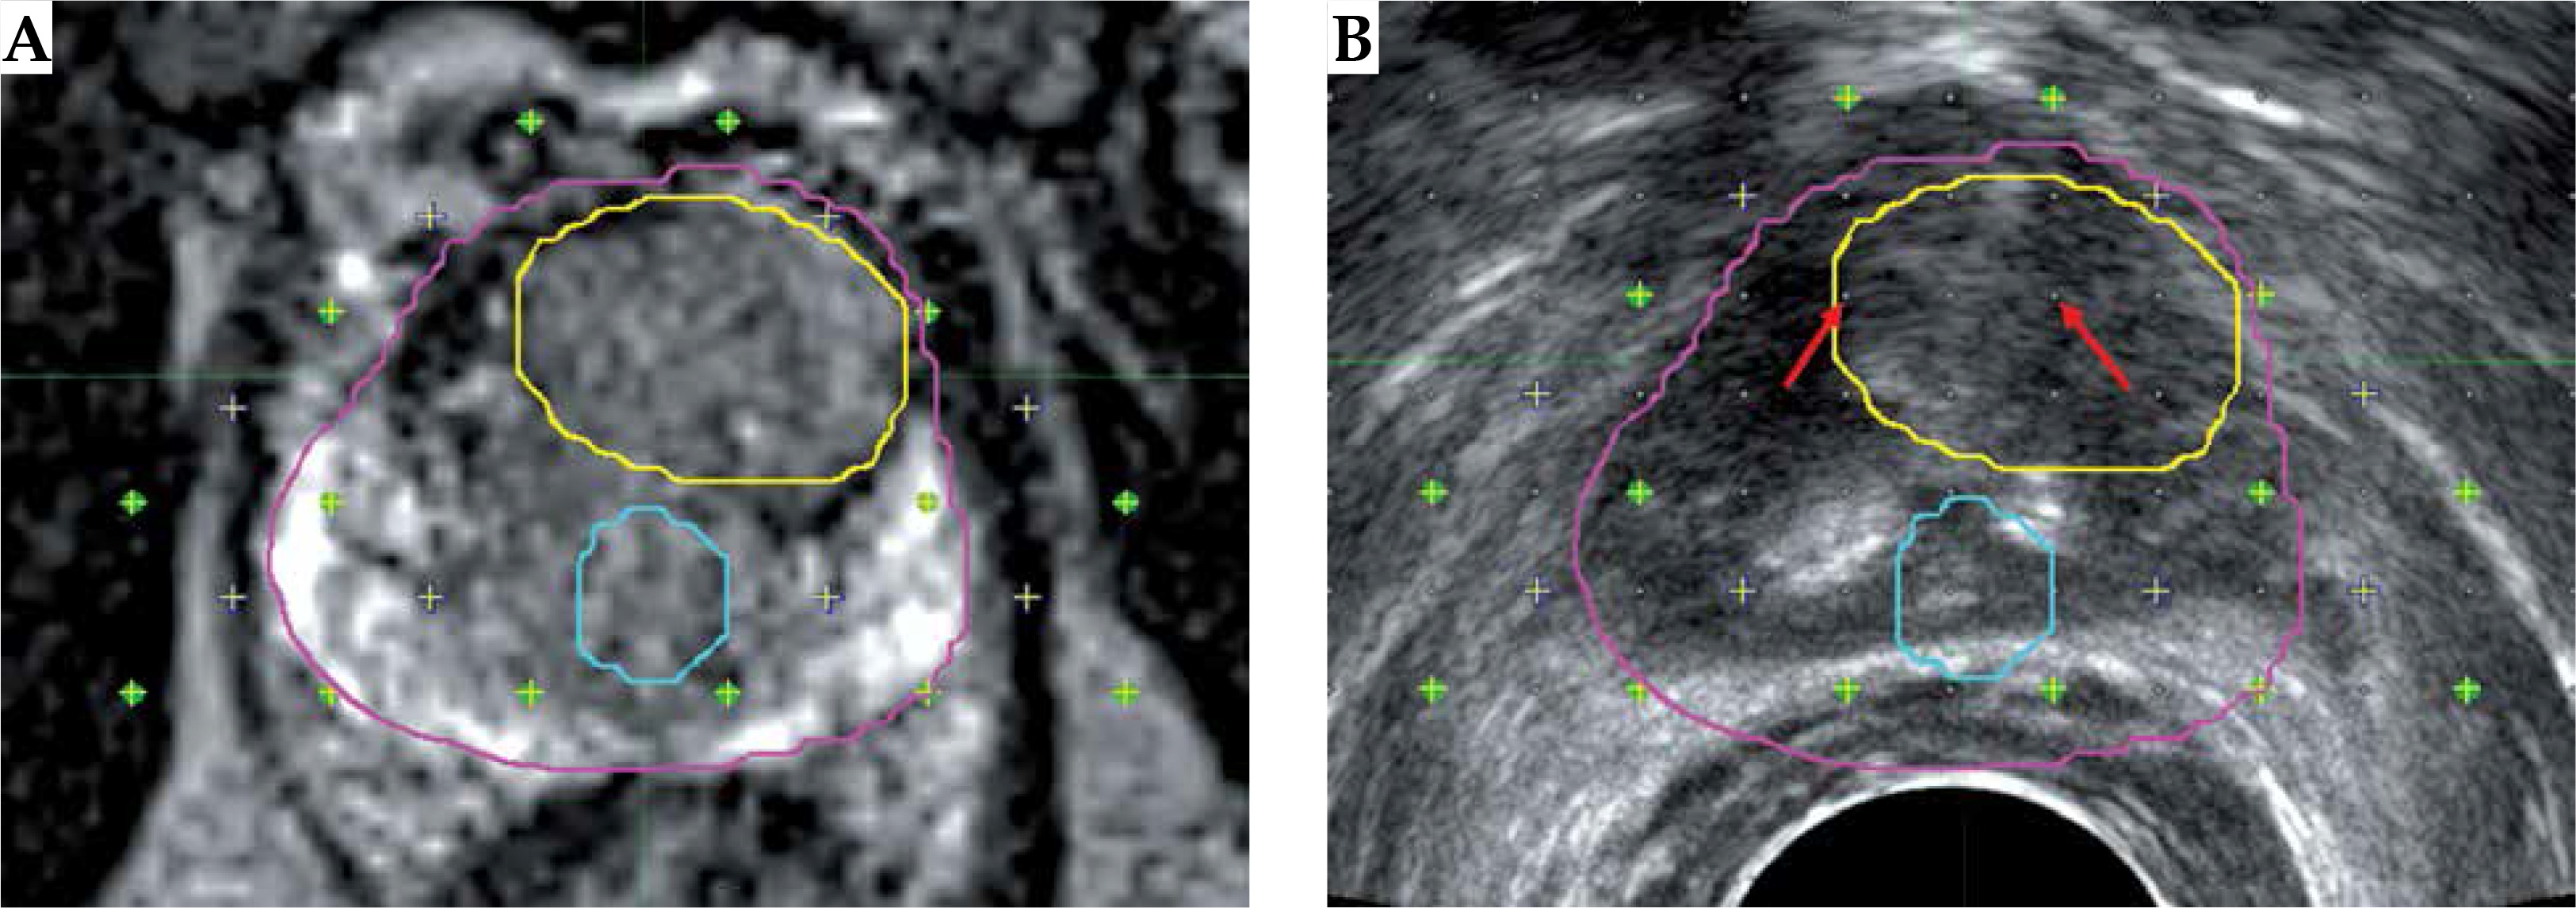
The dosimetric comparison of the localized tumors delineated in MRI image against the original TRUS prostate contour used in treatment planning showed a mean percent difference of –0.7 ±24.8% for V150%. The mean difference was 26.1 ±7.6% (p = 0.12) for posteriorly located tumors and –18.5 ±17.7% (p = 0.21) for anteriorly located tumors. Dosimetric results varied based upon the anatomical location of the tumor with anteriorly located tumors receiving a lower V150% compared to tumors located posteriorly, as shown in Table 5. The cases with anteriorly located tumors were re-planned to increase the tumor V150%. All plans achieved tumor V150% higher than the prostate by inserting two seeds within or near the tumor, as shown in Figure 3 (red arrows). The mean difference in V150% was 15.6 ±14.6% after re-plan. For the re-planned cases, the urethra D1 cc (dose to 1 cc volume of urethra in % of prescription dose) increased to 131.1 ±10.9% compared to 125.6 ±12.4% in the original plans.
Table 5
Differences in V150% for the localized tumor volume and the prostate volume originally used in treatment planning, categorized by the anatomical location within the prostate gland that the tumor region is located. Anterior cases were re-planned to increase V150% to the tumor
Fig. 3
MRI (A) and TRUS (B) images with prostate (pink), urethra (blue), and tumor (contours). Contours from MRI images mapped onto TRUS after rigid fusion. Green dots are the locations of the planned seed locations. Anterior section, where the tumor is located, did not have seeds to cool off the urethra, which happened to be more posterior for this patient. Red arrows show the location of implanted 2 seeds during simulated re-planning to increase tumor dose
Discussion
In this retrospective study, we simulated using pre-operative MRI imaging in the operating room (OR) treatment planning process by rigid fusion to the intraoperatively acquired TRUS image set. A similar volumetric and dosimetric study of 8 patients has been done using a combined rigid and elastic surface registration by Daanen et al., where they had also utilized pre-operative T2-weighted MRI images fused to axial TRUS images, using octree-spine image registration for prostate contouring. They reported that TRUS contours were most often underestimated compared to their fusion-based contours. Our volume results also show that TRUS contours were smaller compared to MRI contours (p < 0.05) and the TRUS-MRI fusion contours were significantly smaller from TRUS contours (Table 2). They also compared the V100% and D90% using the TRUS and fusion-based contours, and showed an up to 10% dosimetric difference in terms of V100% due to the contouring inaccuracies [2]. We employed similar dosimetric comparisons where we observed minimal differences, as shown in Table 4. The reason for this discrepancy may be in part because of the differences in treatment planning methods used. In our treatment planning method, the 100% isodose line extends ~5 mm in general, and can be larger for high-risk patients outside of the prostate contour to account for contouring inaccuracies to ensure whole target coverage, as shown in Figure 2. The margin created by extension of the prescription isodose line was adequate to account for the average of under- or over-approximation of the prostate volume, as shown in Figure 4.
Fig. 4
TRUS image with red (TRUS) prostate gland contour and purple (fusion) prostate gland contour. Green dots are the locations of the planned seed locations. Orange line represents 150% Rx isodose, green represents 100% Rx isodose line, and yellow represents 90% Rx isodose line
The main differences between TRUS- and MRI-based contours were found to be primarily at the apex and the base of the gland, as seen in Figures 1 and 5. This agrees with the previous study mentioned [2]. The reason for this may be due in part to the inability to clearly locate the transition zone of the prostate gland in the TRUS image set, which is more readily available due to the enhanced soft tissue contrast in the MRI image dataset. Image fusion errors could be another cause for the observed differences. Another reason is the poor resolution of TRUS images (5 mm) in the longitudinal direction compared to MRI (1 mm), which is consistent with our results, where the mean prostate length difference between TRUS and MRI images was ~3 mm. This also leads to increased uncertainty in image fusion. This effect can be reduced with a smaller slice thickness of TRUS image, but this would also increase contouring time during the procedure. Also, the differences in the height and width of the prostate might have been due to the distortion of prostate due to ultrasound probe. Others have shown the interobserver variability in prostate contouring typically near the apex and base, especially when different specialty physicians were involved [10]. In this study, MRI contours were done by the radiologist. Even though they were reviewed by the radiation oncologist, the interobserver variability would be another cause for the differences. Finally, the difference in timing of the imaging procedures may have caused some of the variations.
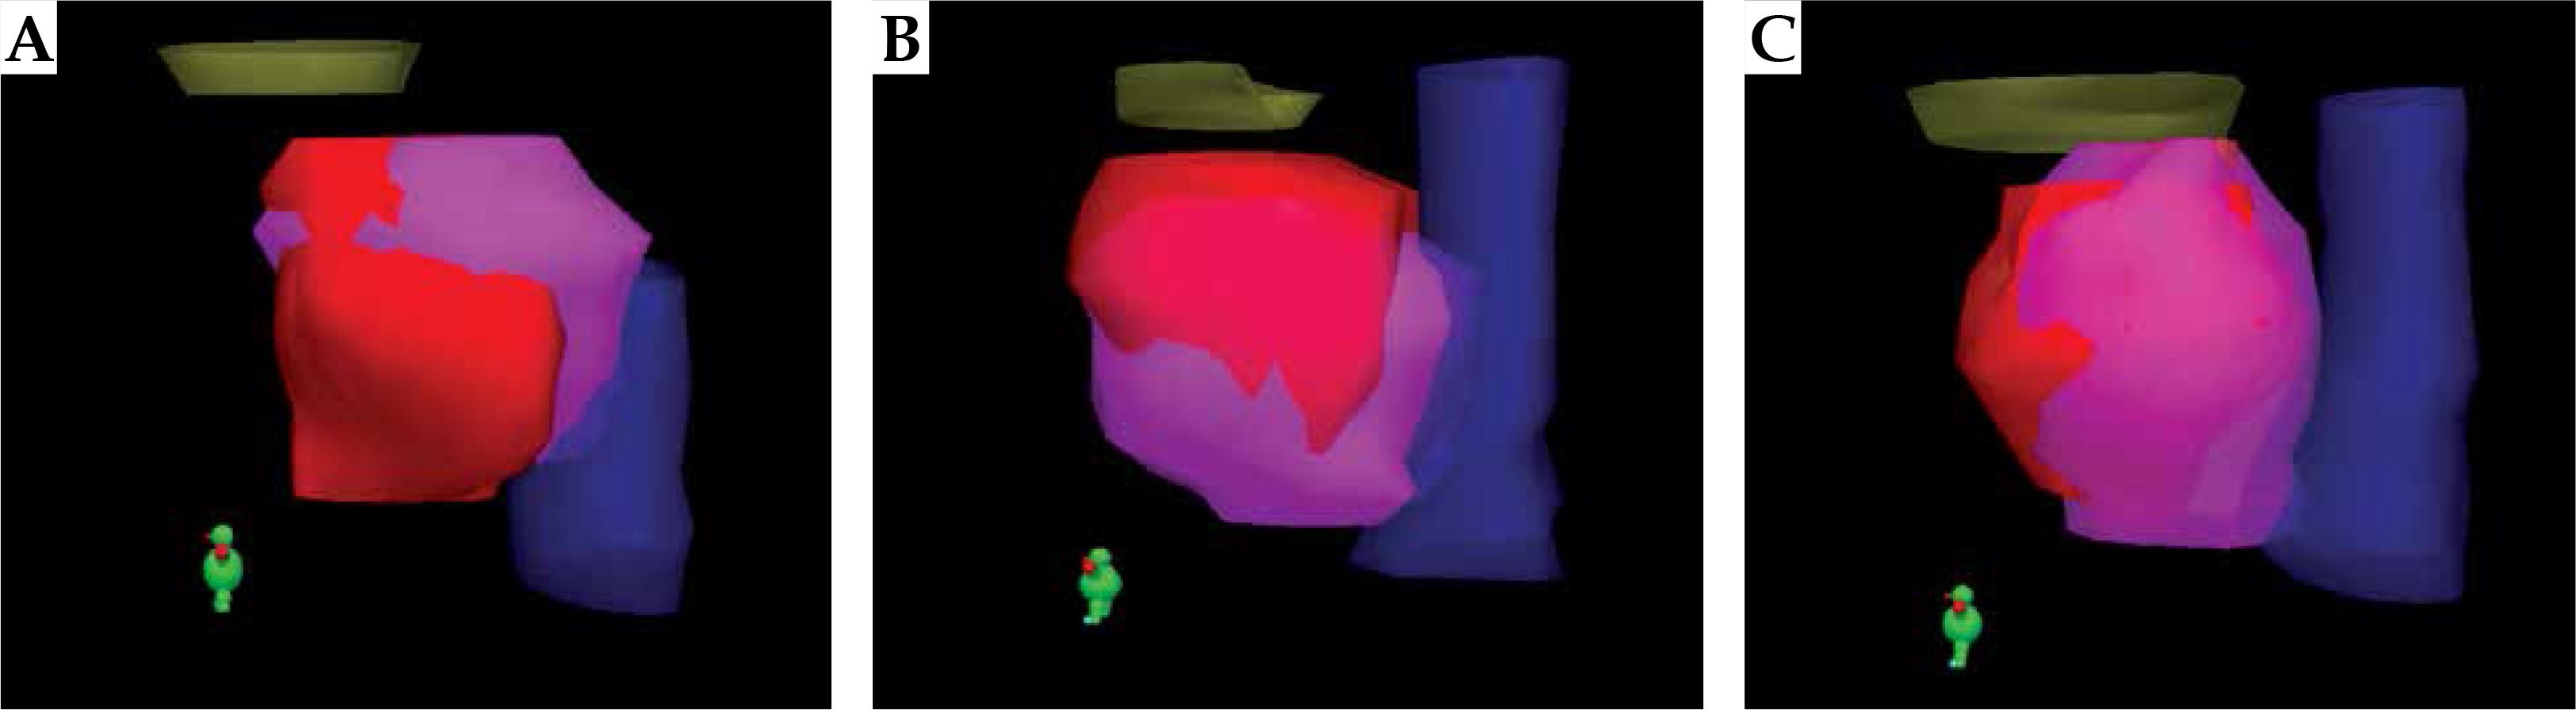
Fig. 5
3 dimensional renditions of the prostate volumes generated during image fusion for various cases. In each case, the purple structure is the prostate gland that has been contoured in MRI and the red structure is the TRUS prostate volume. The yellow structure is the bladder and blue indicate the rectum. Various cases reveal: A) Larger contouring of the apex in TRUS; B) Larger contouring of superior base in TRUS; C) Smaller contouring of the superior base and apex in TRUS
In general, the TRUS-MRI fusion contours were smaller than the TRUS contours (for 9 patients, about same for 4 patients and larger for one patient). With the help of image fusion, the physician was able to use the information in the MRI (specifically the base, bladder neck area, and apex) during contouring of TRUS prostate volume.
The localized tumor volume experienced a small effect in coverage due to the effective coverage of the entire prostate gland, with which the tumor is enclosed. The largest effect seen by original treatment planning on localized tumor volumes is in the V150% parameter. Since there are no tumor dose constraints, we considered the V150% dose escalation parameter as used by King et al. that aimed to give 150% of the prescription dose to 100% of the tumor volume [13]. The dosimetry of LDR prostate brachytherapy is highly heterogeneous and usually a large section of prostate receives 150% of prescription dose. The overlap of these regions with the tumor region is desirable, which is more adequately done by the current treatment planning method for tumors located posteriorly. Despite having a higher V150% than the whole gland using current treatment techniques, posteriorly located tumors still fall short of the 100% mark set by King et al. On the other hand, tumors located in the anterior portion of the gland usually end up in the cooler sections of the gland (receive < 150% of prescription dose) as seen by the large decrease in the V150% (Table 5), which could have been mitigated if this information was available during planning as demonstrated by the re-plans. Figure 3 presents one case with the tumor located anteriorly where no seeds were placed in that area to reduce urethral toxicity. MRI fusion in OR not only would allow the operating team to identify, but possibly escalate the dose to that specific region of the prostate. MRI also could allow for more accurate anatomical location of the urethra for sparing. If treatment planning is tailored to escalate dose to the tumor region, it is imperative that the urethra is defined, as a non-uniformed treatment plan may cause increased dose to the urethra as shown in the re-planned cases and run the further risk of urethral complications. This was evidenced by King et al. who had reported up to 30% greater urethral complications when using escalated dose constraints (> 150% of Rx) to tumor regions that they identified using magnetic resonance spectroscopic image fusion, while maintaining similar post-treatment survival rates of approximately 98% over 5 years [13]. We have explored the possibility of a similar approach using MR imaging rather than MRS imaging with the potential to localize tumor regions and escalate dose to the prostate coupled with more accurate urethral locations.
MRI-TRUS fusion was found to be a clinical process that can be easily implemented in our current workflow. The time needed for the fusion to be completed was typically less than 10 minutes, meaning that the fusion itself does not add significantly to the implantation procedure time [14]. The MRI-TRUS image fusion can be completed intraoperatively by the physicist and approved by the attending physician prior to contouring. The MRI-TRUS image fusion has the potential to add valuable information to the procedure such as any previously delineated targets on the MRI image set like that of a localized tumor region or the urethra, which could not be discovered using TRUS alone. It stands that the additional information and soft tissue contrast can be of a great benefit to patients where it is difficult to identify the junction between the bladder neck and the prostate as well as those patients where the apex of the gland is difficult to find. Within the fusion process, a difficulty is presented by the TRUS probe itself, as it causes a distortion on the rectum/ prostate border, which is not present on the MRI image set, and may be a subtle source of difference between delineated prostate volumes in both image sets, respectively. The results provided show that this distortion may not be an issue for clinical application, as the differences caused on the rectum/prostate border are small enough that local anatomical points may still be accurately and reliably determined at other points of the gland. Some of the aforementioned issues may be mitigated by using deformable image registration but currently, no commercial treatment planning software is available that would support intraoperative deformable MRI-TRUS fusion [15,16]. Therefore, we tested feasibility of rigid MRI-TRUS image fusion intraoperatively, a feature that recently became available in the LDR brachytherapy treatment planning software.
Conclusions
It can be concluded that the use of MRI-TRUS image fusion is a feasible and efficient tool for the visualization of the prostate gland, particularly at the apex and base of the gland, which are particularly difficult to distinguish using TRUS alone. While this visualization is helpful, it may not be imperative, as general dosimetric constraints do not suffer if sufficient margins given without the use of MRI-based prostate contours. MRI-TRUS image fusion may be significantly more beneficial in the identification of localized tumors and the ability to alter treatment plans to increase dose to tumor regions within the gland, specifically in the anterior portion of the gland. It would be necessary to perform an outcomes study of treatment planning using MRI-TRUS-based dose escalation in order to determine the effectiveness of dose escalation and any complications, particularly urethral, that may come as a result.


