
INTRODUCTION
Football technical indicators reflect a team’s athletic performance and influence the outcome of a match, and therefore receive a great deal of attention from practitioners [1–3]. The FIFA World Cup, as the highest-level soccer tournament at the international level for national teams, has received particular attention from researchers for its influence and competitive nature [1, 4–9].
For example, Castellano et al. [5] combined the 2002, 2006, and 2010 World Cups and found that the number of shots, shots on goal, and possession were the most influential factors in the game, consistent with the results of subsequent analyses of 2014 and 2018 [1, 4]. Liu et al. [1] found in 2014 World Cup that possession and short passing increased winning possibilities by 11% and 24%, respectively, while crosses and dribbles decreased the probability of winning by 29% and 12%, respectively. Yi et al. [10] found accordingly a higher probability of winning for teams with a possession style in the 2018 World Cup. An analysis of possession by high level teams at the 2010–2018 World Cup found that possession in one’s own defensive zone increases the likelihood of goals through multiple passes in short periods of time [9].
However, there is some dispute in the research about the simple use of higher or lower possession. In some tournaments, superior possession does not lead to higher win rates [11], and distinguishing the main areas when in possession is more critical [12]. In addition, recent studies found that crosses have a positive impact on the analysed in this outcome of matches [13, 14], contrary to previous findings [1, 15]. More precisely, the 2018 World Cup data show a higher probability of scoring from out-swinging crosses and the losing teams prefer to take middle crosses and late crosses [16]. Moreover, 69.9% of goals were scored from short passes, 13.6% from long passes and 16.5% from mixed passes [17].
To sum up, the notational analysis of the World Cup has produced some results, but the indicators are relatively conventional. Conclusions such as more shots on target help teams win are difficult for teams to apply in practice. There is a need to find more nuanced technical indicators that can help teams improve their performance.
Based on this, FIFA has launched Enhanced Football Intelligence (EFI) to provide a more intelligent and refined reference for match analysis. In the 2022 World Cup, FIFA assembled a data analysis team and started to use this indicator for relevant statistics. Each game will have its unique analytical data during and after the live broadcast. As new data to be used from 2022, the EFI has different characteristics from the previous data. For example, defensive height can distinguish a team’s defensive starting position; possession in contest adds an insightful third dimension to possession statistics, which cannot be clearly calculated at the moment of scramble in previous data. EFI has several times more data points in the competition than previous data counting methods. The factual data in the match can be processed in 2 seconds with its high-speed algorithm and fed back to the officials quickly. It can provide both factual data during the match and during the post-match evaluation. If EFI data are combined with video and other metrics such as running patterns, it will provide practitioners with a clearer understanding of the game. In fact, EFI is already being used in the Women’s U20 World Cup in August 2022, providing a powerful aid for match analysts.
Considering that EFI has just been used in the competition, it is necessary to study its effectiveness in analysing the match. Therefore, the aim of this study is to compare the differences in technical indicators between the results of different matches and the relationship between EFI and attempts on target.
MATERIALS AND METHODS
Sample and variable
The data are taken from the official FIFA website (https://www.fifa.com/fifaplus/en/tournaments/mens/worldcup/qatar2022), which is freely available. Another four success rate figures (line breaks, defensive line breaks, passes and crosses) were calculated from FIFA data for analysis. During matches in the knockout rounds more goals were scored than during matches group stage (3.1 vs 2.5 goals). Since almost one third of the knockout games went into extra time, and the data provided by FIFA are inclusive of extra time data and not for the 90 minutes separate, only matches in the group stage (48 games, 96 cases (38 won, 20 drew, 38 lost)) were selected as the object of study. The definition of the EFI data is provided on the official FIFA website (https://www.fifatrainingcentre.com/en/fwc2022/efi-metrics/efi-metrics-pdfs.php) and Table 1 shows the variables analysed in this paper. Since this study is an observational study without any intervention on the subjects, no ethical proof is required.
TABLE 1
Selected technical match variables.
Statistical analysis
Data were processed using SPSS 26.0 (IBM, Armonk, NY, USA), and data were expressed as mean ± standard deviation. Normality was checked by Kolmogorov-Smirnov tests. To compare the difference between win, draw and loss figures, one-way ANOVA was used for normal data, the Levene test was used for the homogeneity-of-variance test, the least significant difference (LSD) test was used for post-hoc tests when the variance was homoscedastic, and Tamhane’s T2 test was used when the variance was not homoscedastic. The chi-square test was used to determine the difference between teams with different possession rates, passing success rates, and line breaking success rate. K-sample independent tests were used for non-normal data. A non-parametric correlation test was performed using Spearman correlation. The criteria for correlation are as follows: r = 0.1–0.29 = small, 0.3–0.49 = medium, 0.5–0.69 = large, 0.7–0.89 = very large, 0.9–0.99 = almost perfect, and 1 = perfect [18]. The significance level was defined as p < 0.05.
RESULTS
In the group stage, there was a total of 120 goals, of which 36% were scored in the first half. Among all the indexes provided by FIFA, only goals, goals conceded, goals inside the penalty area, goals outside the penalty area, assists and attempts on target were significantly different between winning, drawing and losing teams (p < 0.05). Winning teams had significantly more goals, goals inside the penalty area, assists, and attempts on target than drawing and losing teams (p < 0.05). Winning teams scored significantly more goals outside the penalty area, had more attempts inside the penalty area, more receptions behind the defensive line, completed more defensive line breaks, had a higher success rate of defensive line breaks, and more forced turnovers than losing teams (p < 0.05). Drawing teams had significant fewer yellow cards than losing teams (p < 0.05). No significant difference was found in other data (Tables 2 and 3).
TABLE 2
FIFA EFI metrics for winning, drawing and losing teams (mean ± SD)
| Index | Win | Draw | Lose | F | K | p |
|---|---|---|---|---|---|---|
| Goal | 2.2 ± 1.4*^ | 0.6 ± 0.9 | 0.6 ± 0.8 | 40.767 | 0.000# | |
| Conceded | 0.6 ± 0.8* | 0.6 ± 0.9& | 2.2 ± 1.4 | 40.767 | 0.000# | |
| Goal Inside the Penalty Area | 2.0 ± 1.4*^ | 0.5 ± 0.8 | 0.5 ± 0.7 | 36.953 | 0.000# | |
| Goal Outside the Penalty Area | 0.2 ± 0.4* | 0.1 ± 0.3 | 0.0 ± 0.2 | 7.762 | 0.021# | |
| Assists | 1.6 ± 1.3*^ | 0.5 ± 1.0 | 0.4 ± 0.4 | 31.326 | 0.000# | |
| Attempts | 12.2 ± 6.6 | 9.6 ± 3.5 | 10.3 ± 5.7 | 2.075 | 0.354 | |
| Attempts On Target | 5.0 ± 2.9*^ | 2.1 ± 2.1 | 3.1 ± 2.1 | 10.781 | 0.005# | |
| Attempts Off Target | 4.8 ± 3.1 | 4.4 ± 2.1 | 5.0 ± 2.9 | 0.310 | 0.856 | |
| Attempts Inside the Penalty Area | 7.8 ± 4.7* | 6.2 ± 3.1 | 5.9 ± 4.2 | 4.548 | 0.103 | |
| Attempts Outside the Penalty Area | 4.4 ± 3.6 | 3.4 ± 1.3 | 4.5 ± 2.7 | 2.194 | 0.334 | |
| Final Third Entries | ||||||
| Left Channel | 13.5 ± 7.8 | 12.3 ± 5.3 | 13.4 ± 7.0 | 0.037 | 0.982 | |
| Left Inside Channel | 4.7 ± 3.2 | 3.7 ± 2.2 | 4.8 ± 2.8 | 2.006 | 0.367 | |
| Central Channel | 5.0 ± 3.1 | 4.7 ± 3.3 | 4.5 ± 2.6 | 0.375 | 0.829 | |
| Right Inside Channel | 5.0 ± 3.5 | 3.8 ± 1.6 | 4.3 ± 2.4 | 0.908 | 0.635 | |
| Right Channel | 12.2 ± 5.3 | 11.4 ± 5.4 | 11.4 ± 6.8 | 0.224 | 0.800 | |
| Offers to Receive | 568.5 ± 204.2 | 554.9 ± 105.1 | 553.5 ± 177.7 | 0.078 | 0.925 | |
| Offers to Receive In Behind | 126.9 ± 40.7 | 116.0 ± 23.2 | 121.5 ± 39.5 | 0.579 | 0.562 | |
| Offers to Receive In Between | 218.1 ± 76.2 | 225.6 ± 63.1 | 213.5 ± 59.7 | 0.210 | 0.811 | |
| Offers to Receive In Front | 223.6 ± 103.7 | 213.3 ± 51.6 | 218.5 ± 109.6 | 0.132 | 0.936 | |
| Receptions Between Midfield and Defensive Lines | 99.0 ± 30.8 | 92.5 ± 20.5 | 94.1 ± 29.1 | 0.451 | 0.638 | |
| Receptions Behind the Defensive Line | 12.6 ± 7.0* | 10.1 ± 4.8 | 9.4 ± 6.1 | 5.560 | 0.062 | |
| Attempted Line Breaks | 167.2 ± 32.6 | 172.5 ± 20.5 | 164.6 ± 34.9 | 0.404 | 0.669 | |
| Completed Line Breaks | 111.9 ± 34.6 | 109.4 ± 26.4 | 104.3 ± 32.1 | 0.514 | 0.773 | |
| Attempted Defensive Line Breaks | 18.9 ± 7.0 | 19.1 ± 5.5 | 16.9 ± 7.0 | 1.109 | 0.334 | |
| Completed Defensive Line Breaks | 10.8 ± 5.6* | 9.7 ± 4.6 | 8.6 ± 6.0 | 4.585 | 0.101 | |
| Yellow Cards | 1.6 ± 1.5 | 1.3 ± 1.1& | 2.1 ± 1.6 | 4.344 | 0.114 | |
| Red Cards | 0.1 ± 0.2 | 0 | 0 | |||
| Fouls Against | 11.8 ± 3.7 | 11.6 ± 3.1 | 12.6 ± 5.0 | 0.550 | 0.579 | |
| Offsides | 1.8 ± 1.4 | 1.5 ± 1.6 | 2.2 ± 2.1 | 1.688 | 0.430 | |
| Passes | 484.8 ± 192.7 | 485.5 ± 104.9 | 484.4 ± 159.0 | 0.467 | 0.792 | |
| Passes Completed | 419.8 ± 192.3 | 411.8 ± 108.4 | 411.0 ± 159.1 | 0.225 | 0.893 | |
| Crosses | 18.1 ± 7.9 | 18.3 ± 7.2 | 18.2 ± 8.3 | 0.014 | 0.993 | |
| Crosses Completed | 4.7 ± 3.3 | 3.9 ± 2.6 | 4.5 ± 3.0 | 1.089 | 0.580 | |
| Switches of Play Completed | 6.3 ± 3.3 | 6.5 ± 4.2 | 5.9 ± 4.0 | 0.635 | 0.728 | |
| Corners | 4.9 ± 3.1 | 4.6 ± 2.5 | 4.1 ± 3.0 | 2.047 | 0.359 | |
| Free Kicks | 14.1 ± 5.1 | 13.0 ± 3.2 | 13.1 ± 4.7 | 1.411 | 0.494 | |
| Penalties Scored | 0.1 ± 0.3 | 0.1 ± 0.2 | 0.1 ± 0.3 | 1.176 | 0.555 | |
| Goal Preventions | 10.6 ± 5.8 | 9.9 ± 3.7 | 12.5 ± 6.6 | 1.890 | 0.389 | |
| Own Goal | 0.1 ± 0.2 | 0 | 0 | |||
| Forced Turnovers | 72.3 ± 11.1 | 71.0 ± 13.6 | 65.9 ± 13.5 | 4.087 | 0.130 | |
| Defensive Pressures Applied | 288.1 ± 92.4 | 280.7 ± 55.5 | 282.2 ± 87.7 | 0.069 | 0.933 | |
TABLE 3
Chi-square test of different match results
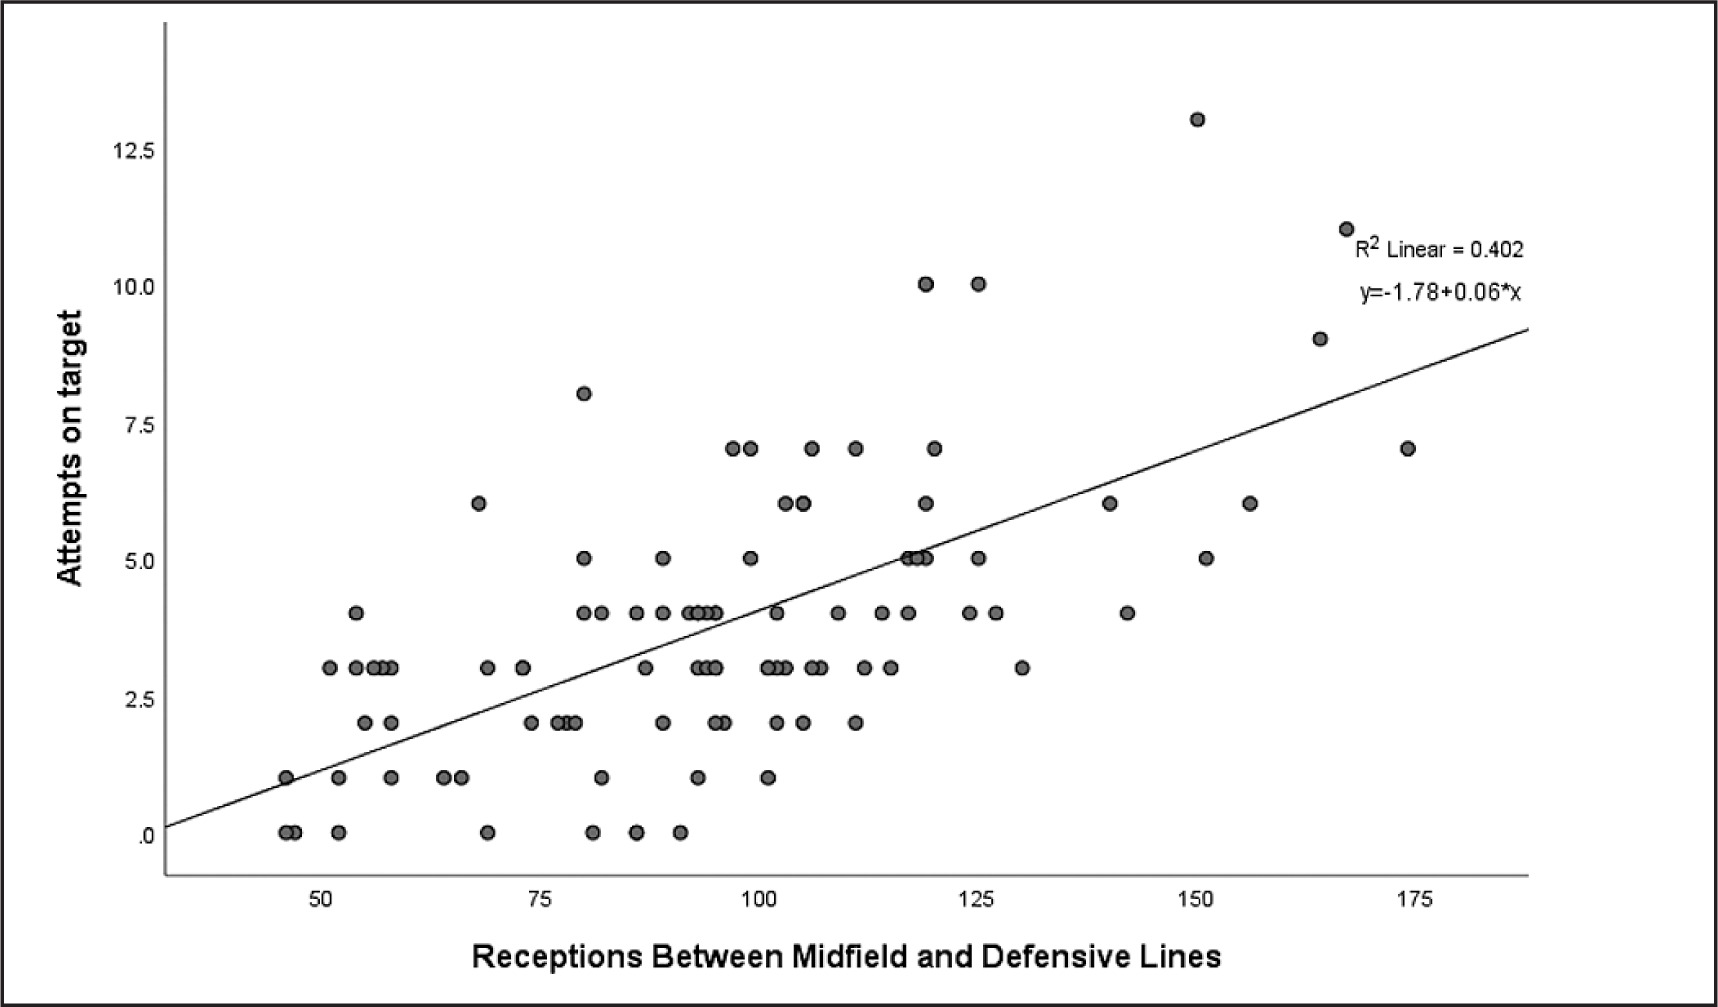
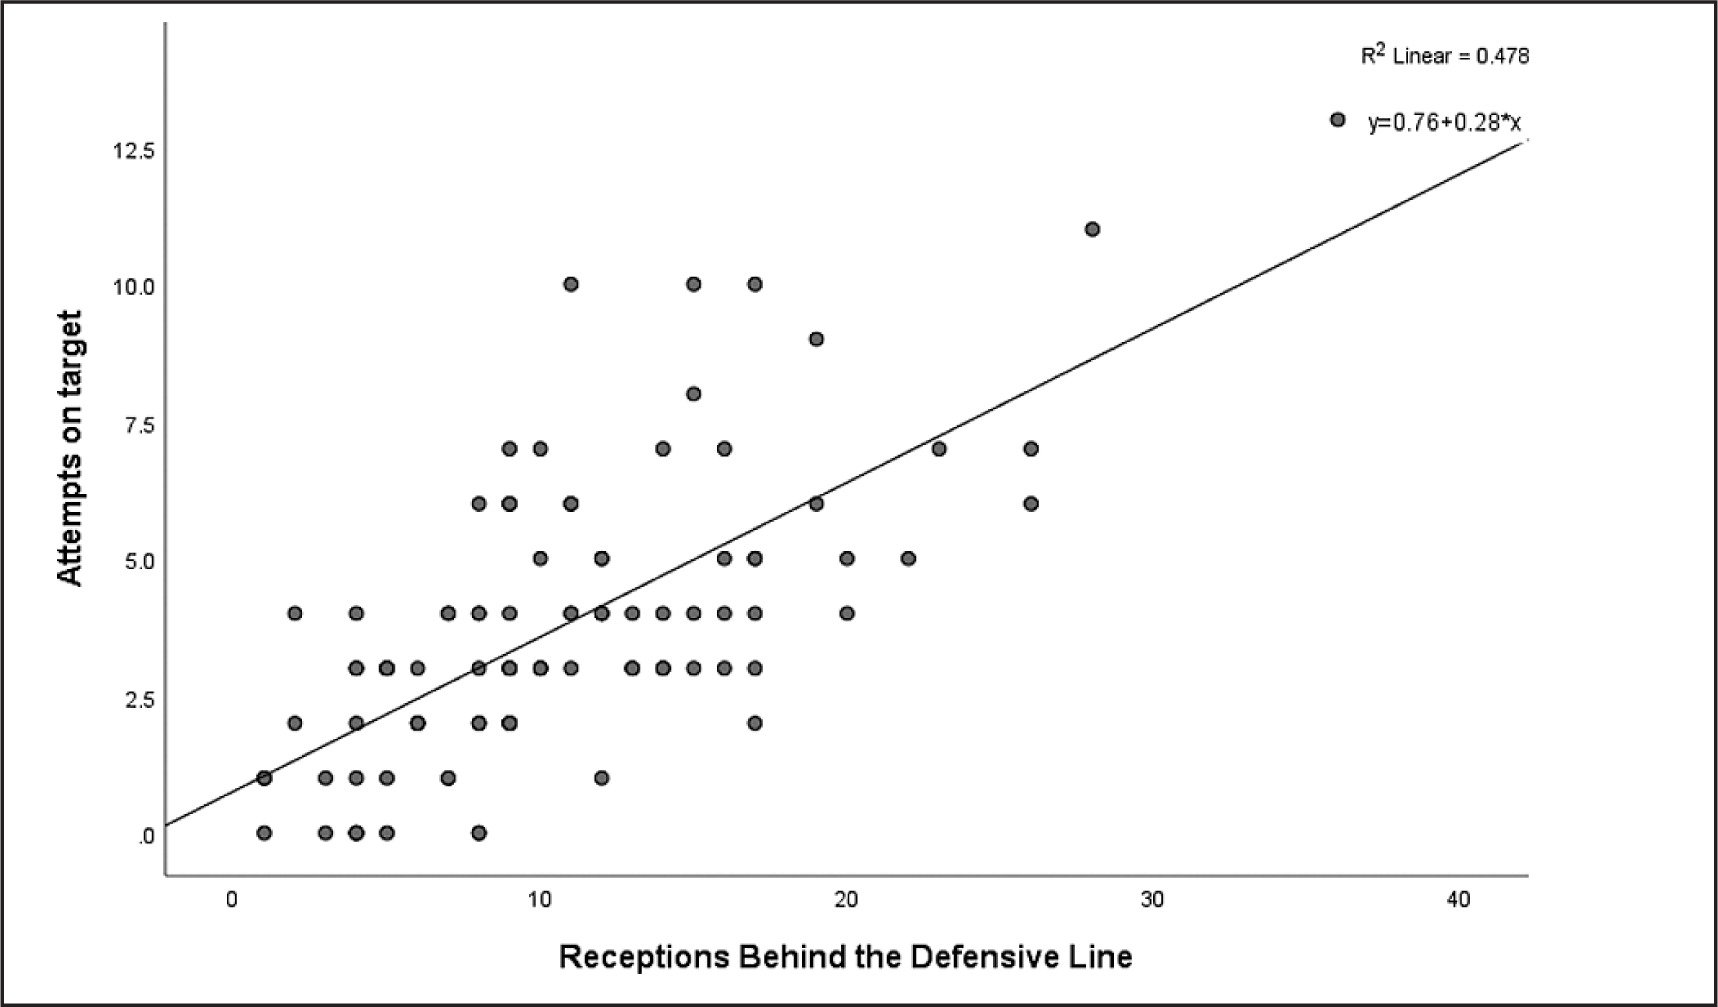
The number of goals was correlated with completed defensive line breaks and receptions behind the defensive line (p < 0.01) with no other EFI data correlated with number of goals (Table 4). Attempts on target were significantly positively correlated with attempted line breaks, completed line breaks, attempted defensive line breaks, completed defensive line breaks, receptions between midfield and defensive lines, receptions behind the defensive line and all the area of final third entries (r = 0.31–0.67, p < 0.01), and negatively correlate with defensive pressures applied (r = -0.35, p < 0.01) (Table 4). A two-factor linear regression model was constructed on the attempts on target and receiver data, as these indicators are particularly important for technical and tactical purposes and have the highest correlation coefficient (Figures 1 and 2). The R2 for the attempts on target was 0.40 for receptions between midfield and defensive lines and 0.48 for receptions behind the defensive line.
TABLE 4
Correlation Between EFI Indicator and Goals/Attempts On Target
| Line Breaks | Receptions | Final Third Entries | FT | DPA | |||||||||
|---|---|---|---|---|---|---|---|---|---|---|---|---|---|
| ALB | CLB | ADLB | CDLB | BMDL | BDL | LC | LIC | CC | RIC | RC | |||
| Goals | 0.037 | 0.104 | 0.137 | 0.265** | 0.191 | 0.298** | -0.041 | 0.097 | 0.064 | 0.083 | 0.021 | 0.161 | -0.054 |
| AOT | 0.417** | 0.486** | 0.480** | 0.605** | 0.621** | 0.667** | 0.373** | 0.466** | 0.395** | 0.335** | 0.308** | -0.036 | -0.347** |
** represents P < 0.01. AOT = Attempts On Target, ALB = Attempted Line Breaks, CLB = Completed Line Breaks, ADLB = Attempted Defensive Line Breaks, CDLB = Completed Defensive Line Breaks, BMDL = Between Midfield and Defensive Lines, BDL = Behind the Defensive Line, LC = Left Channel, LIC = Left Inside Channel, CC = Central Channel, RIC = Right Inside Channel, RC = Right Channel, FT = Forced Turnovers, DPA = Defensive Pressures Applied.
DISCUSSION
This study is the first to examine the validity of EFI for analysing matches, and this study compares the differences in technical indicators for different match outcomes at the 2022 World Cup group stage.
We found that most goals and attempts related indicators can distinguish the outcome of a match, in line with previous studies [1, 5, 6]. However, there is no difference in the total number of attempts between winning, drawing and losing, in contrast to previous studies in both the male and female FIFA World Cup [1, 5, 19]. This suggests that the efficiency of attempts was even more important in determining the outcome of the game. Also, no significant difference (p > 0.05) in the number of corners and free kicks was found between winning, drawing and losing, in contrast to the study of the LaLiga [20] and
Women’s World Cup [19]. This may be due to increasing prevalence of intensive defending making set pieces become more and more crucial, and successful teams are more efficient at scoring from set pieces than their less successful opponents [21]. In addition, drawing teams but not winning teams had significantly fewer yellow cards compared to losing teams, which is partially different from previous studies [6, 22]. The main reason may be that most of the draws in the 2022 World Cup occurred in the last match of the group. With the group’s advancing form clear, both sides deliberately adopted a low-aggressive strategy to prevent players from being injured and banned from the next stage, thus resulting in a significant drop in the number of yellow cards. For the possession after the new calculation method based on EFI, no differences were found between the different results of the match (p > 0.05), in contrast to previous studies [4, 5, 10]. The reason for this is, on the one hand, that the possession rates of both sides are closer after the inclusion of the “in contest” moments. On the other hand, it is difficult to convert pos-session into an offensive advantage with the strategy of counterattack being more prevalent due to the increased intensity of the game and the density of player coverage [23]. For intensive and high density defence, it will not only put high pressure on the possession team but also increase the success rate of counterattack of the opponents [24]. Thus, many teams will voluntarily give up possession, especially against strong teams [25]. The number of passes and success rate of passes are considered to be among the most important signs of ball control [7, 26], but the indicator was not found to be associated with differences between the results of different matches, further supporting the conclusion that possession plays a limited role.
In addition, we found that receptions behind the defensive line and completed defensive line breaks made a difference between winning and losing teams (p < 0.05). Higher rates of these mean that the team has more chances to get into the penalty area and attempts, and therefore will have more chances to score and win the game. Although other EFI data did not account for differences in results across matches, this does not mean that other EFI data are not meaningful, as match performance and results are also influenced by other factors such as opponents and judgements of referees [27–29]. We found that almost all post-match EFI indicators are correlated with attempts on target (p < 0.01), except for forced turnovers. However, the difference between forced turnovers in winning and losing teams approached the significance level (p = 0.05), consistent with the findings in LaLiga teams [20]. The reasons for this are manifold; marker, location, individual errors, pressure, conditioning [30], etc. all affect the forced turnover result of teams, especially in a knock-out tournament like the World Cup where matches are played at short intervals. Moreover, as the Qatar World Cup is held in December, the league became more congested before the World Cup 2022 than previous World Cups, which increased the physical burden of the players [31, 32]. Therefore, fewer teams may be adopting an aggressive high-pressure strategy, leading to forced turnovers in the group stage being not too decisive.
Finally, line break, reception in the key area and final third entry all have a medium to large positive correlation with attempts on target, indicating that performing these actions as much as possible will help the team get more attempts on target to a greater extent. Studies of high-level players have shown that penetrating performances and exploiting gaps in the defensive line can increase a team’s chances of scoring goals [33, 34], supporting our results. In fact, the results show that receptions between midfield and defensive lines and behind the defensive line explain 40% and 47% of the variance in shots on target, respectively. A relatively high figure considering that there are other events after the reception that can affect the likelihood of a shot. Additionally, more entries into final third area mean that the team has more chances to threaten the goal and therefore correlates moderately with the number of attempts on target. This may also be the reason why the percentage of possession in this area was found to be more critical compared to total possession [12].
In general, this study provides evidence for practitioners to improve their match performance. Possession does not determine the outcome of a game, and teams need to be efficient in attack and give up possession appropriately. At the same time, the efficiency of the shot is more important than the number of shots. This study also indicates that the coach needs to improve the tactics of players in the game, opting to receive the ball between the lines whenever possible, to enhance the team’s shooting opportunities. Meanwhile, this study also provides ideas for athlete development, i.e., developing more awareness and ability to catch the ball at the line of defence in training.
One of the limitations of this study is that it did not incorporate physical fitness data. However, technical indicators are more likely to predict a team’s success than physical indicators [35, 36], and thus this study can still provide an important reference for practitioners. The inability to compare the group stage with the knockout stage is another limitation of this study. Future research can integrate technical indicators with physical and other contextual information such as opponent level, weather, and altitude. It is also possible to use video analysis to find out which technical indicators at specific moments of the game can help the team gain a greater advantage. This will provide more detailed guidance on team tactical options.
CONCLUSIONS
There were significant differences in goal-related variables between match outcomes. In addition, the winning team had more defensive line breaks and receptions at the group stage of the 2022 World Cup. Receptions, final third entries and line breaks have a medium to high correlation with attempts on target and can provide important information for practitioners. Coaches need to identify the key indicators that affect the outcome of a match, rather than focusing on indicators such as possession that do not give a clear advantage. To conclude, the EFI provides a new reference for match analysis, which practitioners can use to better improve their team’s match performance.


