
Purpose
AccuBoost® (Advanced Radiation Therapy, LLC, Tewksbury, MA, USA) is a complex non-invasive breast treatment using high-dose-rate (HDR) brachytherapy [1,2]. AccuBoost treatments are applied following lumpectomy to deliver radiotherapy to the tumor bed. The treatments are either performed as a boost to the tumor bed in conjunction with external-beam radiotherapy (EBRT) or as accelerated partial breast irradiation (APBI) monotherapy [3,4].
AccuBoost involves a set of specially designed applicators that are connected to an HDR 192Ir remote afterloader. The applicators are designed to either be skin dose optimized (SDO) or dose rate optimized (DRO) [5]. The applicators also come in different shapes, round and D-shaped, and multiple sizes to treat different shapes and positions of lumpectomy cavities. The applicators are attached to a mammography unit with an added 2D planar indexing grid to position the applicators.
The pre-treatment process begins with the breast being immobilized between the compression paddles with moderate compression, so a mammographic image can be taken [6]. This image is used to localize the lumpectomy cavity and surgical clips that were placed in the margins of tumor bed by the surgeon. While the breast is still compressed, the radiation oncologist examines the image and overlays physical transparencies of different applicators to make a visual assessment to choose the applicator type, position, and size. The radiation oncologist makes these selections based on a specific disease, tumor bed position, excised tissue pathology, compressed breast thickness, surgical clips position, and texture in the breast tissue.
The current method of visual assessment itself could contribute to variability in treatment planning between different radiation oncologists. Roles et al. [7] found that the patient’s breast is compressed for an average of 10 minutes prior to treatment initiation with an efficient clinical workflow, which adds to patient discomfort. The visual assessment is a component of pre-treatment time, and takes the physician approximately two minutes for most cases.
The goal of this study was to develop a method to improve the uniformity in determining the applicator center position and size, while reducing the duration of patient compression. To accomplish this, an algorithm was developed in MATLAB™ (version 2019b; The MathWorks, Inc., Natick, MA, USA) to automate the selection of round applicators based on the positions of surgical clips. At the time of this study, no preliminary work has been done attempting a similar method for AccuBoost treatments. This algorithm serves as a preliminary method to suggest applicator parameters quickly and uniformly, which can be used as an independent examination and to identify large discrepancies in the selection process by radiation oncologist.
Material and methods
Patient selection
Ten patients treated with AccuBoost were retrospectively selected from our institutional database (Figure 1, step 1). Patients received either a boost to the tumor bed in 3 to 5 fractions, typically delivered weekly, or were treated with APBI in 5 or 10 fractions over 2 weeks. All 42 fractions analyzed in this study were treated with a round applicator (5, 6, 7, or 8 cm diameter) and were imaged with a standard procedure. All fractions studied were between four to six surgical clips present in the images. Fractions treated with D-shaped applicators or mammographic images with an offset cassette were excluded from this study.
Treatment details, such as breast laterality, compression paddle separation, number of surgical clips, and an attending radiation oncologist were recorded. Three different attending radiation oncologists planned the 42 fractions. At our institution, one radiation oncologist plans a majority of AccuBoost cases and consequently planned 34 out of 42 fractions. The selected applicator size and position (0.5 cm increments) chosen by the radiation oncologist were recorded. All treatment fractions were then analyzed as described in the following sections (Figure 1).
Fig. 1
The six major steps for analyzing each image. Following patient selection in step 1, the image is pre-processed in step 2 to remove any annotations or identifiers; the user is required to initiate step 3 for grid digitization, which is followed by clip detection in step 4. At the end of step 5, the detected clips and the predicted applicator (position and size) are displayed along with the original image. The results from the algorithm are compared in step 6 to the ground truth values, as determined by the attending radiation oncologist
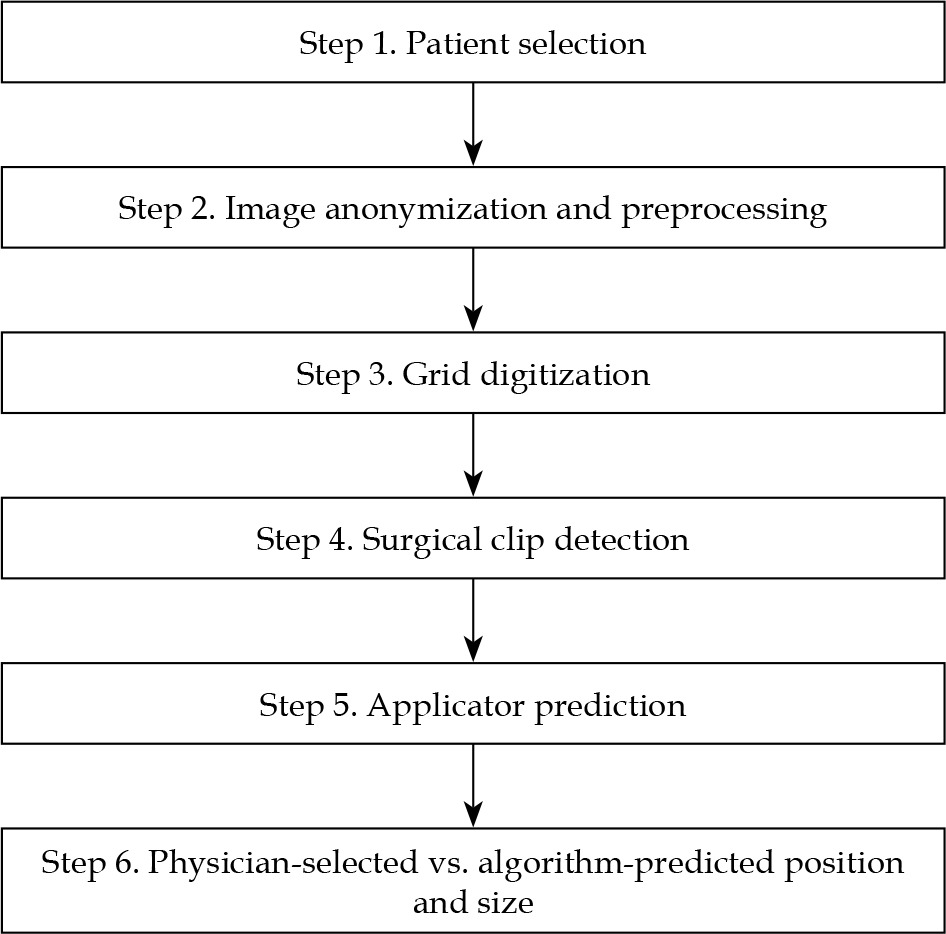
Image acquisition and pre-processing
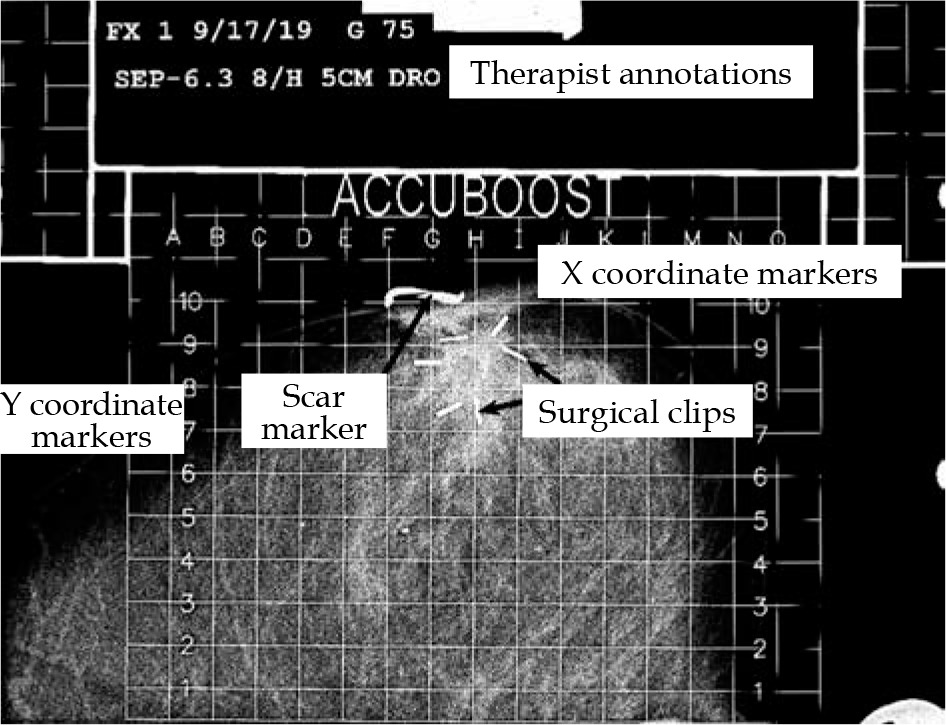
Images used for treatment planning were taken with a GE Senographe 800T mammography unit. The cassette was irradiated and then scanned using a Regius Model 190 computed radiography (CR) reader. Note that some images suffered from slight rotation due to misalignment inside the scanner. The mammographic images were 23.4 cm × 18.8 cm, with a spatial resolution of 145 pixels per cm. The total image size was 18.4 MB, with 16-bit per pixel. Prior to exporting the images from the treatment unit into electronic medical record (MOSAIQ), radiation therapists annotated the top of the image (Figure 2). These annotations were removed using ImageJ (NIH, LOCI, University of Wisconsin, Madison, WI, USA) by masking that region. The ImageJ anonymization plugin was used to remove all patient identifiers (Figure 1, step 2). Images were exported as TIF format after preprocessing was completed.
Fig. 2
A labeled mammographic image exported from the patient database. Annotations by the radiation therapist are shown at the top. The English letters (left to right across the grid top) are used to define positioning in the x direction. The Arabic numerals (along the grid left-hand side) define the positioning in the y direction. Implanted surgical clips indicating the margins of tumor bed and scar markers are also shown
Grid digitization
The mammography unit has a metal imprinted grid on the bottom paddle of the unit. This causes a projection of the grid in each image, which is used by the radiation oncologist for applicator localization. To digitize grid locations (Figure 1, step 3), a blank image of the imprinted grid was acquired following the same procedure for patients’ imaging (Figure 3). Three templates were extracted by cropping a small region around certain markers with known grid position. Templates of A and O position markers (135 × 85 pixels) were utilized in grid digitization, and a template of numerical position markers (835 × 126 pixels) was used to create a mask of the gridlines to allow for clip detection. Figure 3 shows the three templates mentioned above identified on an image of the imprinted grid.
Fig. 3
A blank image of the imprinted grid with the A, O, and numerical templates labelled. A 2D normalized cross- correlation is used to identify the corresponding areas in the treatment images that has the highest correlation with the A, O, and numerical templates
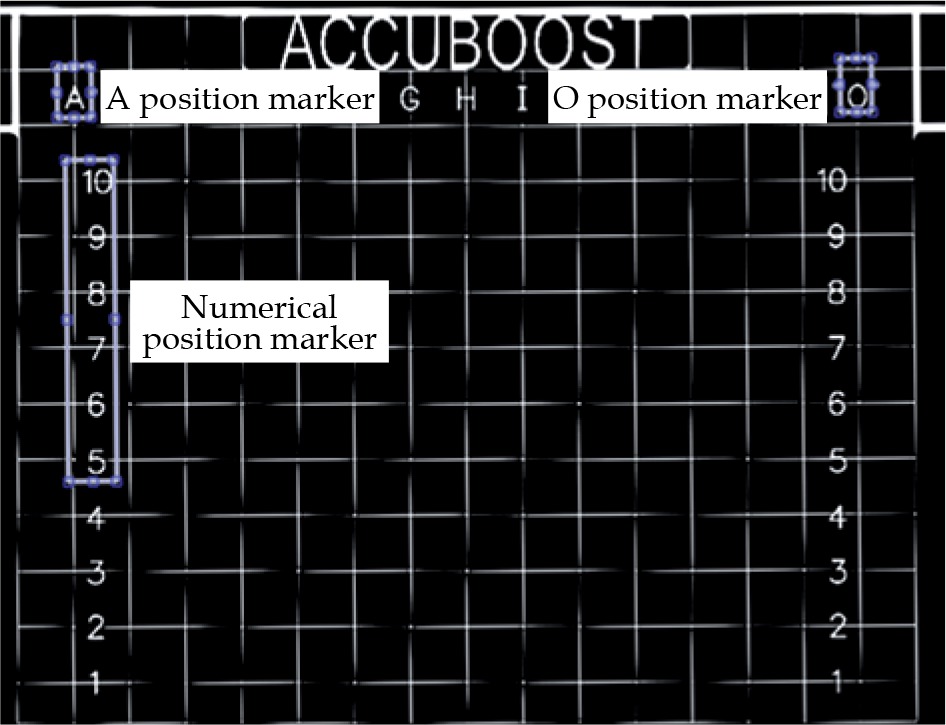
The grid on all other images was digitized in order to localize each pixel position in the image using template matching [8,9]. Using the normalized 2D cross-correlation function, the A and O templates were localized in the image by identifying the region with the highest correlation. The grid points above the A and O position markers were treated as reference points for localizing the rest of the grid. The angle between the reference markers (A and O) was calculated to correct any rotations due to the cassette orientation inside the CR reader.
Surgical clip detection
Using numerical template positions (Figure 1, step 4), a mask was created for the gridlines and non-treatable regions to remove areas where clips would not be found. A threshold (TH) was applied to isolate regions with higher pixel intensity values. An optimal value of TH = 0.935 × (maximum intensity) was determined by the mean intensity value of all clips. This value preserved most pixels corresponding to clips (those removed were recovered from filling) while removing the majority of tissue regions with lower intensities. The resulting image included clips, scar markers, high-density tissues, remnants of grid/grid markers, and a few other high-intensity objects (Figure 4B).
Fig. 4
A) The patient image after all pre-processing from step 2 is completed; B) The image with gridlines and non-treatable regions removed and with the threshold applied; C) A binary image with small regions of high-density tissues removed based on the features derived from region properties; D) The final image after all morphological operations
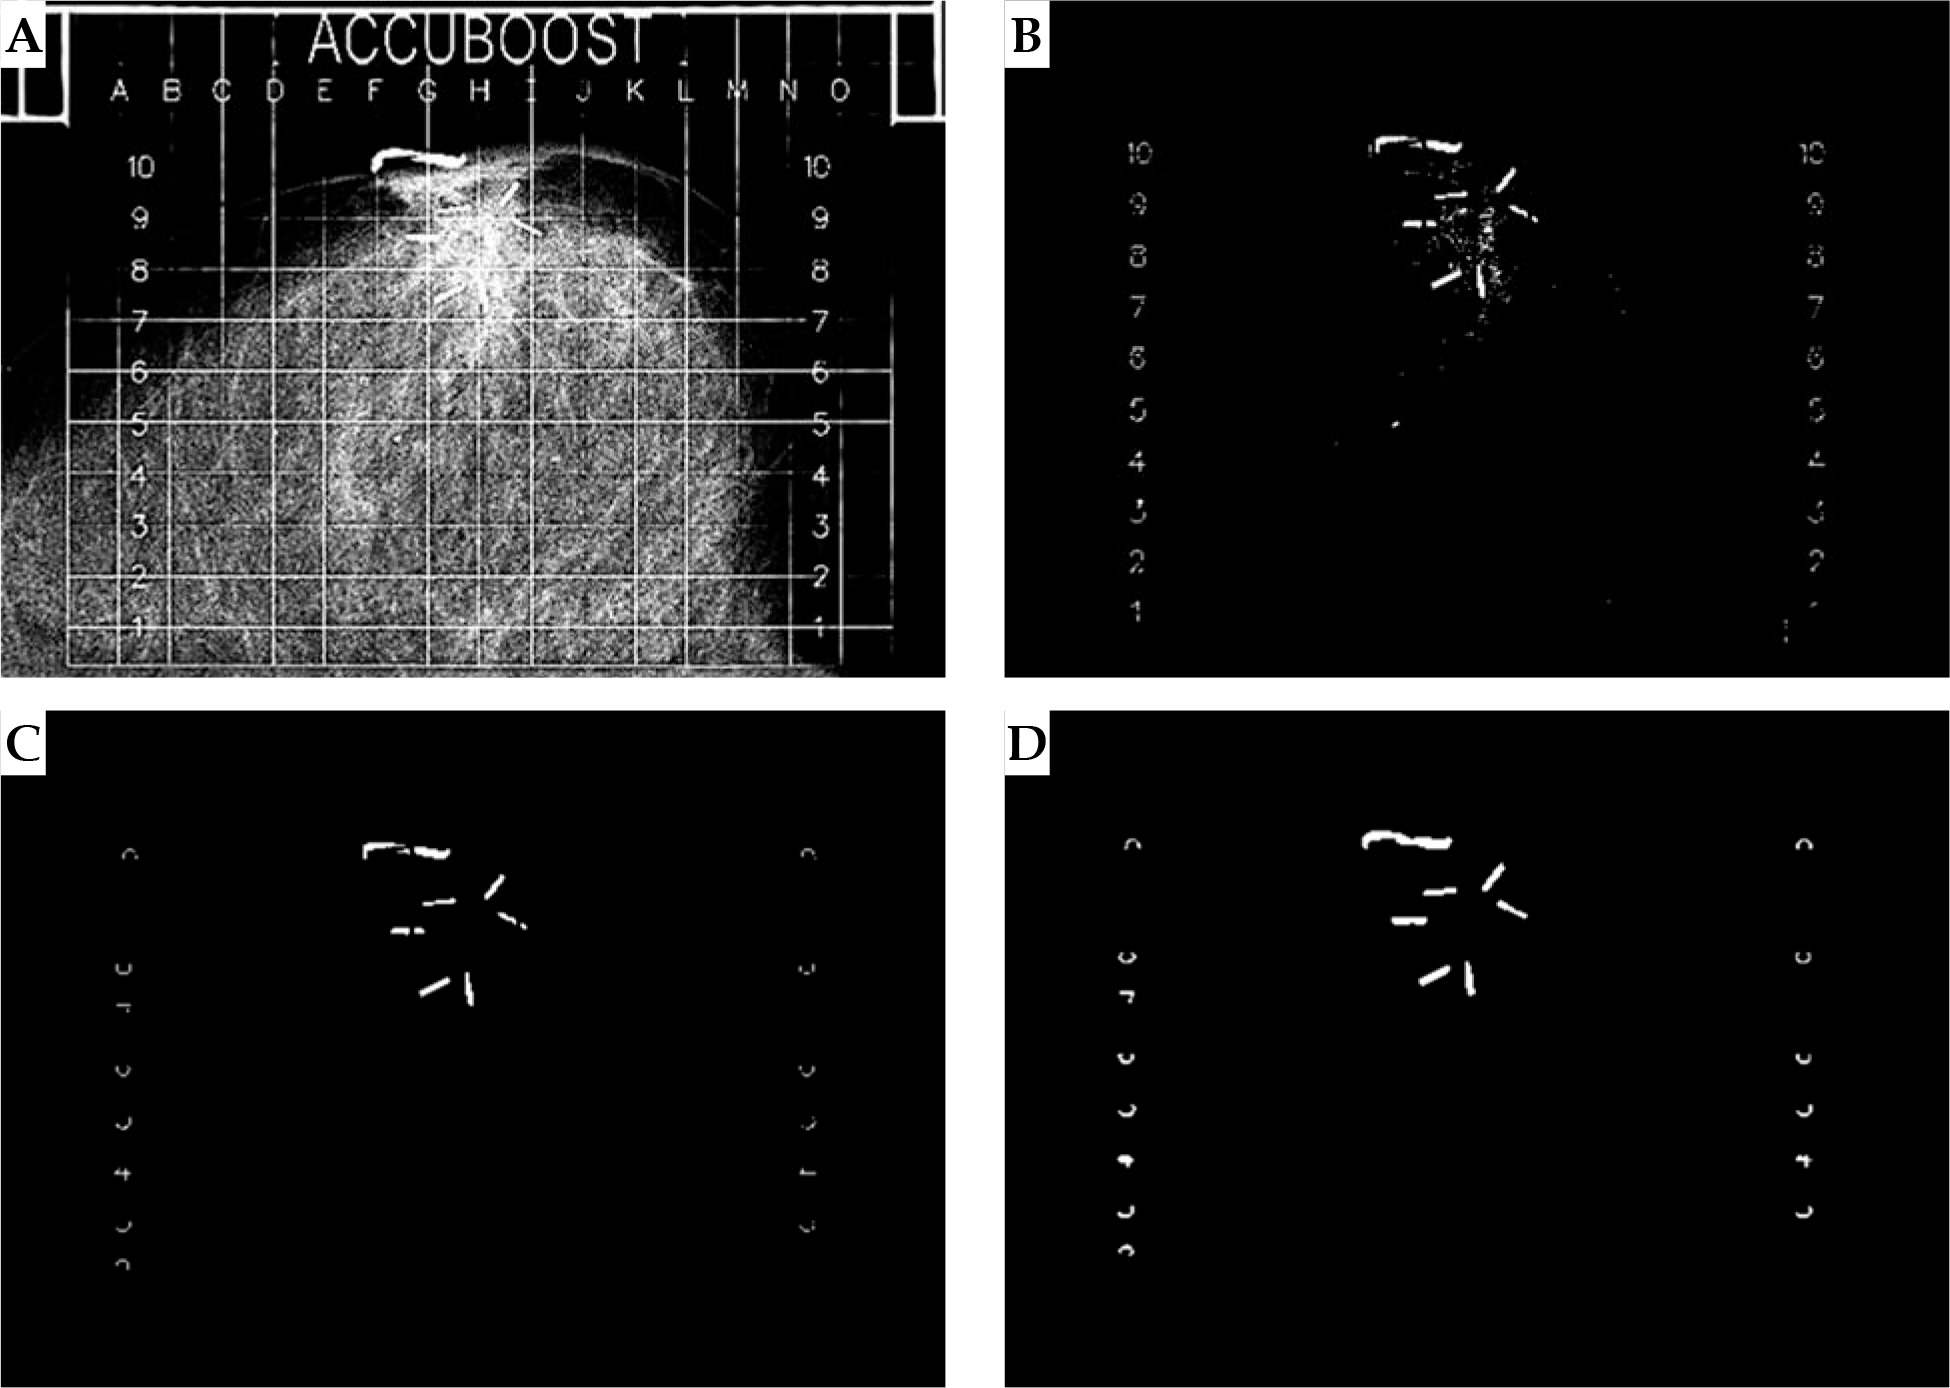
The image was binarized and a region-identification algorithm was utilized [10] to group the pixels into different regions. The region properties function (regionprops) in MATLAB was applied to extract different shape descriptors (area, eccentricity, circularity, and Euler number) of the identified regions. Most fractions would have a large number of small regions (> 200 regions), which corresponded to tissue and would often have irregular shapes with many holes (i.e., area < 300, eccentricity < 0.760, circularity < 0.1, Euler number < –55). These regions were removed to greatly reduce the number of undesired regions (Figure 4C). These features and values were determined to not correspond to clips and reduced ~90% of undesired regions.
A series of morphological operations available under image processing toolbox in MATLAB were applied to dilate [10,11,12], fill, clear border structures (i.e., diagonally connected pixels) [13], and erode [10,11,12] the regions. Each region was dilated using a function (imdilate) with a disk structuring element of a radius of eight pixels (2/3 the width of removed gridlines). This radius allowed for adequate reconnection of objects separated by the masking of gridlines and produced the best results. Pixel filling (imfill) was then utilized to remove any holes that were present in the reconnected objects. Regions that were in proximity to each other could combine and form border structures from the dilation step. To separate regions that combined diagonally, a function (imclearborder) was used with four-pixel connectivity. The objects were then eroded (imerode) twice, utilizing a disk structuring element with a radius of three pixels. Erosion was performed twice with a smaller structuring element, because it produced objects that more accurately represented their original shape than a single erosion with a larger structuring element. An image that has been the subject to all morphological operations is presented in Figure 4D.
Following the application of morphological filters, the region properties function was applied again to extract a total of 18 features (14 shape descriptors and 4 intensity-derived quantities) of each of the remaining regions. These features were iteratively evaluated in a classification learner application in MATLAB using an “all model” train function. This function quickly trains a subset of existing models (~5 secs/iteration) comprised of seven different model types (decision trees, discriminant analysis, logistic regression, naïve bayes classifiers, support vector machines, nearest neighbor classifiers, and ensemble classifiers) on the test set described below solely to evaluate the effect of each feature on predictive accuracy. It was determined that only eight features (area, perimeter, eccentricity, circularity, minor axis length, normalized mean pixel value, normalized minimum pixel value, and normalized standard deviation of pixel values) contributed to the predictive accuracy. The individual regions were then manually labeled as “clip” or “miscellaneous” to create a dataset that was then used to train a model for the automated classification of regions. The entire dataset consisted of 946 regions from 42 fractions, with 191 regions corresponding to 196 surgical clips (5 clips overlapped and were counted as a single region) and the remaining 755 representing miscellaneous regions (scars, high-density tissue, etc.). The dataset was randomly divided into 622 regions (70%) for a training set, and the remaining 284 regions (30%) for a testing set.
The model was trained in the classification learner application. The classification model type was chosen by training the aforementioned model types using a 5-fold cross validation and selecting the type with the highest predictive accuracy. MATLAB calculates predictive accuracy by averaging the test error over all the folds to estimate an error in the final model, which is trained with all training data. A support vector machine (SVM) model [14,15,16,17] was chosen since it demonstrated the highest initial predictive accuracy and had the ability to be optimized further (not the case for all model types) to improve the accuracy. The model was trained on the training dataset over 50 iterations with Bayesian optimizer, along with an expected-improvement-per-second-plus acquisition function. The misclassification cost function used a higher weight to identify the highest number of clips properly rather than correctly identify miscellaneous regions. Surgical clip detection was prioritized as it was used to determine applicator position and size. The number of regions mislabeled as clips was still exceedingly small, and these regions could be manually removed from the calculations. The resulting model used a cubic kernel function, with optimized values for the kernel scale and box constraint level.
Applicator position and size predictions
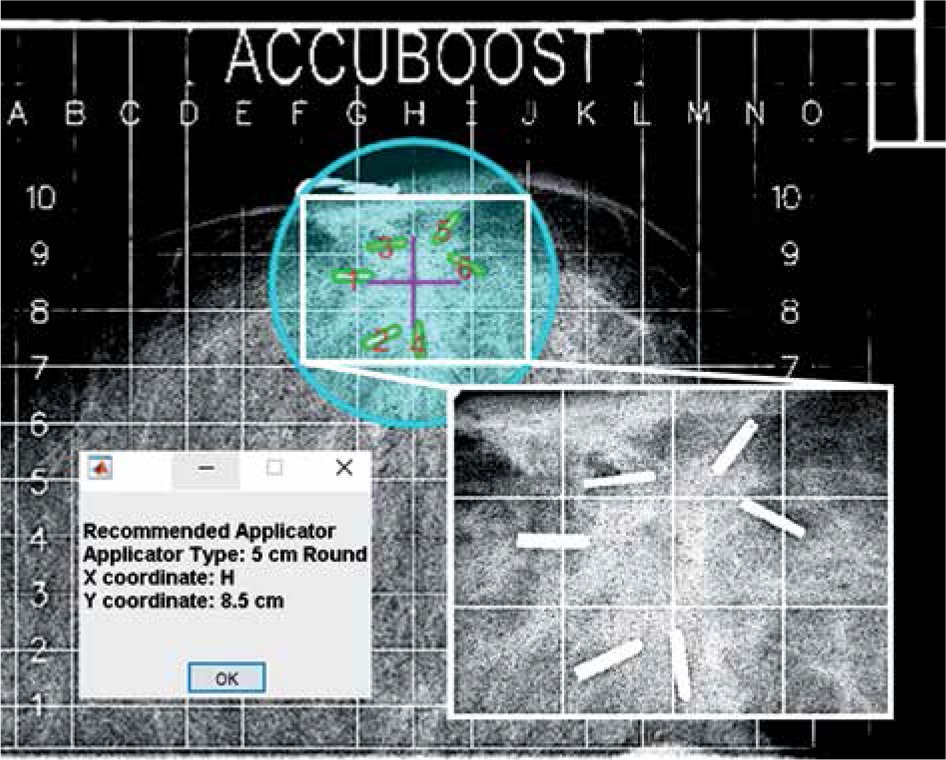
In each image, a center-of-mass in the x (lateral) and y (anterio-posterior) directions of the identified clips was determined. This position was shifted to the nearest 0.5-cm step-size on the grid based on the precision of applicator positioning used clinically at our institution. The coordinates of this position, as previously described by the grid digitization, were saved as the algorithm-predicted applicator center. Applicator size was chosen by calculating planning target volume (PTV) radius, as described by Leonard et al. [18]. The PTV was defined as the tumor bed (delineated by the surgical clips) plus an isotropic 1.0 cm margin. The PTV radius was calculated using the algorithm-predicted applicator center and identified surgical clips. This value was doubled to yield the needed applicator diameter. Rounding up or down by 1 cm, the nearest available applicator size was then determined as the algorithm-predicted applicator size. A user interface was developed to display the original image, with the detected surgical clips outlined and the algorithm-predicted applicator position and size for the user to evaluate (Figure 5).
Fig. 5
The final results of the algorithm overlaid on the original image. Regions identified as clips are outlined in green with red enumeration, the algorithm-predicted center is marked with fuchsia crosshair, and the predicted applicator is displayed as cyan circle. The inset image shows a magnified view of the clips from the raw image. A message box is displayed to indicate the predicted position and size of the applicator
Evaluating the prediction algorithm
Clip detection was evaluated with a test set by calculating the sensitivity and specificity of the SVM model to accurately identify regions as clips. The number of regions correctly classified as clips or true positives (TP), regions incorrectly classified as clips or false positives (FP), regions correctly classified as miscellaneous or true negatives (TN), and incorrectly classified miscellaneous regions or false negatives (FN) were counted. Since some regions corresponded to multiple clips, the percentage of all individual clips identified was found. These values quantified the algorithm’s accuracy. To further assess the algorithm, differences between the algorithm-predicted applicator position and size and those determined by the attending radiation oncologist were also evaluated.
Results
Surgical clip detection
Of the 284 predicted regions in the testing set, 61 were labeled as clips and 223 were labeled as miscellaneous regions (non-clips). The algorithm correctly classified 57 regions as clips (TP = 57, FP = 4) and 221 as non-clips (TN = 221, FN = 2). This resulted in a sensitivity of 96.6% and specificity of 98.2% for regions representing clips as correctly detected. In a few cases, multiple surgical clips overlapped and were identified as a single clip due to their proximity, or a single clip was split into two or more regions due to masking perturbations.
From all the true clip regions in both the training (132) and testing (59) sets, 184 regions were correctly classified as clips. This corresponded to 96.4% (189 of 196) individual clips detected from the 42 fractions. In 30 out of 42 treatment fractions, all surgical clips were correctly identified. An additional five of 42 fractions had no misidentified regions, but some of the clips were missing. The absence of clips in these images allowed the applicator positions and sizes to be automatically identified with no other intervention. However, for the remaining seven fractions, the regions mislabeled as clips had to be manually identified and removed, so they were not used in calculating the applicator positions and sizes.
Predicted applicator position and size
The distances between the physician-selected and algorithm-predicted applicator center positions are shown in Figure 6. The applicator position was correctly predicted for 20 out of 42 fractions and was within 0.5 cm for 33 of 42 fractions. The maximum difference in positions was 1.12 cm. The maximum differences between any x or y coordinates never exceeded 1.0 cm.
Fig. 6
The distribution of the differences in distance (cm) between the physician-selected and algorithm-predicted applicator center positions for the 42 fractions
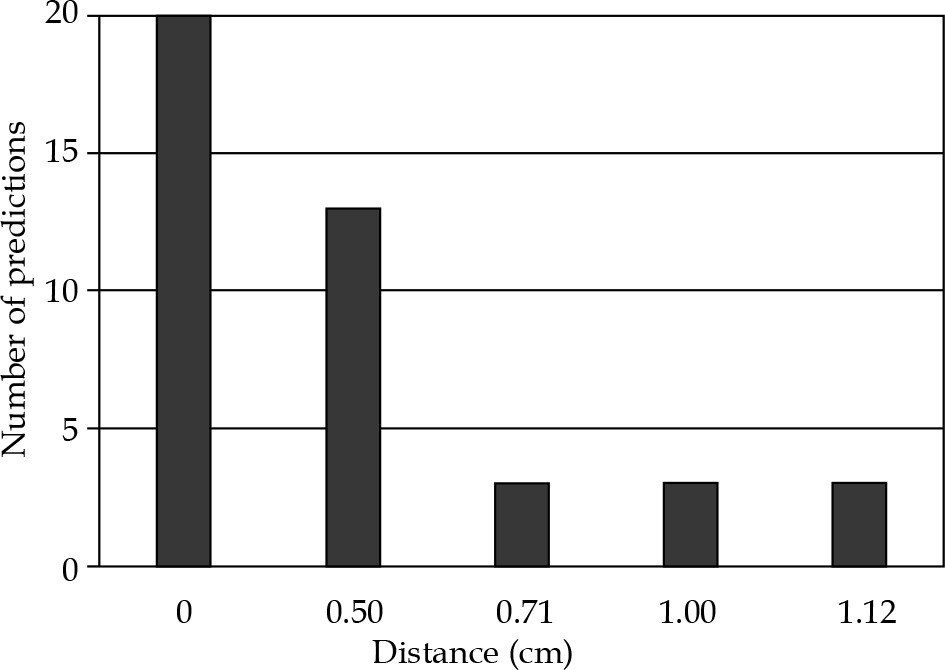
Table 1 is a confusion matrix that compares the physician-selected and algorithm-predicted applicator sizes. The applicator size was correctly predicted for 25 out of 42 fractions and with maximum discrepancy < 1 cm for the remaining 17 fractions. As the applicator sizes were available in 5, 6, 7, and 8 cm diameters, the corresponding calculated PTV diameters ranged from 4.88 to 6.37 cm, 4.93 to 7.05 cm, 6.86 to 8.24 cm, and 8.86 to 9.33 cm, respectively.
Table 1
A confusion matrix comparing the physician-selected and algorithm-predicted applicator sizes (cm) for the 42 fractions. The diagonal was bolded to signify that those were cases when selected/predicted sizes were the same
| Applicatorsize (cm) | Algorithm-predicted | ||||
|---|---|---|---|---|---|
| 5 | 6 | 7 | 8 | ||
| Physician- selected | 5 | 10 | 4 | 0 | 0 |
| 6 | 7 | 8 | 3 | 0 | |
| 7 | 0 | 0 | 4 | 3 | |
| 8 | 0 | 0 | 0 | 3 | |
The combination of applicator position and size was correctly predicted (0 cm difference) for 13 out of 42 fractions (31.7%). The size was predicted correctly with the position differing by 0.5 cm for 8 of 42 cases. The position was predicted correctly with the applicator size differing by 1 cm for 7 out of the 42 fractions. These made up 28 out of 42 fractions (66.7%), where the algorithm-predicted applicator was only different by at the smallest increment in either position or size.
Discussion
The algorithm predicted the position and size with a moderate success, considering the complexities of the physician-selection process. Such complexities could be seen by the range of PTV diameters largely overlapping for the physician-selected applicator sizes, especially for the 5 cm and 6 cm applicators. This was the main cause of diminished accuracy because it increased the difficulty of size selection solely based on surgical clips. The algorithm in its current state does not have the desired accuracy to be the main determinant of choosing applicator parameters (accuracy > 95% would be considered adequate).
While algorithm accuracy was less than optimal, it still showed promising qualities. The algorithm replicated the results of each fraction for multiple trials, the consistency of its predictions. The algorithm can also produce a prediction within 15 sec. The clip detection model also performed exceptionally well in detecting surgical clips and calculating the PTV diameter defined by the clips. The PTV diameter, closest applicator size to the PTV, and the position of clip centers can simplify the decision-making process by explicitly calculating parameters that are used to select the applicator. Simplifying the decision-making process will also shorten the selection time and thus the overall compression time of the patient’s breast. For the above reasons, the algorithm could be implemented as a tool to consistently and quickly display useful information to improve the process of treatment planning.
One alternate application of the algorithm could be as an independent check of the physician-selected parameters, since most (66.7%) of the algorithm predictions for either position or size were equal to or within the nearest choice. This is further supported by the predicted position varying by no more than 1.12 cm (different by 1.0 cm in one direction and 0.5 cm in the other direction), and the predicted applicator size varying no more than 1 cm. Since the predicted applicator position and size were not expected to be drastically different from the physician-selected applicator, they can be used to identify large discrepancies (i.e., position differing > 1.0 cm in either x/y direction or size differing by > 1 cm). Detecting these discrepancies could prevent treatment errors, such as misreading of the grid or recording the wrong position or size when preparing for treatment and associated dose calculations [7].
Algorithm limitations and future directions
The algorithm relies on a clip detection model to identify the clips to calculate applicator parameters. In the fractions presented in this study, at most, the model only failed to detect one clip in each image. Some images may have confounding factors, which are not ideal for the current detection methods. Such factors include overlap of multiple clips, overlap of clips with grid markers, or orientation of clips along the imaging axis appearing as tiny dots. This could cause clips in an image to go undetected, which in turn would affect the predicted applicator position and size. At this point, all algorithm predictions were reviewed to verify that the correct number of clips were detected and that no regions were mislabeled as clips to validate the prediction accuracy.
The selection of applicator by radiation oncologists is limited by a collision with the chest wall and PTV located within 0.5 cm of the skin [18]. These constraints were not implemented into the algorithm. In practice, the radiation oncologist could have shifted the applicator position or used a smaller applicator size, which might account for some of the differences between the physician-selected and algorithm-predicted applicator positions and sizes.
Another limitation of this algorithm is the lack of inclusion of radiomic-feature (e.g., tissue texture) evaluation. During an applicator selection, the radiation oncologist may shift the applicator center and adjust the applicator size to cover high density or ductal tissues. Different radiation oncologists could have different interpretations for modifying the applicator parameters from their visual assessments. A larger sampling from different attending radiation oncologists and more work are warranted to study the inter-observer variability. While radiomic-feature evaluation was not implemented into the algorithm, as there were no visually consistent features readily identified among the evaluated images, an approach using a gray-level co-occurrence matrix (GLCM) to encode spatial relationship of pixels with similar intensities could be applied [19]. Deep learning has also been utilized to identify texture patterns and breast density [19,20]. With a large enough dataset, deep learning could be a viable approach to detect textures, which could be used in conjunction with the position of the surgical clips to predict the applicator position and size.
The current algorithm is useful for predicting fractions to be treated with round applicators. While a majority of fractions (> 90%) at our institution are treated with round applicators, expanding it to D-shaped applicators would cover all possibilities. There are two main issues that would have to be addressed to implement automatic position and size selection of D-shaped applicators. First is how to distinguish whether a round or D-shaped applicator should be chosen. This could be addressed primarily by evaluating the clip positions. D-shaped applicators are primarily used when the PTV is located near the chest wall. The distance of the clip centers and the proximal grid boundary can facilitate this decision. The second issue to address is how to determine the optimal D-shaped applicator size. A possible solution would be to select the applicator with the size closest to matching the expanded PTV, as was done for the round applicators. However, unlike the cylindrically-symmetric round applicators, D-shaped applicators have a fixed rotational orientation, with the flat side located closest to the chest wall.
Conclusions
This study describes an algorithm that can automatically and consistently select the position and size of round AccuBoost applicators based on imaging of surgical clips. The accuracy of these selections is less than 95% when compared to physician-selected parameters, and is not adequate to be considered as the primary determinant of treatment decision in the clinic. Individual capabilities require further work to implement radiomic-feature detection and consider inter-physician variability.
However, the algorithm shows a promise for some applications in the clinic. The clip detection model in the algorithm has a high sensitivity (96.6%) and high specificity (98.2%), which could provide helpful information to the radiation oncologist to simplify their decision. Consequently, this might lead to uniform and quicker decisions by the radiation oncologists. The algorithm could also be applied as an independent verification to the physician-selected parameters. Most predictions (66.7%) were within the smallest increment of deviation in either position or size, and thus could be used to identify large deviations to ensure that treatment decisions are consistent with the quantitative data extracted from the image.


