
Purpose
Image registration is the process of transforming two or multiple sets of images obtained at different times or with different modalities into a single coordinate system [1, 2]. It is generally classified as a rigid or non-rigid image registration. In rigid image registration (RIR), the pixel-to-pixel relationship remains the same as all pixels move in rotation and translation during transformation process [2]. On the other hand, a non-rigid image registration, which is also known as a ‘deformable image registration’ (DIR) involves estimating geometric transformation between two images to map them onto a common coordinate system. In the process of DIR, the estimated transformation does not only include rigid transformations (i.e., rotation and/or translation), but also deformations (e.g., shrinking or stretching).
Brachytherapy (BT) following external beam radiotherapy (EBRT) with concurrent chemotherapy is the standard treatment in patients with locally advanced cervical cancer [3, 4]. Adding BT to EBRT, which enables dose escalation and greater organ sparing, improves local control and survival rates [5]. In 2006, the Groupe Européen de Curiethérapie, European Society for Radiotherapy and Oncology (GEC-ESTRO), published recommendations for three-dimensional (3D) image-guided brachytherapy (IGBT) in cervical cancer, and IGBT became the new standard in many centers [6]. Magnetic resonance imaging (MRI) is considered the gold standard for IGBT providing the best visualization of the cervix and tumor volume. However, MRI is not available in many radiation oncology departments and computed tomography (CT)-based IGBT is more commonly used [7]. GEC-ESTRO IGBT recommendations are based on 3D dose-volume parameters, and dose constraints for organs at risk (OARs) are clearly defined not to lead to severe late toxicity [8, 9]. However, changes in the rectum and bladder filling, differences in applicator and organ positions, and changes in tumor volume between treatment fractions can lead to significant dose differences between fractions. Therefore, it is essential to establish a proper CT image acquisition and treatment planning prior to each BT fraction in order to deliver an accurate, high-dose of radiation to the target volume, while sparing surrounding OARs [10]. However, acquisition of CT images, delineation of structures, and re-planning prior to each fraction is time-consuming, which lead to an increase in in-place time of applicators, probability of intra-fractional anatomical changes, and patient discomfort [11, 12].
To reduce in-place time of the applicators, Chapman et al. [11] used a DIR-based automatic contouring for magnetic resonance imaging (MRI)-guided IGBT for the first time. With this technique, high-risk clinical target volume (HR-CTV) and OARs could be contoured automatically accounting for inter-fractional anatomical changes, and it was shown to present increased accuracy compared to rigid registration. Tandem and ring (T-R) applicators were used in Chapman et al.’s study, and it was demonstrated that DIR-based algorithm could replace manual contouring in appropriately selected patients with minor inter-fractional anatomical changes [11]. Based on recommendations of the American Association of Physicists in Medicine (AAPM) Task Group 132, DIR can be used during image-guided radiotherapy (IGRT) for automatic contouring to reduce segmentation workload [13]. Nevertheless, its’ contribution is limited in large anatomical deformations. For IGBT, DIR-based automatic contouring performance can also be affected by different applicator sets, different amount of packing, and introduction of different fixators. To our knowledge, there is no published data on using CT to CT-DIR-based auto contouring for T-R and T-O applications. In this study, we evaluated the role of CT to CT-DIR-based automatic contouring in patients undergoing cervical IGBT with T-R or T-O insertions.
Material and methods
Patient setup, imaging acquisition, and contour delineation
Computed tomography imaging data of 28 patients with locally advanced cervical cancer, who were treated with definitive chemo-radiotherapy followed by BT, of whom 50% of patients were treated with T-O and the remaining 50% with T-R applicators, were included in this study. The planning aim dose was 7 Gy per fraction administered via high-dose-rate (HDR) IGBT (four fractions), following 50.4 Gy (1.8 Gy/fraction in 28 fractions) conventionally fractionated EBRT. A thorough gynecologic examination and plain MRI scans with T2 sections without applicators in place were performed at the end of EBRT for all patients in order to evaluate tumor shrinkage. All patients had a rectal enema just before application, and Foley’s catheter was inserted to obtain reproducible bladder filling at the time of CT simulation and BT. When the rectum was empty enough on CT simulation, we passed on to the contouring stage. CT images were obtained at each BT fraction, and HDR-IGBT system (BrachyVision, Varian medical systems, Palo Alto, CA, USA) with Ir-192 was used with CT-compatible Fletcher type intra-uterine T-O or T-R applicators. While a rectal retractor was used in T-R insertion, posterior packing was applied in T-O application to avoid an overdose to the rectum. In both techniques, anterior packing was performed to decrease bladder doses.
We used CT planning for BT. After insertion of the applicators to the uterus and vagina, CT scanning was done with Toshiba Aquilion LB CT Simulator (Toshiba Medical Systems; Otawara, Japan) using metal artifact reduction. Imaging protocol was 100-120 kVp tube voltage, 300-350 mAs current value, and 2-mm slice thickness. Scanned data was transferred to BrachyVision treatment planning system (TPS) version 8.9 (Varian Medical Systems, Palo Alto, CA, USA). HR-CTV, intermediate-risk clinical target volume (IR-CTV), and OARs (i.e. the rectum, bladder, small bowel, and sigmoid) were delineated manually on CT imaging data sets by one of the three radiation oncologists specialized in gynecologic RT at each fraction, according to the GEC-ESTRO and CT-based contouring recommendations [6, 14-16]. Gynecologic examination and MRI findings (T2-weighted images) at diagnosis and prior to the first BT fraction were used to increase accuracy of CT-based contouring. Visualization of HR-CTV and IR-CTV was made with CT/MRI fusion only for the first BT fraction.
Image registrations
Scanned data of the patients were transferred to RayStation (RaySearch Laboratories, Stockholm, Sweden) treatment planning system (TPS) for image registration. The RayStation TPS has a hybrid DIR algorithm, which is based on a mathematical formula [17]. Algorithm for hybrid DIR in RayStation is called anatomically constrained deformation algorithm (ANACONDA), in which the objective function is composed of four terms, including maintaining image similarity, keeping the image grid smooth and invertible, keeping the deformation anatomically reasonable when structures are present, and a penalty term when structures are used [18]. Planning CT image for the first BT fraction was used as the reference image. Since there are no delineated structures in subsequent CT images, the registration was performed considering densities. Hybrid algorithm deforms contours as pixels in CT. In detail, structures can be propagated from one data set to another using a displacement vector field created. Firstly, the reference image was rigidly fused by CT images of subsequent BT fractions in order to predictably align images. Performing RIR is necessary in RayStation prior to DIR. Thus, RIR was automatically done based on the bony structures. Following, hybrid DIRs were performed, and deformed CT images were verified by one of the three radiation oncologists. After successful deformation confirmed by the radiation oncologist, deformed contours were mapped from the reference CT to the subsequent CT. The process was repeated for all CT data sets. Propagation of contours from the first fraction onto the images of other BT fractions was done without editing. A total of 84 DIR registrations were performed. After structure mapping, the volume of manual and automatically-propagated contours of HR-CTV, IR-CTV, and OARs were recorded.
Treatment planning in brachytherapy
BrachyVision TPS version 8.9 (Varian Medical Systems, Palo Alto, CA, USA) was used to generate treatment plans in this study. Dwell positions were uniformly defined within 5-mm intervals along the applicators. By defining the tip of the tandem and ovoids for T-O insertion, and by defining the tip of the tandem and the center of the ring for T-R insertion, the applicator model was placed on CT dataset. All dwell times were set to five seconds and then, isodose curves were fine-tuned using a isodose shaping tool.
Dose to HR-CTV was prescribed in terms of minimum dose delivered to 90% of HR-CTV (D90). Doses delivered to OARs were computed using minimum doses received by 2 cc of maximal dose regions (D2cc). Minimum and maximum acceptance criteria for the targets and OARs are presented in Table 1. EQD2 values were calculated using α/β = 10 Gy for targets, and α/β = 3 Gy for OARs.
Data analysis
Manual and automatically-propagated contour comparisons were performed according to the target and OAR volumes. In addition, dice similarity coefficient (DSC), a statistical tool for measuring similarity between two sets of data, was calculated to evaluate the performance of the overlap accuracy between manual segmentation and automatically-propagated contours. The equation for this concept was as follows:
where A and B are the volume of manual and automatically-propagated contour, respectively, |A|∩|B| means the intersection of the two volumes, and |A|+|B| means the sum of the two volumes. Similarity increases as DSC scores approach 1. Previously, Goldberg-Zimring et al. [19] suggested that a DSC score should be at least 0.7 for a satisfactory volume match, and a DSC score above this threshold was considered to be a successful propagation of the structures in the present study. We also evaluated mean time spent for DIR and structure mapping for each patient.
Statistical analysis was performed using SPSS software, version 23.0 (SPSS Inc., Chicago, IL, USA). Volumetric and dosimetric comparisons between manually- and automatically-propagated contours were performed using Student’s t-test (two-tailed). P-value < 0.05 was considered statistically significant.
Results
Volumetric comparisons
Although the mean volumes of automatically-propagated contours were larger than the manual contours for HR-CTV, IR-CTV, the bladder, and the small bowel for T-R insertion, and all structures except for the sigmoid for T-O insertion, the differences between the manual and automatically-propagated contours were statistically significant for the small bowel only (p < 0.05 and p < 0.01 for T-R and T-O, respectively). Table 2 shows mean volumes of manual and automatically-propagated contours.
Table 2
Mean volumes of manually- and automatically-propagated contours for tandem-ovoid and tandem-ring insertions
Figure 1 displays CT images of two patients who underwent T-R and T-O insertion each. In both insertions, the overlapping of the applicators was provided with DIR. Figure 1 also shows HR-CTV and IR-CTV volumes, which were delineated manually or automatically. Comparisons of manual and automatically-propagated contours of OARs for these patients are provided in Figure 2.
Fig. 1
Rigid and deformable image registration for two patients who underwent tandem-ring (A) and tandem-ovoid (B) in- sertion. Manually- and automatically-propagated contours are presented for HR-CTV, IR-CTV, the rectum, bladder, sigmoid, and small bowel
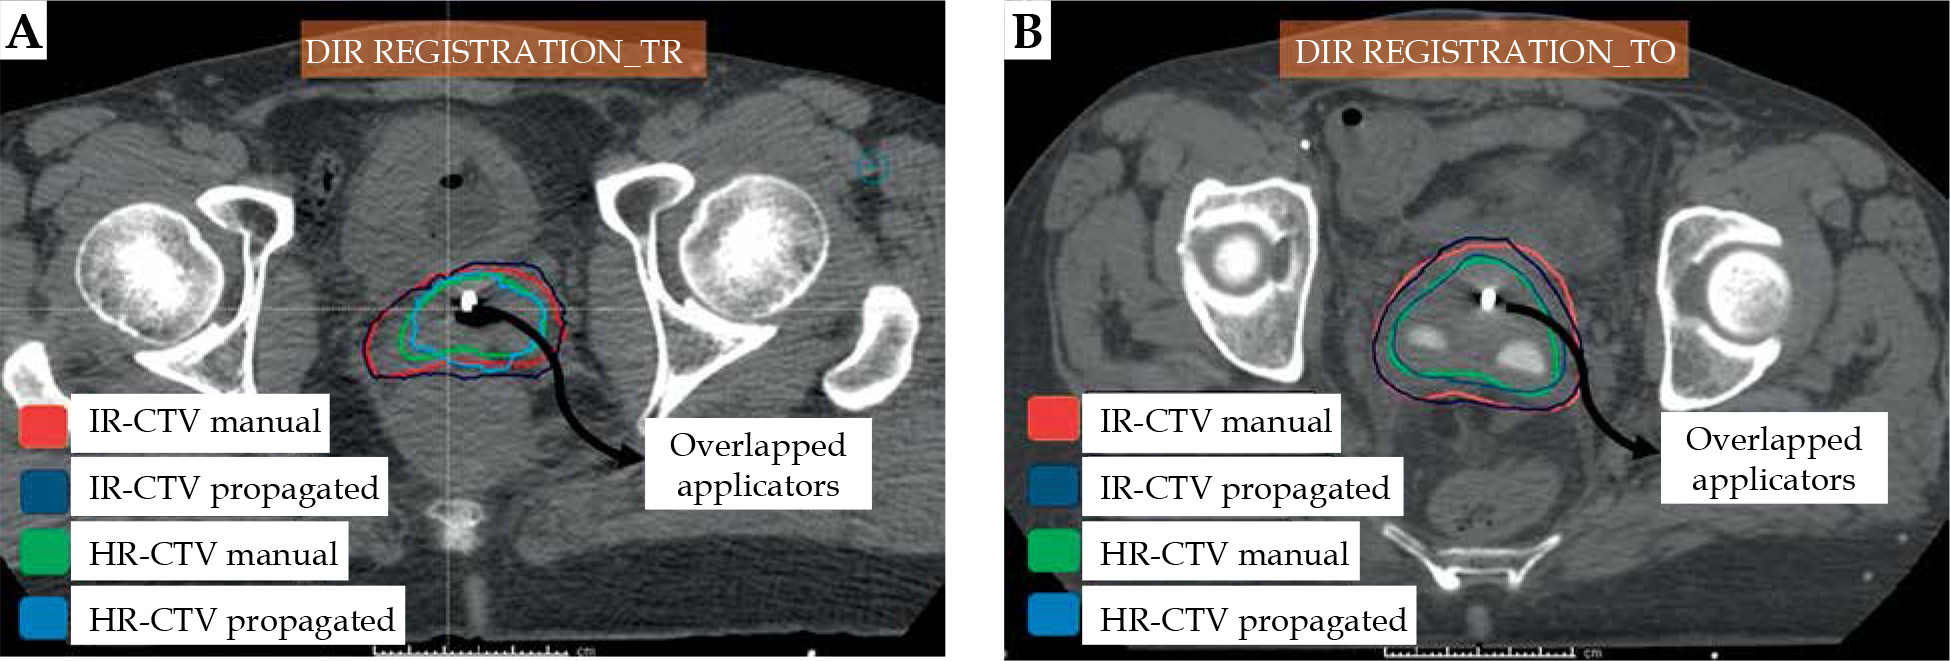
Fig. 2
Organs at risk volumes defined manually or automatically before and after deformable image registration
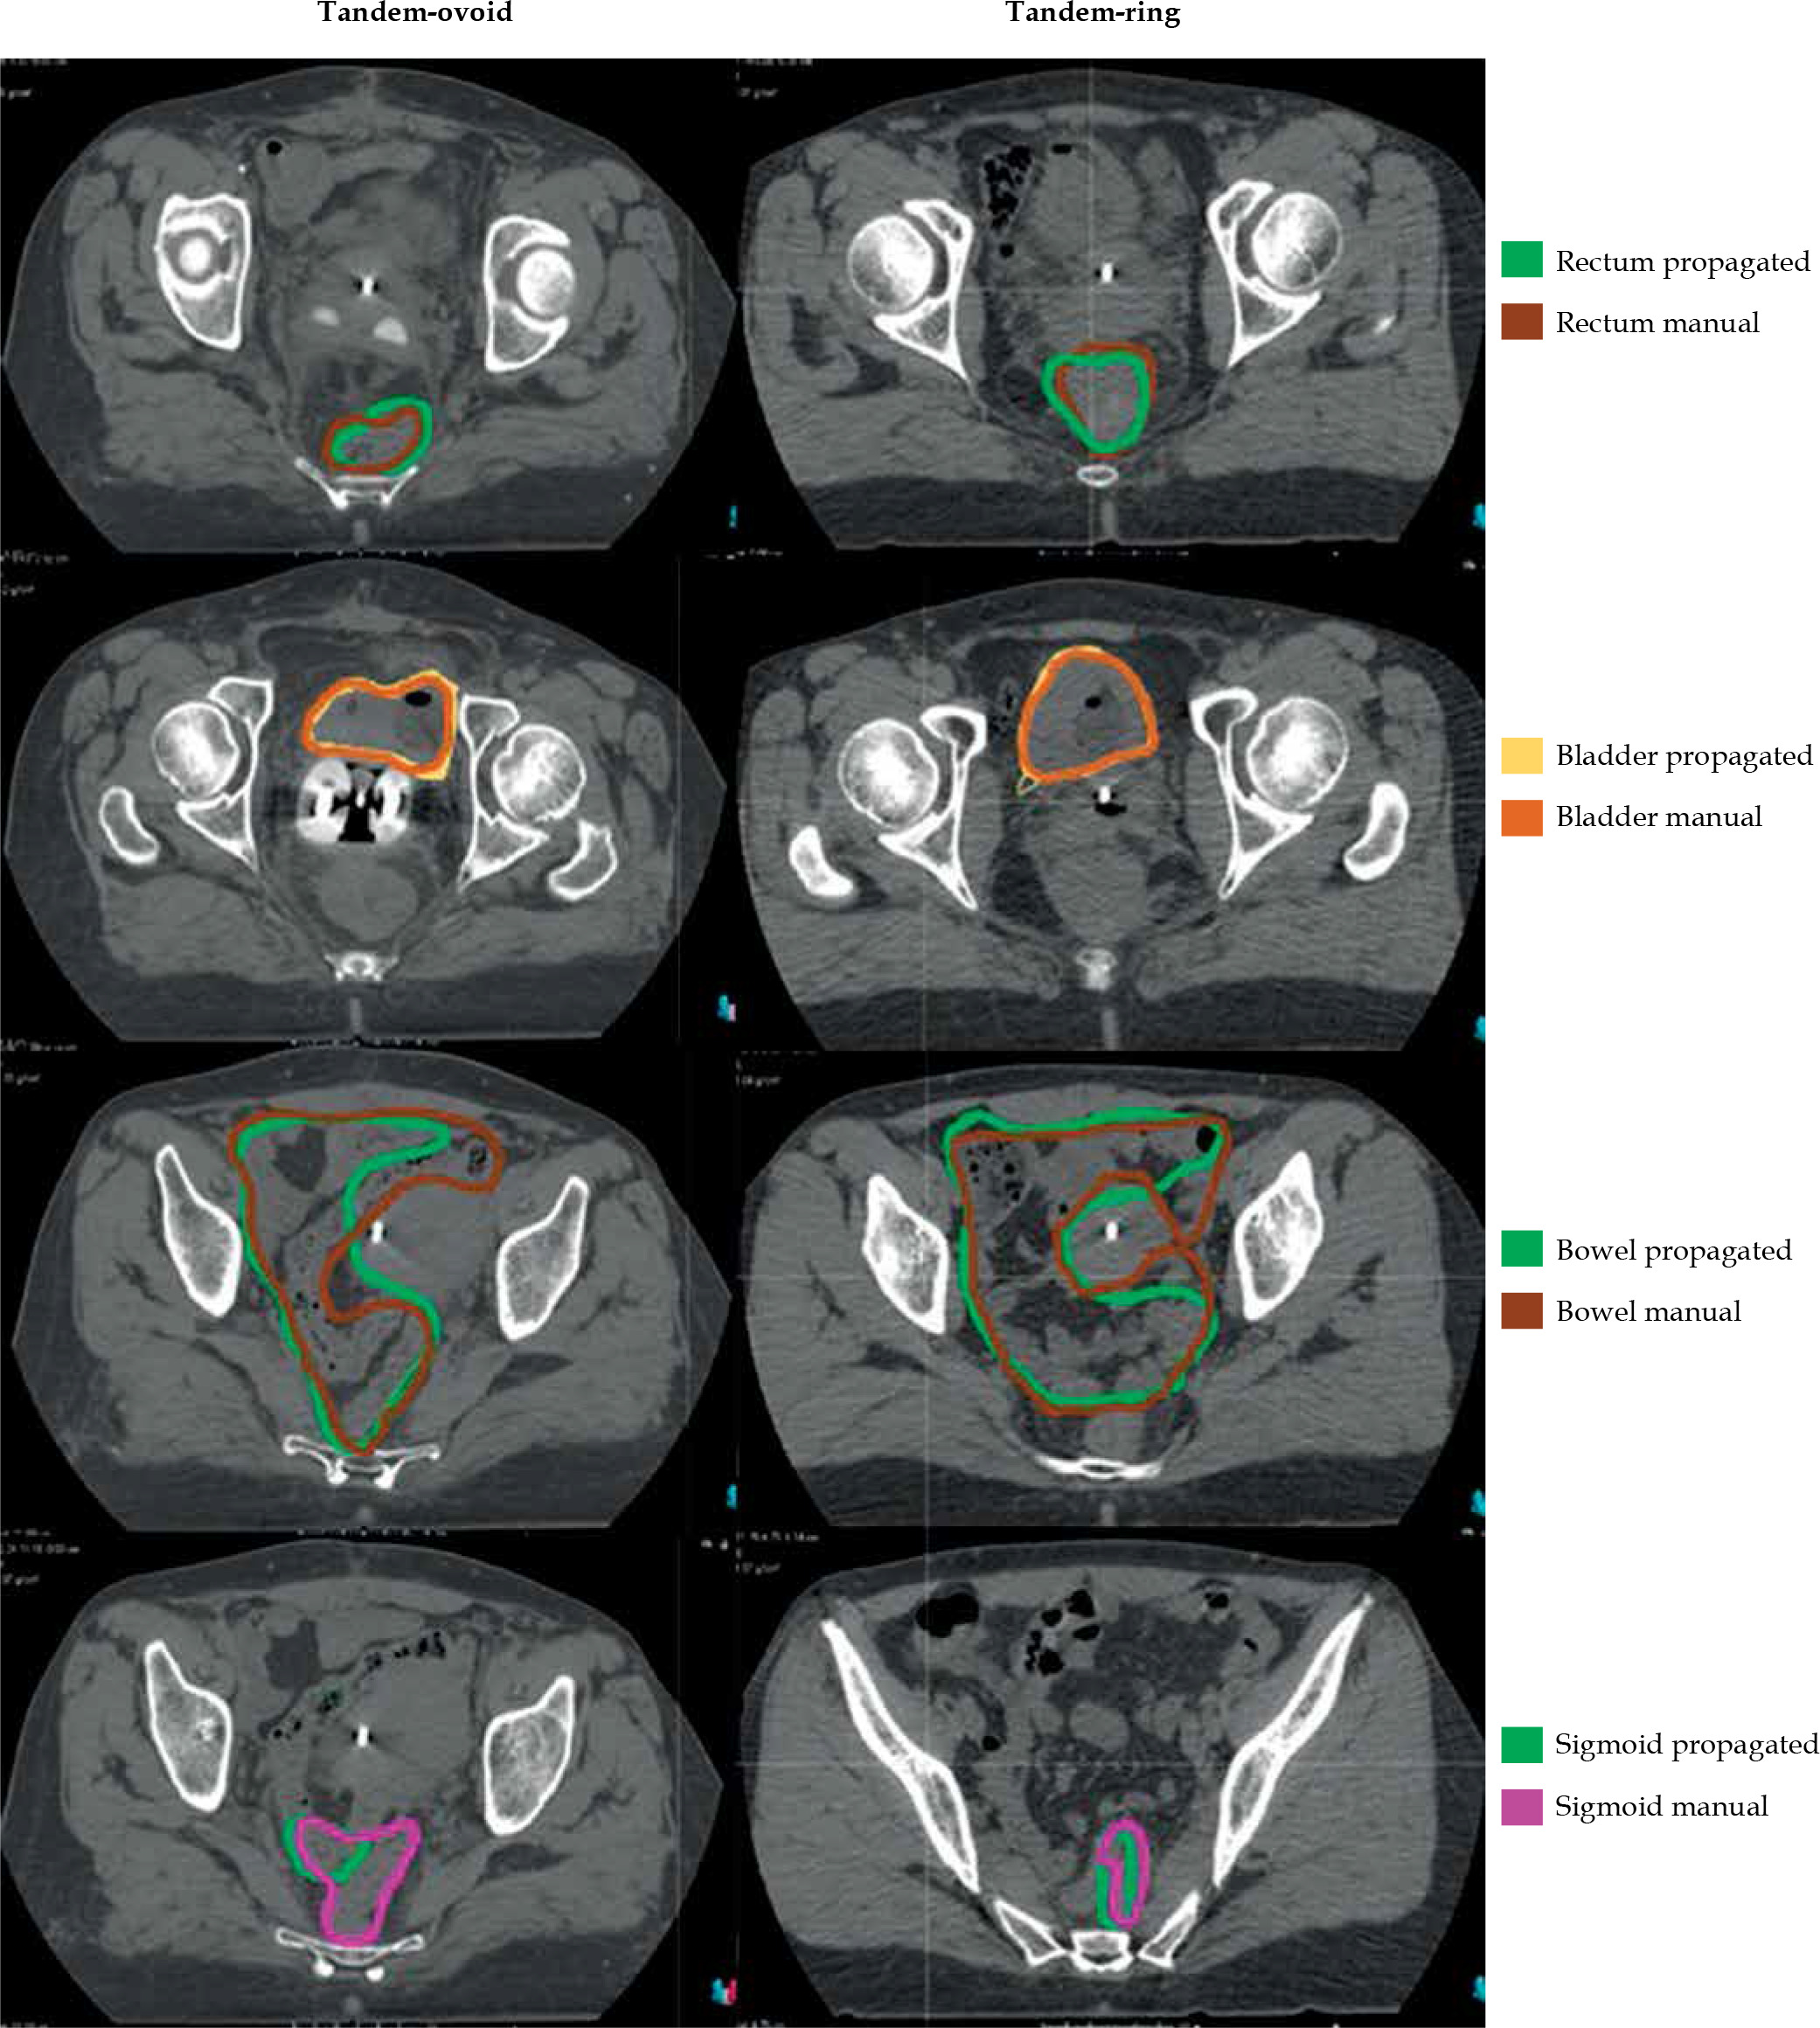
Table 3 shows DSC scores of the automatically-propagated and manual contours for both T-O and T-R applications. These results indicate that the contour similarities between the manual and automatic segmentation are weakest for the sigmoid and small bowel for both insertions. Furthermore, the automatic segmentation of the rectum for T-R insertion is much better than that for T-O insertion.
Table 3
Mean and median values of dice similarity coefficients for comparison of manually- and automatically- propagated contours of target volumes and organs at risk
Time comparisons
The average time to perform DIR and create automatically-propagated contours was 2.0 ±0.1 minutes per fraction. On the other hand, the mean manual segmentation time was 14.0 ±0.4 minutes per fraction. Automatic contouring dramatically reduced delineation time (p < 0.001). The measured time for automatic contouring included DIR performing time plus auto-segmentation time for CTV and OARs, while for manual contouring, it only included delineation time of CTV and OARs.
Dosimetric comparisons
Table 4 provides mean doses for treatment plans, in which the structures were delineated manually and automatically. The dosimetric comparison of manual and automatic contours was performed using treatment plans created according to the manually-contoured structures. All treatment plans were acceptable in terms of HR-CTV, IR-CTV, and OARs doses for DIR-based automated segmentation. In general, it was observed that the doses were lower for the manually-contoured plans compared to the automatically-contoured plans. The mean HR-CTV D90 difference between the manually- and automatically-contoured plans was 1.3 ±0.12% and 0.6 ±0.02% for T-R and T-O, respectively. For HR-CTV D98, the dose difference was 6.0 ±0.27% and 6.5 ±0.17% for T-R and T-O, respectively. For IR-CTV D98, the dose difference was 0.7 ±0.2% and 0.3 ±0.4% for T-R and T-O, respectively. For OARs, the maximum dose difference was observed for the small bowel, which was 4.0 ±0.3% and 4.8 ±0.6% for T-R and T-O, respectively. The mean dose difference between the manually- and automatically-contoured plans was statistically significant only for HR-CTV D98 doses.
Table 4
Target and organ at risk (OAR) doses in EQD2 for manual and automatic contouring
[i] EQD2 – equivalent dose at 2 Gy fractions; SD – standard deviation; HR-CTV – high-risk clinical target volume; IR-CTV – intermediate-risk clinical target volume; D90 – minimum dose delivered to 90% of volume; D98 – minimum dose delivered to 98% of volume; D2cc – minimum dose received by 2 cc of maximal dose regions of volume
Discussion
In the current study, the safety and applicability of DIR-based automatic contouring was tested in the planning process of BT in patients with locally advanced cervical cancer, who underwent T-R or T-O IGBT application after chemo-radiotherapy. We found that DSC scores for HR-CTV and IR-CTV contours were both high. The average time for contouring with DIR and automatic propagation was also significantly reduced when compared to the manual segmentation.
In this automatic contouring with DIR method, the contouring success depends on DIR performance, structure mapping algorithm, and accuracy of segmentation in the first fraction. To avoid possible uncertainties, a single-type DIR and mapping algorithm was used for all CT scan images in this study without editing. In a similar study by Chapman et al. [11], HR-CTV and OARs contours were delineated on MR images in 10 patients who underwent T-R applications, and it was demonstrated that HR-CTV could be propagated with a DSC score of 0.79. In our CT-based DIR study, the applicability of DIR imaging and automatic contouring was tested for both T-R and T-O applicators, and the calculated DSC score for HR-CTV was found to be 0.83 and 0.84, respectively. The score of DSC ranges from ‘0’ indicating ‘no spatial overlap between two sets of binary segmentation results’ to ‘1’ indicating ‘complete overlap’. It is generally accepted as an excellent match when DSC score is > 0.75 and a good agreement when > 0.7 [20, 21]. The DSC score of 0.83 and 0.84 in our study indicates an excellent similarity between the manual and automatic contouring, and our results are comparable to the published data [11, 22, 23]. Our DSC scores were higher than those of Chapman et al.’s study, mainly due to our CT to CT registration, which was previously demonstrated as highly efficient for DIR registration [24]. Differences in signal characteristics and spatial intensity distribution of different image modalities are the main problem of registration of multimodal images (MRI to CT, etc.). As these metrics are often used in the registration optimization process, uncertainties increase when the organ deformation is added to inherent difficulties of the process [25, 26]. Kirby et al. [27] evaluated the accuracy of 11 different DIR algorithms, and showed that DSC scores could be obtained between 0.63 and 0.96 for the same structure for different DIR algorithms. In our study, after evaluation of DSC scores, we found that DIR-based automatic contouring was suitable for both HR-CTV and IR-CTV.
The registration and automatic segmentation time are also affected by algorithm differences. The average time for DIR and automatic propagation of the contours in our study was 2 minutes, while it was 14 minutes for manual segmentation. In a similar study by Chapman et al. [11], DIR-assisted contour propagation took 3 min/fraction versus 13-25 min for manual OARs contours, and another 4-12 min for HR-CTV contours, including time required to review imaging from diagnostic MRI and previous BT fraction, to properly define HR-CTV. We only used contouring process for the comparisons of time delivery in our study without taking into account the evaluation of MRI scans. Similar to Chapman et al.’s study, we found a significant decrease in the time for contouring with DIR. The intra-fraction organ motion during planning process leads to uncertainties in dose delivery, especially in doses to the rectum, sigmoid, and bowel. We believe that the decrease in the contouring and automatic planning times with the introduction of DIR will minimize this uncertainty.
Accuracy of DIR can be significantly influenced by a large variation of organ volumes and positions [23, 28]. The mean DSC score for the bladder in our study for two different applicators was 0.84 and 0.94. It is clear that there is an excellent match for the bladder since all the patients in all fractions had a urinary catheter inserted during image acquisition, planning, and treatment, which uniformed the volume and shape of the bladder. Supporting our results, Wognum et al. [29] reported small volume differences (range, 100-150 ml) in the bladder among six intensity-based algorithms. Evaluation of DSC scores showed that DIR-based automatic contouring was suitable for the bladder in both insertions.
DIR is a great challenge for the rectum, since it may vary in shape and content in each application [30]. To reduce this variation, all our patients received a rectal enema prior to each BT fraction, and a CT scan was performed to verify the emptiness and distension of the rectum. The DSC score was quite satisfying for the rectum when T-R was used. However, when T-O was used, the mean DSC score was only 0.58, which was significantly lower, even with the same rectal protocol. We believe that this was mainly due to the rectal retractor associated with T-R applicator. Since there was no retractor in the T-O applicator in our study, the differences in the amount of rectal packing may have caused this low DSC score. The DSC score for the rectum showed that DIR-based automatic contouring was useless for the T-O insertion.
The main mismatch between the manual contouring and DIR in our study was for the sigmoid and small bowel. Since there were no fixations for the small bowel and sigmoid, they were free to move more independently from the cervix and applicator than were the bladder and rectum. Similar results were reported by Nesvacil et al. [31] with lowest volumetric uncertainties for the bladder and the rectum, and highest for the sigmoid.
For HR-CTV and IR-CTV, we observed that the mean volumes of the automatically-propagated contours were larger than the manual contours in both the T-O and T-R insertions, but these differences were not statistically significant. However, small volumetric differences can cause large differences in dose both in target and OARs due to high-dose gradients in BT. It may lead to overdose in OARs, increase toxicity, underdose in targets, and decrease local control rates [29]. Although there were volumetric differences between the manually- and automatically-contoured HR-CTV and IR-CTV, the mean dose differences were not statistically significant for HR-CTV D90 or IR-CTV D98. On the other hand, the volumetric differences significantly affected HR-CTV D98 doses. The EQD2 dose difference for HR-CTV D98 was smaller than 5 Gy for both insertions. This result is comparable to the previous studies that observed EQD2 dose difference in a range of 1-5 Gy over the entire course of RT [11, 12, 32]. Regarding various dose-volume histogram parameters, D90 was demonstrated the most reliable predictor for local tumor control in BT [33]. However, there are some reports showing that EQD2 doses higher than 67 Gy for HR-CTV D98 increase local control rates [33, 34]. Although HR-CTV doses were low in automatic contouring, results were obtained above a 67-Gy threshold.
Standard deviation (SD) is a measure of the amount of dispersion or variation of the set of a value. Even if mean dose values are identical, large SD values could be caused by unacceptable treatment doses. In our dosimetric results, the largest SD values were obtained for D2cc of the sigmoid due to large volumetric deviation of the sigmoid. Even though SD values of the D2cc of sigmoid were large, all D2cc of the sigmoid values met the acceptance criteria. However, DIR was not suitable for the sigmoid due to low DSC score.
This study also has some limitations. The DIR performance was verified by three radiation oncologists to minimize the uncertainties and then, DSC scores were evaluated. However, the results could have been supported by other metrics to obtain more certain results. All results calculated with the DIR algorithm in the present study contain some DIR uncertainties. Verification of the DIR algorithm was previously carried out by several researchers [35-37]. Virtual phantoms were generally preferred for verification. Mohammadi et al. [38] evaluated hybrid-based DIR algorithm using a virtual phantom, and demonstrated a low registration uncertainty for both contour matching and dose mapping. On the other hand, DIR is particularly challenging in the pelvic region due to large and complex deformations caused by organ motions, applicator displacement, and differences in the rectum and bladder filling [23, 28, 39]. The performance of hybrid-based DIR algorithm was studied in this study. Based on the DSC scores, DIR-based contour propagation was acceptable for both the T-R and T-O applications. However, editing automatically-propagated contours by an experienced gynecologic radiation oncologist can improve the accuracy of the volume definition, particularly for the sigmoid and small bowel, while for the rectum, it may only be necessary for the T-O application. The bladder volumes and shapes were very similar between the fractions, since all the patients had a urinary catheter inserted, which is one of the strongest sides of our study.
Conclusions
To our knowledge, this is the first study to propagate contours from the first-fraction CT images to the subsequent CT images for T-R or T-O insertions in cervical IGBT. This process dramatically decreases contouring time. Our method is feasible for automatic segmentation of the structures other than the sigmoid and small bowel for both the T-R and T-O applications. It is also useless for the rectum for the T-O insertion. Verifying each automatically-delineated structure by the clinicians can improve the results. For better automatic contouring of the bladder, using a urinary catheter during CT simulation and in every BT fraction is strongly recommended. Although there were volumetric differences between the manually- and automatically-contoured structures, only HR-CTV D98 was statistically significantly affected.


