
Purpose
For cervical cancer treatments, combined intracavitary and interstitial brachytherapy can be performed using a tandem and ring (TR) applicator [1,2]. The path of a high-dose-rate (HDR) brachytherapy source has been found to deviate from centerline in a curved ring channel when pushed toward an outer wall by a drive cable [3,4,5]. Multiple studies have sought to quantify this effect for standard TR applicators. Source positions for different-sized Vienna applicators (26, 30, and 34 mm diameters) were found to deviate by an average of 3.2-4.5 mm from expected dwell positions given by a circular path defined by the channel centerline with 2.0-4.5 mm differences seen at the distal end of the ring channel [6]. Furthermore, source positions have been found to deviate from the path provided by a computed tomography (CT) dummy wire within a full-ring channel with differences up to 2.5 mm reported [7,8]. In general, positional uncertainties will affect the dose distribution according to the dose gradient estimated as 5-12% per mm within distances of 1-3 cm from a single 192Ir source position [9]. For TR applicators, dose-volume histogram (DVH) parameters have been evaluated with a 2.5 mm systematic shift of ring channel dwell positions leading to deviations < 3% in D2cm3 values for the bladder, rectum, and sigmoid along with changes < 1.2% in D90% values for the high-risk clinical target volume (HR-CTV) [6]. A separate study found that the rotation of dwell positions in the ring plane had “limited impact” on organ at risk (OAR) and target DVH parameters with < 1% change per mm of displacement along the circular source path [10]. From the same study, DVH parameters were found to be more sensitive to TR applicator shifts that were non-coincident with the ring channel with up to 6% changes in bladder and rectum D2cm3 values per mm displacement in the AP direction [10]. The largest dose differences have been observed locally near the applicator. In a study assessing vaginal mucosa dose for a TR applicator, large surface dose differences up to 25% were produced by a 1 mm shift in dwell position within the ring channel [11].
In addition to full-ring applicators, different split-ring designs have been introduced for gynecological treatments including the Mick® split-ring applicator (Eckert & Ziegler BEBIG, Germany) and the VeneziaTM advanced gynecological applicator (Elekta, Sweden) [2,12]. The present study focuses on the VeneziaTM applicator first used clinically in 2017 [2]. The VeneziaTM applicator (Figure 1) incorporates three available lunar ovoid sizes with an effective diameter between split-ring channels of 22, 26, or 30 mm [13]. In contrast to conventional TR applicators for which the HDR brachytherapy source travels nearly in a full circular path within the ring plane, the lunar ovoids of the VeneziaTM applicator are separated such that the source travels approximately in a half-circle entering on each side. The factory offset to the most distal dwell position is 5 mm from the inner lumen tip. Various tandem lengths (0-70 mm) can be used with applicator angles of either 15° or 30°.
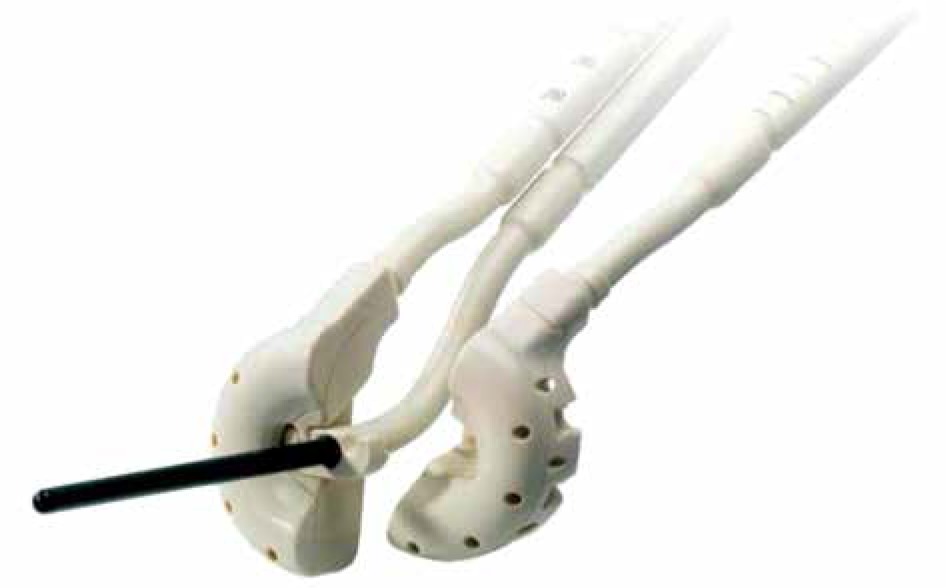
Fig. 1
Venezia applicator with 26 mm lunar ovoids and 70 mm central tandem [13]. Guide holes within each ovoid can be used for the placement of interstitial needles
A GEC-ESTRO report on applicator reconstruction during 3D image-based treatment planning discussed the use of CT imaging and autoradiographs to define the path of an HDR brachytherapy source [9]. Ideally in brachytherapy, clinics would directly image the source within the patient’s applicator for dose determination in the treatment planning system (TPS). Since it is not feasible to image the radioactive source in this way prior to fraction delivery, clinics rely on indirect catheter reconstruction methods that have been validated against the true source position [14,15]. Film measurements and 2D radiographs are commonly used during applicator commissioning to assess source position relative to a dummy wire or a model-based source path [5,6,16].
In this work, reconstruction methods were studied for the lunar ovoid channels of the VeneziaTM applicator. The Flexitron® source position simulator (SPS) was used as a surrogate for the true 192Ir source, and several catheter reconstruction techniques were compared against the SPS in order to investigate positional accuracy and the impact on calculated dose distributions. To validate the use of the SPS as a surrogate for the radioactive source, CT scans with the SPS were compared against the position of the true source as measured by radiochromic film. Additionally, the repeatability of SPS positioning was assessed using repeat CT scans. Four distinct catheter reconstruction methods were assessed: automatic centerline reconstruction, manual tracing a CT dummy wire positioned at the most distal dwell position, automatic reconstruction using the manufacturer’s built-in applicator model with a realistic source path, and reconstruction using the non-radioactive source of the SPS at each planning dwell position. Maximal dose differences for a given volume in tissue were analyzed along with changes to DVH parameters for clinically delivered plans. Enhanced accuracy in planned dose distributions with the VeneziaTM applicator could lead to improved understanding of clinical studies and dose limits, especially for vaginal mucosa morbidities such as fibrosis or vaginal stenosis [11,17].
Material and methods
CT imaging
Scans were performed using a SOMATOM Definition Edge CT scanner (Siemens, Germany) with a slice thickness of 0.6 mm and a square pixel dimension of 0.39 mm. Three available lunar ovoid sizes (22, 26, and 30 mm effective diameter) for the VeneziaTM applicator were evaluated. For combinations of ovoid size and reconstruction method, a single representative CT scan was acquired except for the SPS reconstruction where multiple scans were performed at select dwell positions. Scans were acquired with a stranded CT dummy wire featuring metal seeds separated by 1 cm. Also, scans were completed with the Flexitron® SPS positioned at step sizes of 5 mm from the most distal dwell position of the ovoid channel (Figure 2). In each case, the applicator was fixed upon an air-equivalent foam block centered in the CT bore. Assembled ovoids were positioned in approximately the same orientation used during patient treatments. Additionally, iterative metal artifact reduction was applied during reconstruction. Following institutional planning processes, images were registered in MIM® software (MIM Software Inc., USA). Contours were created in MIM® to define each lunar ovoid and channel, the CT dummy wire, and the SPS source at each planning dwell position. The contour set for each applicator size was exported to the Oncentra® Brachy planning system (version 4.5.3; Nucletron, an Elekta company, Sweden) to generate treatments plans based on different source path reconstruction techniques.
SPS source location
With a cable composition replicating that of the Flexitron® afterloader source, the SPS device from Elekta is often used clinically as a surrogate to determine the most distal dwell position in a treatment applicator including the transfer tube. In order to assess reproducibility in positioning the SPS source within the VeneziaTM applicator, five CT scans were repeated with the SPS located at the most distal ovoid dwell position (index of 1300 mm) as well as more proximal dwell positions with indices of 1290 mm and 1280 mm. These dwell positions were chosen to span much of the usable treatment region. The SPS device was completely removed from the applicator between image acquisitions. Using the centroid of the SPS source contoured on registered CT images, average and maximum differences were calculated in 3D space for the selected nominal dwell locations.
Coincidence between the SPS source and the 192Ir source afterloader was previously confirmed within 1 mm during afterloader commissioning using a calibrated check ruler. In order to verify the assumption that positioning of the SPS source within the VeneziaTM applicator represents the expected path of the radioactive source during patient treatments, measurements were made using GAFChromicTM EBT3 film (Ashland Inc., USA) with the Flexitron® source at different dwell positions within each lunar ovoid size. Before each irradiation to approximately 2 Gy, marks were made on the film to outline the ovoid dimensions, including pinpricks made through the interstitial needle guide holes of the applicator (Figure 3). Two films were irradiated for each chosen dwell position with the most distal location at a treatment length of 1300 mm. An EPSON Expression® 10000XL flatbed scanner (USA) was used during film readout with a resolution of 300 DPI. Using the public domain software ImageJ (version 1.52a), the maximum intensity in the red color channel was found for each dose map using built-in thresholding tools. By registering the film to CT images of the split-ring plane using marked reference points, the distance was calculated between the radioactive source position on film and the centroid of the SPS on CT.
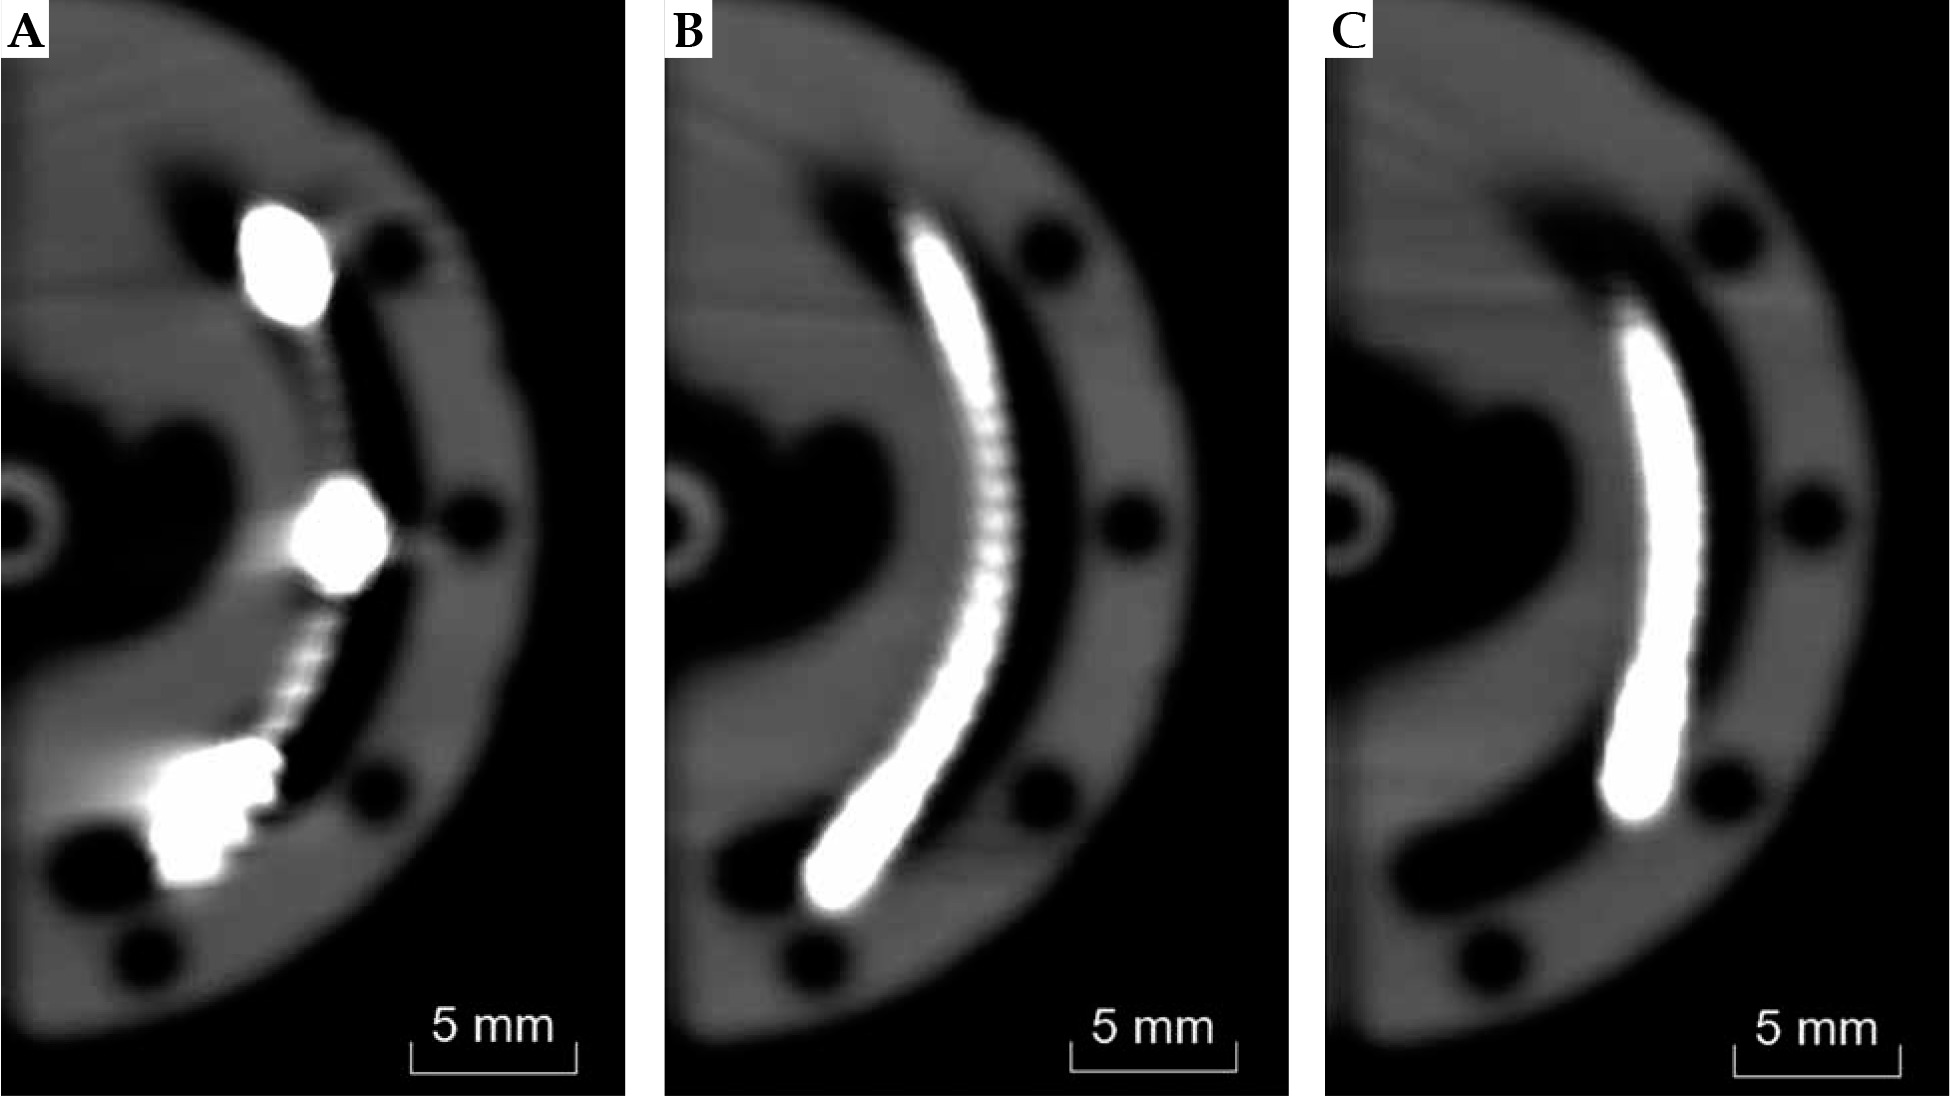
Fig. 3
Comparison of Flexitron® 192Ir source position (×) found from film measurements and SPS source position (○) found from CT imaging for dwell positions (A) 1300 mm, (B) 1290 mm, and (C) 1280 mm within the 26 mm lunar ovoid. An outline of the Venezia applicator is overlaid for visualization purposes
Catheter reconstruction
Treatment plans were generated in Oncentra® utilizing four distinct catheter reconstruction techniques. Automatic catheter reconstruction was performed with a 3D model of the VeneziaTM applicator generated in version 1.0.1.1 of applicator library manager (Nucletron, an Elekta company, Sweden). In Oncentra®, the applicator model was overlaid on the CT planning images and manually aligned. As part of the built-in model, reconstruction for each lunar ovoid was performed automatically with the source path placed either at the channel centerline (“centerline”) or along a measured source path provided by Elekta (“manufacturer’s model”). Additionally, manual reconstruction with the CT dummy wire was performed in Oncentra® by tracing the seeded metal wire appearing in each CT scan. Finally, ovoid channel reconstruction was performed using the contours obtained from CT scans with the Flexitron® SPS at 5 mm step sizes from the most distal dwell position. The average centroid position was used for treatment lengths of 1300 mm, 1290 mm, and 1280 mm where five successive CT scans were taken. Dwell positions were transferred from MIM® to Oncentra® on the same planning images using small point-like ROIs to denote the SPS source position. In order for TG-43 anisotropy corrections to be appropriately applied in Oncentra®, source orientation was established using two channel reconstruction points for each planning dwell position: one point at the SPS source centroid and another at the proximal end of the source [18,19]. Source path differences were visualized with a custom MATLAB® (MathWorks®, USA) script to plot the centroid of applicator contours drawn on registered CT images. To assess positional agreement between reconstruction techniques, distances between corresponding dwell positions were calculated using the built-in measurement tool within Oncentra®. An uncertainty budget was formulated for the comparison of dwell positions from different catheter reconstruction techniques relative to the SPS source.
Local dose comparison
22 mm, 26 mm, and 30 mm lunar ovoids were loaded in Oncentra® using 5, 6, and 7 dwell positions, respectively, at step sizes of 5 mm from the most distal dwell position. A constant dwell time was used for all dwell positions such that the 125% isodose line fell approximately at the outer surface of the lunar ovoid in accordance with institutional practice. Following dose calculations for a single ovoid performed in Oncentra® using 1 mm dose grid voxels, dose differences were assessed in MIM® registration software. For each ovoid size, the SPS-based treatment plan was taken as the reference dose distribution. In order to quantify changes in the planned dose distribution surrounding the ovoid, tissue volumes with dose differences exceeding ±5% and ±10% of the prescription dose (DRx) were evaluated for each applicator size. Additionally, maximal values from a dose difference map were calculated for volumes of 0.1 cm3, 1.0 cm3, and 2.0 cm3 outside the applicator. These parameters were chosen in order to assess any dose profile differences across various reconstruction techniques that could be clinically relevant in the assessment of vaginal mucosa morbidities [11].
Clinical plans
To further contextualize the analysis of dose differences surrounding a single ovoid, catheter reconstruction effects were evaluated for two cervical cancer patients treated using the VeneziaTM applicator and a Flexitron® afterloader. The case study was considered exempt by an institutional review board (IRB). One clinical plan utilized 22 mm diameter lunar ovoids along with a 70 mm tandem at a 15° applicator angle (75° from the split-ring plane) without any interstitial needles to a prescription dose of 5.5 Gy, while the other plan used 22 mm diameter lunar ovoids with a 60 mm tandem at a 30° applicator angle (perpendicular to the split-ring plane) with six interstitial needles placed parallel to the tandem to a prescription dose of 7.0 Gy. For the 22 mm ovoid, 5 dwell positions were available for loading, with step sizes of 5 mm from the distal end at 1300 mm. At the time of treatment, ovoid reconstruction was performed by tracing a dummy wire in situ on CT images, while plans utilizing centerline reconstruction, manufacturer’s model, and SPS dwell positions were generated retrospectively. To evaluate each plan, DVH parameters were used for various regions of interest (ROIs) contoured by a radiation oncologist at the time of treatment according to GEC-ESTRO guidelines [20,21]. Coverage of the HR-CTV was assessed using the minimum dose Dmin as well as D90% [21]. D2cm3 values were evaluated for the following OARs: bladder, bowel, rectum, and sigmoid. The volume encompassed by the 200% isodose line was also recorded. Vaginal dose was quantified retrospectively using anatomical points defined for gynecological brachytherapy treatments [22,23]. Specifically, a reference point was evaluated at the level of posterior-inferior border of symphysis (PIBS) intersecting the applicator tandem. Points ±2 cm from the PIBS along the tandem-axis were established to represent the middle and lower vagina. Additionally, vaginal dose was calculated within the split-ring plane at the applicator surface and at a tissue depth of 5 mm for four angles separated by 90°.
Results
Table 1 presents positional differences between repeat CT scans with the SPS source and each VeneziaTM lunar ovoid size. The maximum deviation was ≤ 0.6 mm, while the average disagreement was between 0.1-0.3 mm for the selected dwell positions. Figure 3 shows a comparison of the 192Ir source position based on radiochromic film measurements and the SPS source location in the split-ring plane from CT imaging. Positional agreement between the radioactive source and the SPS is summarized in Table 2. For the dwell positions tested with each ovoid size, the average spatial disagreement in the split-ring plane was between 0.2-0.6 mm. Based on the observed agreement, the SPS source was utilized in this work as a surrogate for the Flexitron® 192Ir source. By using CT images of the SPS, the 3D location and the angle of the source within the ovoid channel was modeled in the TPS as opposed to the use of film projections which did not convey out-of-plane positional differences or source orientation. An uncertainty budget is presented in Table 3 for the comparison of dwell positions from different catheter reconstruction techniques relative to the SPS source. Type A uncertainties were taken from average differences across dwell positions found in Tables 1 and 2. Type B uncertainty for comparative reconstruction techniques (centerline, CT wire, and manufacturer’s model) was assumed to be the same as re-positioning the SPS device assessed through repeat CT scans. Additionally, Type B uncertainty was attributed to the registration of separate CT sequences when comparing dwell positions between reconstruction techniques. In this work with the rigid VeneziaTM applicator, the registration accuracy was limited mainly by voxel size. The combined uncertainty is expected to be ±0.5 mm (k = 1) when comparing dwell positions between reconstruction techniques.
Table 1
Positional repeatability based on five CT scans, with the SPS source at each chosen dwell position for the VeneziaTM lunar ovoids. 1300 mm represents the most distal treatment dwell position
Table 2
Flexitron® 192Ir source position on radiochromic film versus SPS centroid in the split-ring plane from CT scans of the VeneziaTM lunar ovoids. Positive values denote that the 192Ir source is more distal than the SPS
Table 3
Uncertainty budget for the comparison of dwell positions from different catheter reconstruction techniques relative to the SPS source for the VeneziaTM lunar ovoids, including Type A uncertainty terms based on repeated measurements and Type B uncertainty based on corresponding data
Figure 4 provides a comparison of the manufacturer’s source path, channel centerline, the non-radioactive SPS source at each planning dwell position, and the CT dummy wire shown in each CT scan. Table 4 presents differences in the most distal dwell position relative to the SPS source, where “underestimate” refers to a shorter treatment length. Automatic reconstruction using the manufacturer’s model was found to give the smallest disagreement on average with an underestimate of 0.3-0.9 mm across applicator sizes. Centerline reconstruction underestimated the treatment length at the most distal position by 0.8-1.5 mm, while reconstruction with the CT dummy wire overestimated this position by 0.2-1.6 mm across applicator sizes. Table 4 also reports average distance deviations for all planning dwell positions relative to the SPS. The manufacturer’s model again showed the closest positional agreement at 0.7-1.0 mm for all ovoid sizes.
Table 4
Differences in the most distal dwell position and average positional differences for all planning dwell positions with catheter reconstruction techniques relative to the SPS source for three VeneziaTM lunar ovoid sizes
| 22 mm | 26 mm | 30 mm | ||||
|---|---|---|---|---|---|---|
| Distal (mm) | All dwells (mm) | Distal (mm) | All dwells (mm) | Distal (mm) | All dwells (mm) | |
| Centerline | –1.2 | 0.9 | –1.5 | 1.3 | –0.8 | 1.4 |
| CT wire | 0.2 | 1.0 | 1.6 | 1.5 | 1.2 | 1.1 |
| Manufacturer’s model | –0.9 | 0.7 | –0.6 | 0.8 | –0.3 | 1.0 |
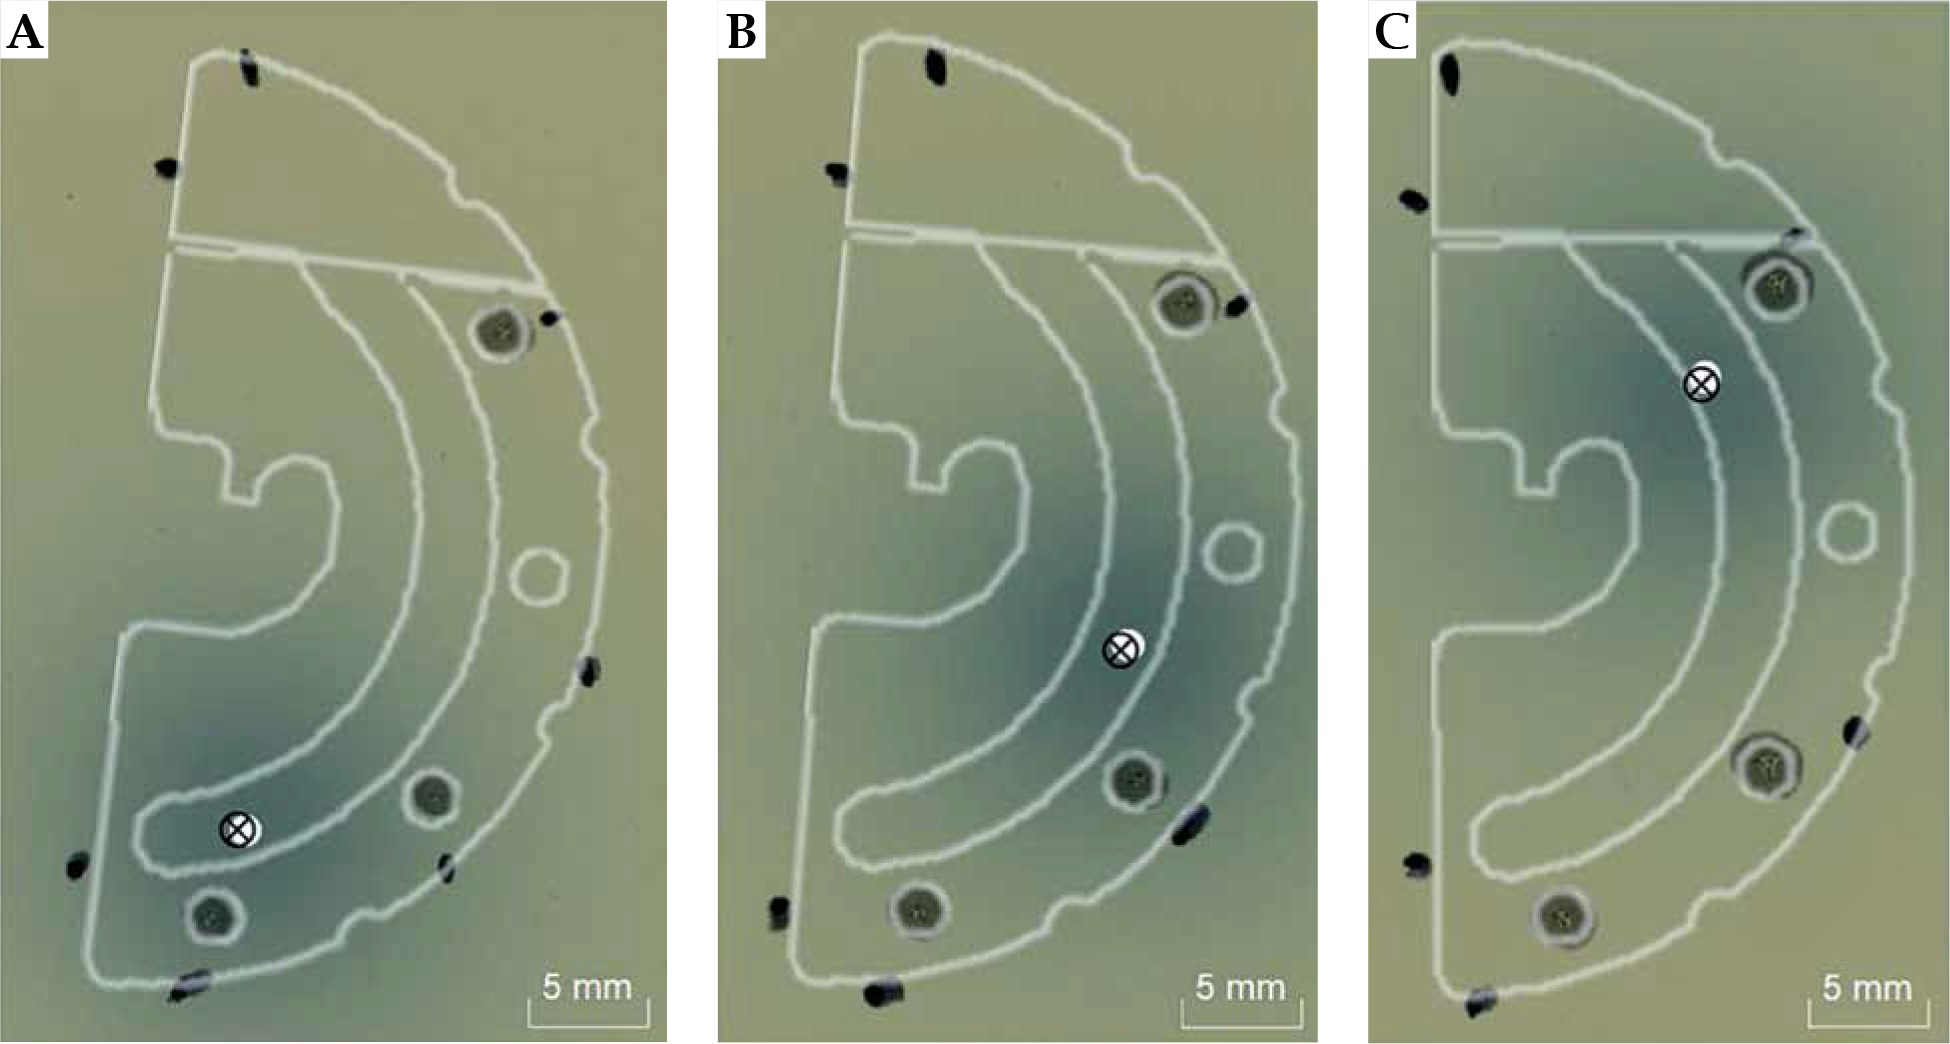
Fig. 4
Comparison of SPS locations (Δ), the source path from the manufacturer’s model (●), and channel centerline (—), where × denotes planning dwell positions for a given reconstruction method. Images are shown with the CT dummy wire for (A) 22 mm, (B) 26 mm, and (C) 30 mm lunar ovoid sizes
Dose differences arising from the choice of reconstruction technique were first analyzed for a single ovoid channel of the VeneziaTM applicator relative to the SPS-based plan (Figure 5). Dose surrounding the applicator was found to be consistently overestimated near the entrance of the ovoid channel and underestimated near the distal end when reconstructing the lunar ovoid using either channel centerline or the CT dummy wire. This trend is less apparent when utilizing automatic catheter reconstruction in Oncentra® with the manufacturer’s model. For all reconstruction methods, local dose differences exceeding ±10% of the prescription dose were observed primarily for small volumes near the ovoid surface.
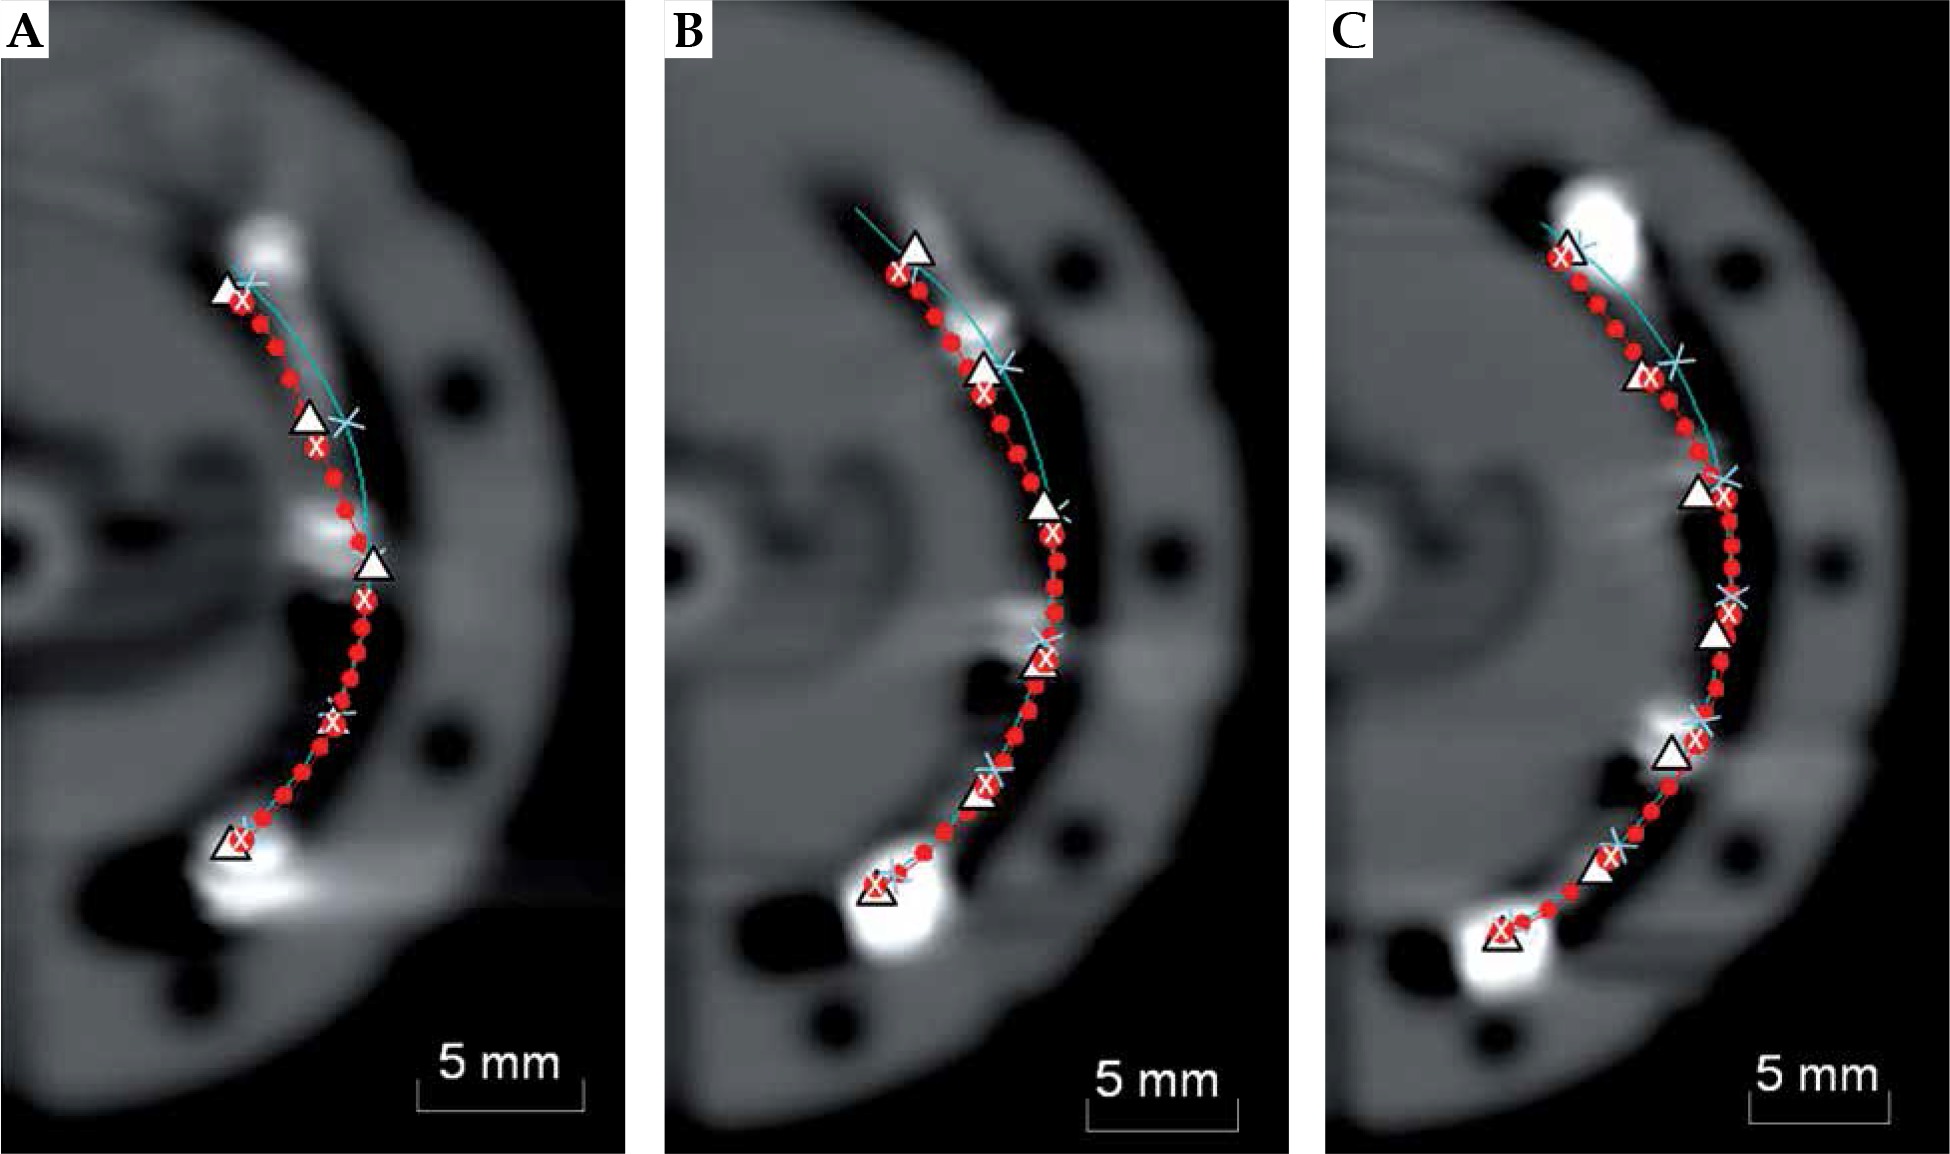
Fig. 5
Dose difference maps for catheter reconstruction using channel centerline, CT dummy wire, and manufacturer’s model relative to the dose distribution based on SPS locations in this work. Dose differences for a single ovoid are presented as a percentage of prescription dose
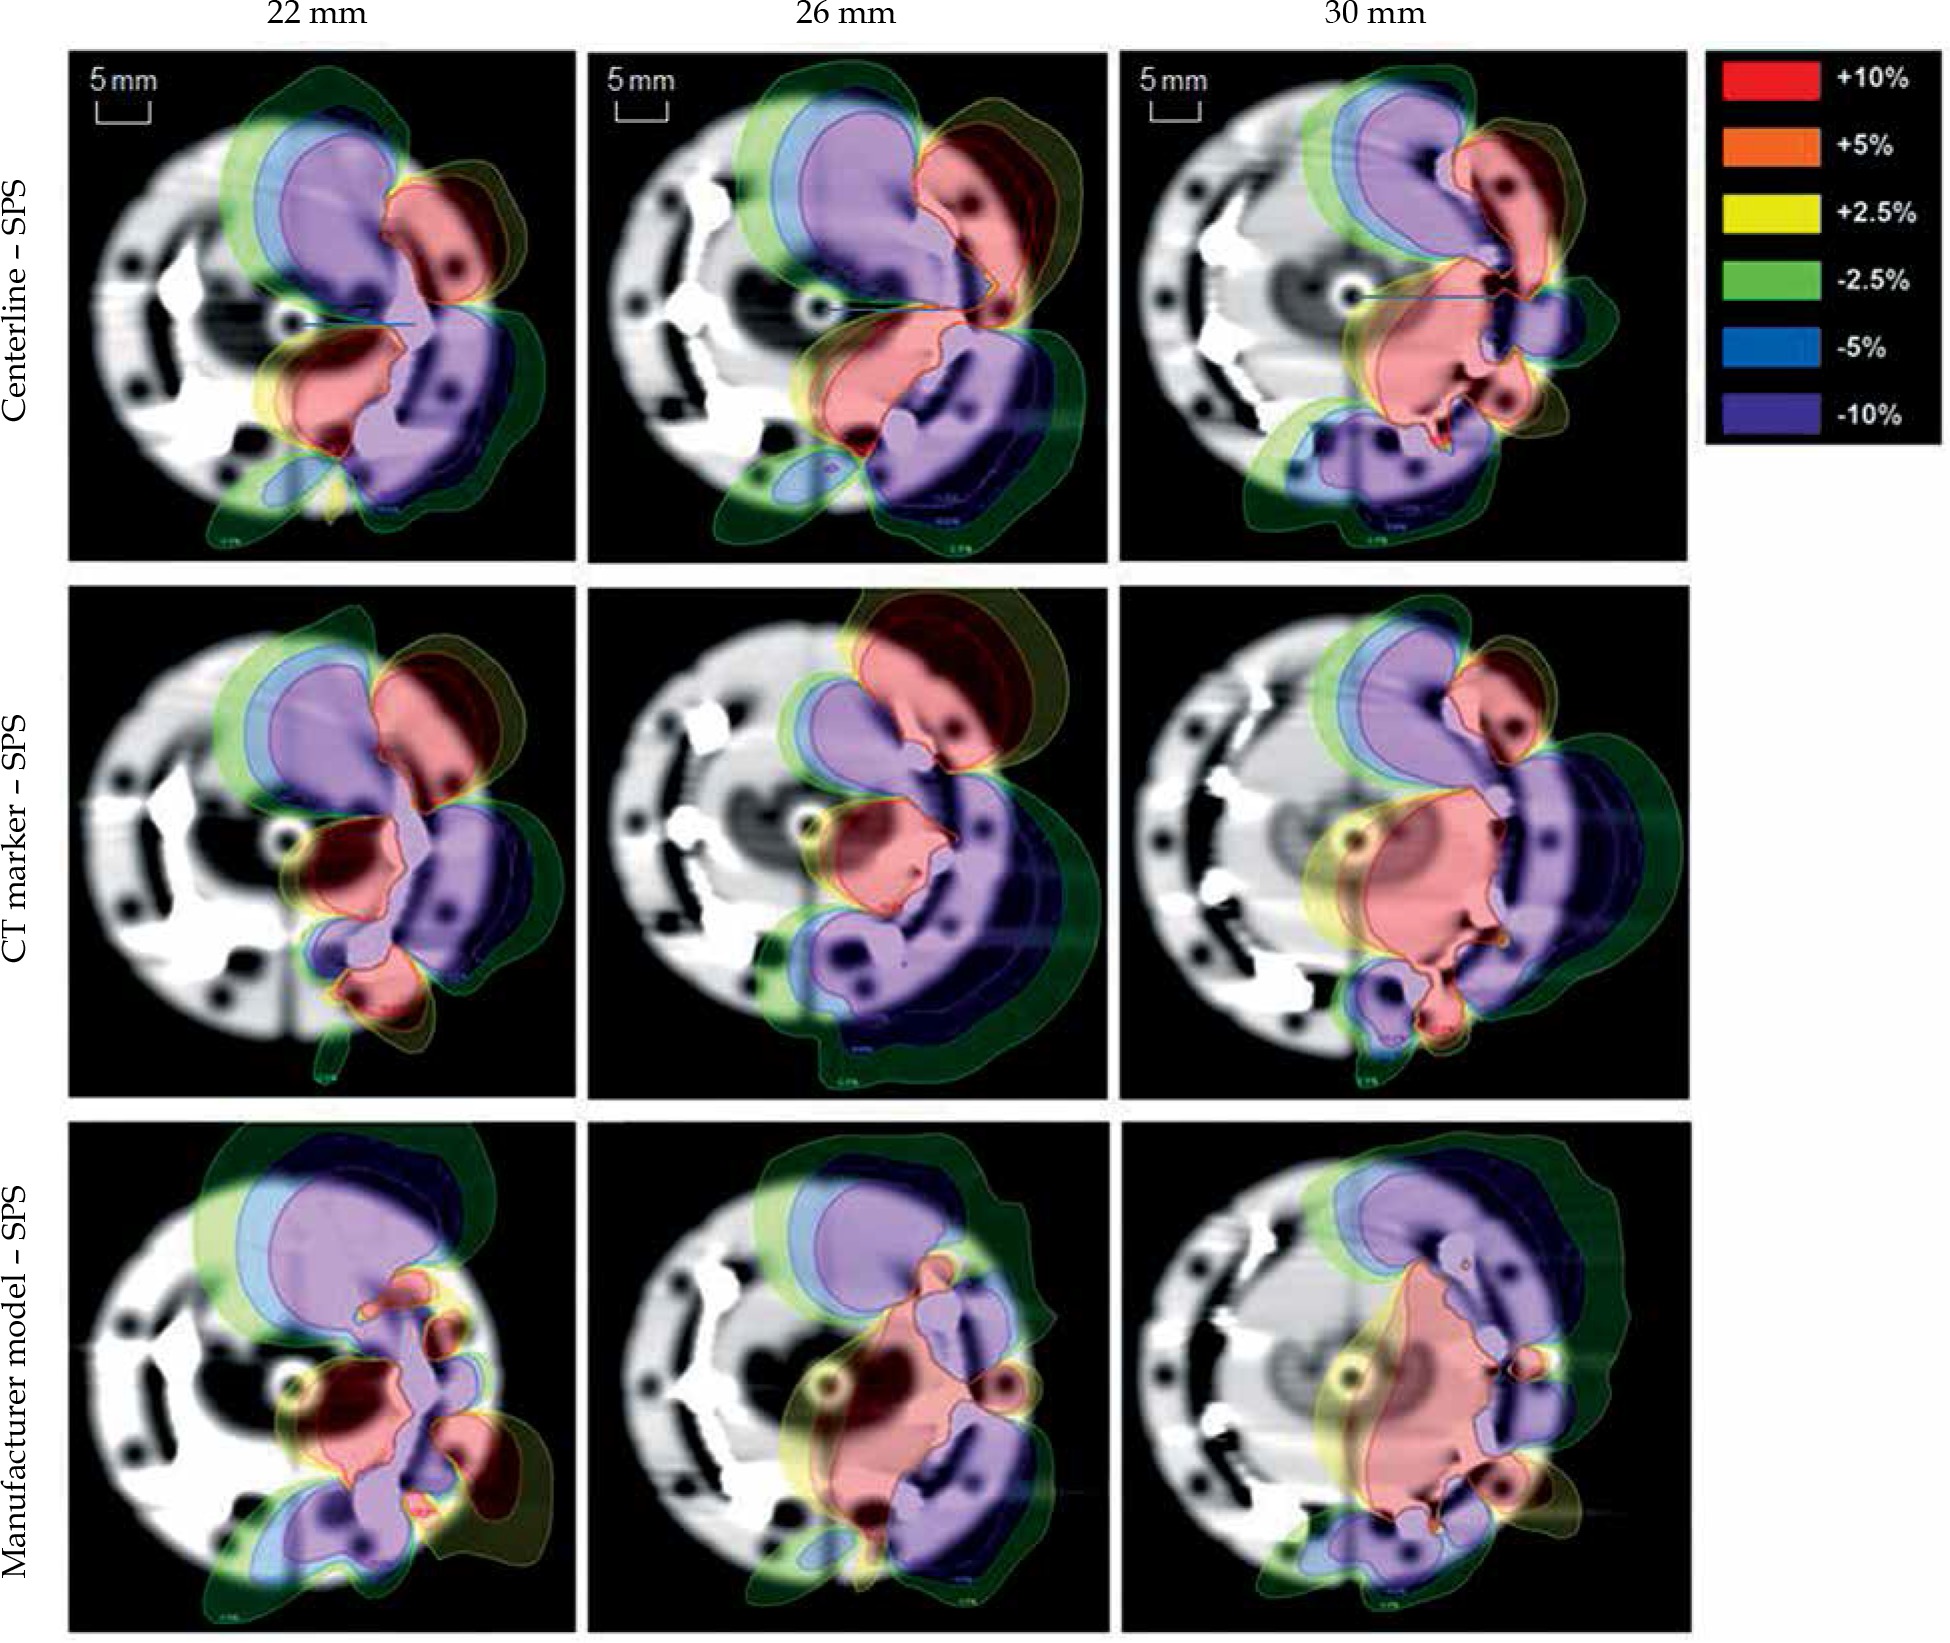
Table 5 presents tissue volumes with dose differences exceeding ±5% and ±10% of the prescription dose compared to the SPS-based treatment plan, and the best agreement was seen using catheter reconstruction with the manufacturer’s model. Across ovoid sizes, dose was overestimated by at least +10% of DRx for a volume of 0.33-2.03 cm3 for centerline reconstruction, 0.62-1.67 cm3 with manual reconstruction using the CT dummy wire, and 0.33-0.80 cm3 using automatic reconstruction with the manufacturer’s source path. An underestimate of tissue dose by at least –10% occurred for 0.71-2.50 cm3 with centerline reconstruction, 0.27-1.54 cm3 tracing the CT dummy wire, and 0.21-0.67 cm3 using the manufacturer’s model. While the smallest observed volume for each reconstruction technique was associated with the 22 mm ovoid, the recorded volumes were not found to monotonically increase with applicator size.
Table 5
Tissue volumes with dose differences exceeding ±5% and ±10% of the prescription dose using different catheter reconstruction techniques relative to the SPS-based plan with three VeneziaTM lunar ovoid sizes
Table 6 shows maximal dose differences for volumes of 0.1 cm3, 1.0 cm3, or 2.0 cm3 outside the applicator. Maximal dose differences relative to the SPS treatment plan were once again consistently smaller using the manufacturer’s source model. Dose differences for 0.1 cm3 of tissue were between 19-37% of DRx for centerline reconstruction, 28-39% for manual reconstruction with the CT dummy wire, and 16-28% using automatic reconstruction with the manufacturer’s model.
Table 6
Maximal dose differences for tissue volumes of 0.1 cm3, 1.0 cm3, and 2.0 cm3 given as a percentage of the prescription dose using different catheter reconstruction techniques relative to the SPS-based plan with three VeneziaTM lunar ovoid sizes
Catheter reconstruction effects with the VeneziaTM applicator were also studied for two patient plans both with and without interstitial needles. Table 7 reports on clinically-used DVH parameters Dmin and D90% for the HR-CTV, along with D2cm3 for the bladder, bowel, rectum, and sigmoid. Differences in V200% are also presented for each plan. Changes in vaginal dose are given based on the PIBS point defined previously along with Dsurf and D5mm values. For each parameter, differences are reported relative to the SPS-based dose distribution. The largest discrepancy across reconstruction techniques was 5.3% seen for the voxel-based quantity Dmin of the HR-CTV using centerline reconstruction. The largest deviation amongst volume-based DVH quantities was 3.9% seen for V200% using centerline reconstruction. Primarily, due to ROI proximity to the applicator, the change in D2cm3 was largest for the sigmoid with a maximum difference of 3.6% compared to the remaining OARs with differences in D2cm3 ≤ 2.8%.
Table 7
Differences in DVH parameters for different catheter reconstruction techniques relative to the SPS- based plan for clinical VeneziaTM plans without interstitial needles (P1) and with interstitial needles (P2)
Discussion
For each applicator size, the SPS source was found to travel along the inner wall of the applicator channel upon entering the ovoid before travelling more closely to the outer wall near the distal end (Figure 4). This tendency for the source to be guided along the incident channel wall agrees with previous observations for full-ring channels [3,4,5]. In the lunar ovoid entrance region, the SPS dwell positions were better represented by the manufacturer’s model compared to using the CT dummy wire or channel centerline. Near the distal end, all reconstruction techniques conformed relatively well in shape with the SPS path although with a consistent shift between dwell positions along the source path direction. From Table 4, distance differences ≤ 1.6 mm seen in this work relative to the SPS were smaller than corresponding values for full-ring applicators reported as 2.0-4.5 mm for the most distal dwell position and 3.2-4.5 mm on average for planning dwell positions [6]. This is most likely due to the fact that the source travels through a longer curved path in a full-ring applicator compared to the VeneziaTM lunar ovoids for the same effective applicator radius. For automatic reconstruction techniques using either channel centerline or the manufacturer’s model, a trend was observed where the average disagreement between dwell positions relative to the SPS increased with the effective lunar ovoid radius. Nevertheless, given the small position discrepancies seen for the VeneziaTM applicator for all ovoid sizes, it does not appear necessary to apply a manual shift in the source path radius to account for channel curvature as has been done for TR applicators [6]. In particular, the built-in manufacturer’s model showed positional agreement with the SPS benchmark that was within the accepted daily tolerance for source positioning of < 1 mm. This tolerance is given in the 1D direction of source travel, so it does not even include 3D translations that were evaluated in this work through CT imaging. Based on institutional experience with QA measurements using the Flexitron® afterloader, the positional repeatability of 192Ir source in a check ruler is typically within ±0.5 mm. Therefore, dose distributions from this work using the SPS as a reference should be considered prone to uncertainties on the order of 2.5-6% within distances of 1-3 cm from a single 192Ir source position [9]. Furthermore, it is important to note that dose differences that arise between reconstruction techniques are due to differences in dwell location and source orientation, so the significance of continuous source path deviations will depend on the spacing of dwell positions and associated dwell times for a given treatment plan.
Maximal dose differences given in Table 6 relative to the SPS-based plan compared closely with published values for a conventional TR applicator showing a 25% change in surface dose for a 1 mm change in source position [11]. For all combinations of applicator size and reconstruction technique evaluated in this work, maximal dose differences were found to decrease at larger tissue volumes indicating that dose differences associated with the choice of reconstruction technique were local. In all cases dose differences were ≤ 9.1% of DRx when evaluating 2.0 cm3 of tissue volume. This trend agreed with previous findings for full-ring applicators where smaller dose uncertainties were associated with D2cm3 values compared to using D0.1cm3 to evaluate vaginal dose [11].
For the clinical gynecological plans evaluated in this work, it was hypothesized that the choice of ovoid reconstruction technique would have less impact on the overall dose profile for a VeneziaTM plan with interstitial needles that would “wash out” local dose differences. This effect was not readily apparent, however, with similar deviations seen for both the P1 and P2 plans shown in Table 7. This is likely due to the lower weighting of dwell times assigned to interstitial needles as a part of our institutional planning approach. Variations found in this work for the VeneziaTM applicator were in general agreement with DVH parameter changes reported in literature as < 1% per mm for dwell position changes within the ring channel of a standard TR applicator [6,10]. In terms of overall uncertainty in the brachytherapy planning and delivery process, greater dose uncertainty would more likely be introduced by inter-observer contouring uncertainties and organ motion than the choice of reconstruction technique [9].
For the retrospective assessment of vaginal dose in clinical plans, it was expected that dose at the applicator surface would be prone to larger deviations compared to dose at 5 mm depth in tissue due to steep dose fall-off very near the source [22]. For values reported in Table 7, the maximum deviation relative to the SPS plan was 4.8% for Dsurf compared to 3.6% for D5mm both for centerline reconstruction. Notably, large local dose differences > 10% shown in Tables 5 and 6 were not as apparent when using average dose for points separated by 90° around the applicator. Differences in vaginal dose were even smaller using reference points PIBS+2 cm, PIBS, and PIBS–2 cm with a maximum deviation ≤ 2.2%. This decreased dependence on the ovoid reconstruction technique is expected as the calculation point is moved further away from the applicator with more gradual dose fall-off. It is worth noting that improved accuracy in dose reporting close to the applicator could lead to enhanced understanding of vaginal mucosal dose limits for gynecological brachytherapy to reduce late morbidities, such as fibrosis or vaginal stenosis.
Conclusions
From the CT scans performed in this work with the VeneziaTM lunar ovoids, consistent positional discrepancies were observed when comparing the Flexitron® SPS and the source paths predicted by centerline reconstruction and manual reconstruction with the CT dummy wire. In general, ovoid reconstruction using the manufacturer’s model gave the best agreement with the SPS dwell positions. Relative to SPS-based dose distributions, each reconstruction method yielded dose differences exceeding ±10% of the prescription dose near the applicator surface. These local dose discrepancies were reduced, but not eliminated, using automatic reconstruction with the manufacturer’s model. For clinical plans using the VeneziaTM applicator both with and without interstitial needles, the choice of reconstruction technique was found to have relatively limited impact on relevant DVH parameters with deviations ≤ 3.9% for finite volume ROIs and ≤ 5.3% for point metrics. For each plan parameter, the largest deviations were seen using either the centerline reconstruction or the CT dummy wire. Based on the comparison with SPS-based dose distributions in this work, it was found that the accuracy of planned dose distributions could be improved through the use of the manufacturer’s source path. In clinical practice, our institution has adopted the use of the built-in applicator model with the supplemental benefits of faster reconstruction time as well as decreased variability between users.


