
Purpose
Radiation therapy plays an important role in the treatment of cervical cancer. Intracavitary brachytherapy (BT) has shown to increase survival and local control [1] in addition to external beam radiation therapy (EBRT). Image-guided BT (IGBT) describes the incorporation of diagnostic radiology modalities into the process of BT, such as applicator insertion, treatment planning, and treatment delivery. The increased use of 3-dimensional (3D) treatment planning for cervical cancer has helped us to further improve oncological outcomes and to reduce treatment-related toxicities.
Nowadays, computed tomography (CT) and magnetic resonance imaging (MRI) are widely used in 3D BT of cervical cancer. Radiation oncologists are very familiar with the interpretation of CT-based treatment planning, which provides useful volumetric information, such as the tandem position within the uterus, the thickness of recto-vaginal septum, and the relationship between bladder/recto-sigmoid and the applicator. It can also provide an accurate delineation of organs at risk (OARs) comparing with MRI [2] and allows for optimization of dose to OARs. Additionally, it maintains parameters traditionally used in the reporting system (e.g., point A) [3]. However, it is difficult for CT to accurately identify the target volume as it cannot clearly distinguish between structures of residual gross tumor volume (GTV), cervix, uterus, and vagina. Also, CT provides a poor definition of parametrial tumor infiltration [4]. Hence, contouring may be improved by incorporating information from MRI and clinical examination [5].
MRI is superior to CT for soft tissue visualization. It enables distinction of tumor from normal cervix and uterus, and visualization of cancerous infiltration into adjacent tissues (parametria, vagina) [6]. Accurate delineation of the tumor ensures that an adequate radiation dose is prescribed to the target, leading to excellent control rates. The Group European de Curiethérapie-European Society for Therapeutic Radiology and Oncology (GEC-ESTRO) recommended MRI for target delineation in cervical BT [7]. However, various survey reports demonstrated that there was a limited availability of MRI [8,9]. Also, accurate contouring with MRI requires appropriate training and experience. Special MRI-compatible BT applicators are considerably more expensive than metallic applicators. Most institutions in China do not have MRI available for BT planning yet. The purpose of this study was to investigate the volumetric and dosimetric difference between MRI- and CT-based BT in the treatment of cervical cancer.
Material and methods
Twenty patients with cervical cancer, who were treated with EBRT and five to six fractions of high-dose-rate (HDR) BT between January 2017 and April 2018 were included in the study. This study was approved by the institutional review board (IRB) of our hospital. Each patient underwent both CT (Sensation Open-24, Siemens, Forchheim, Germany) and MRI scan (Optima MR360 1.5 T, GE Medical Systems Inc., Waukesha, WI, USA) for the first fraction of BT plan. The two scans were acquired within one hour, with the applicator (Henschke tandem, left ovoid, right ovoid) fixed to the target. This was performed through vaginal packing and the use of bladder filling and rectum preparation protocols [10]. MRI without the applicator before BT (pre-BT MRI) was also collected to be used for contouring on CT images. Note that it was used for reference only, not fused into the CT image at BT. T2-weighted sequences in the axial, coronal, and sagittal planes were acquired at 5 mm slice thickness during the MRI scan. In the next applications, CT planning was performed. The CT images for BT were generated in a 3 mm slice interval without intravenous contrast.
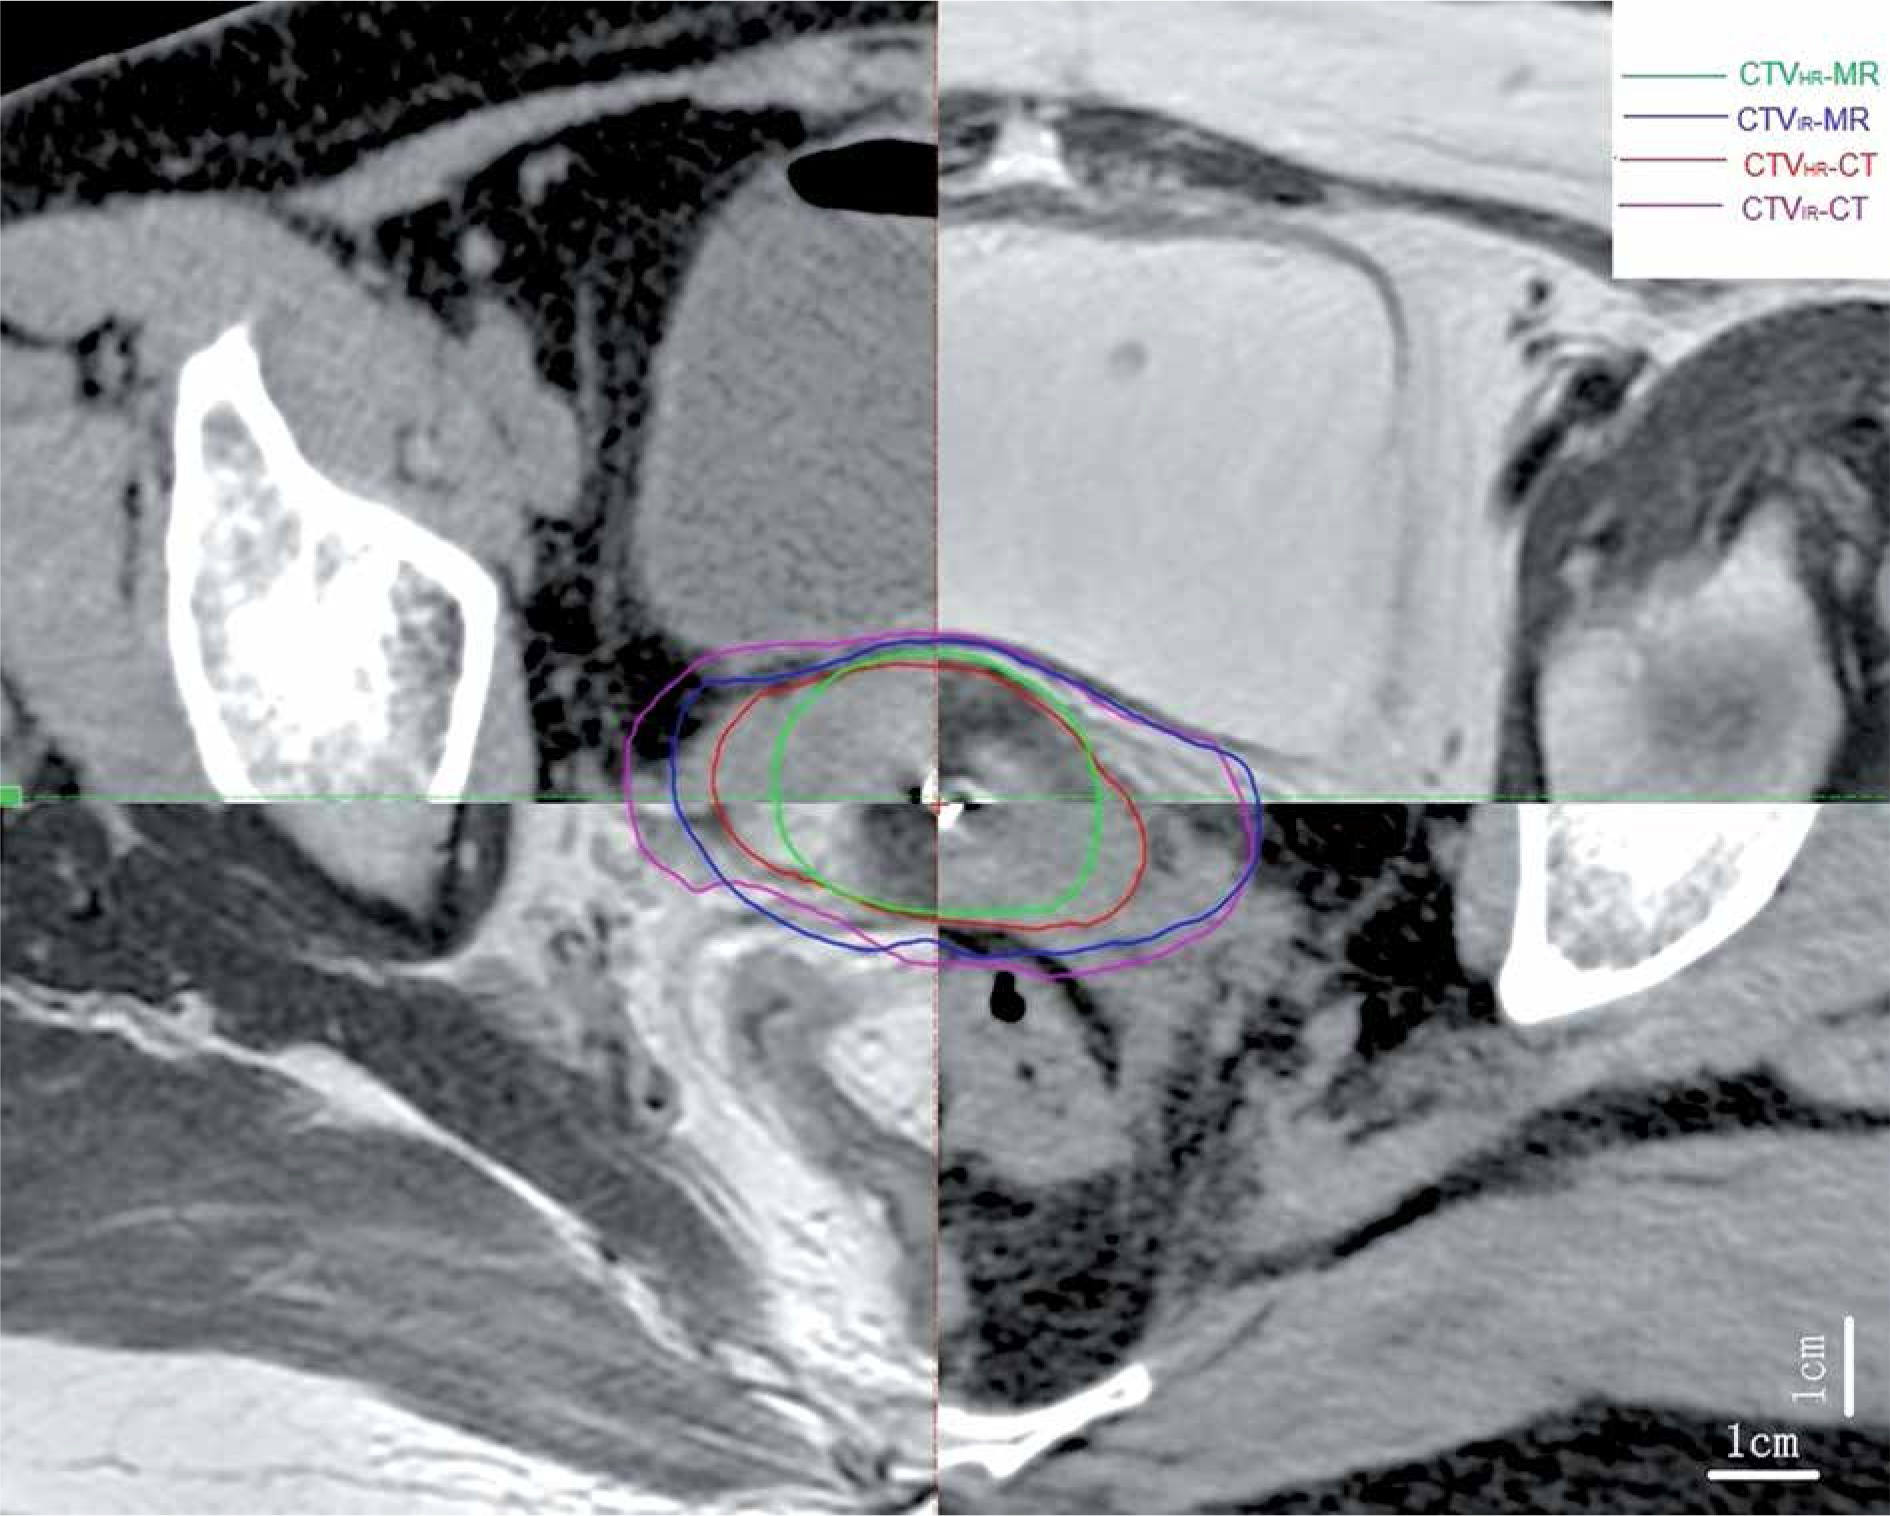
Gynecological examinations were performed before EBRT and BT, which provided the reference for subsequent target delineation and planning. The image data sets were contoured using Varian system (Eclipse 11.0) by the same radiation oncologist. The volume of high-risk clinical target volume (CTVHR) and intermediate -risk CTV (CTVIR) of MRI were identified according to GEC-ESTRO recommendations [7], while the adapted guidelines by Viswanathan et al. [11] were used for CT-based contouring. CT images were contoured before MRI. Bladder, rectum, sigmoid colon, and small intestine were also contoured. Figure 1 shows CTVHR and CTVIR both on CT and MRI of the same patient. Rigid registration results of MRI-CT images were obtained using MIM software registration tool (Maestro, version 6.7.4) to fuse the structures of the applicator on the two images. Treatment planning was done on the Varian treatment planning system (Varian planning system, Eclipse 11.0), where the DVH parameters were calculated on CT. Then, the same planning was transferred to MRI with the values recorded. Five to six sessions of BT application were planned for all patients, with a fraction size of 5-6 Gy to D90 of CTVHR per session, according to the GEC-ESTRO recommendations [7]. The total doses of EBRT and BT were summated and normalized to a 2 Gy fraction size (EQD2), using the linear-quadratic model with an α/β of 3 Gy for OARs and 10 Gy for CTVHR [12]. The planned EQD2 D90 for CTVHR was ≥ 85 Gy, while the doses to 2 cc volumes of rectum, bladder, and sigmoid were limited to ≤ 75, ≤ 85, and ≤ 75 Gy, respectively.
The dimensions, dice similarity coefficient (DSC, the overlapping parts between two target areas), Hausdorff distance (HD, the relative distance between the two points of greatest difference), centroid distance (ΔV, the deviation degree of central points of two target areas), and dose volume histograms (DVH) parameters were analyzed.
We used the MIM system to calculate the values of DSC, HD, and DV. Doses to 0.1 cc, 1 cc, and 2 cc volumes of the OARs of MRI and CT were evaluated. All MRI parameters were compared with those of CT by paired-samples t-test using SPSS version 23.0 software. The significance test was set to the level of p < 0.05.
Results
Patients and treatment characteristics
The average age of the 20 patients included was 57.8 years (range, 41-75 years old). Pathologically, all the patients were of squamous cell carcinoma, including 1 with stage IB2, 1 with stage IIA2, 13 patients with stage IIB, 3 with stage IIIA, and 2 cases with stage IIIB disease with both pelvic wall infiltration and hydronephrosis. A total dose of 45-50.4 Gy in 25-28 fractions was prescribed using 6-10 MV photons for EBRT. Tumor reduction exceeding 50% or 1 cm was observed in 19 patients at the time of BT. The first BT application was carried out in 4th week of EBRT for 15 patients, while the other 5 patients received the treatment after the completion of EBRT. The treatment was completed within 56 days for all the patients.
Comparison of dimensions and target volumes
The mean values with standard deviation for the height, maximum width, width at point A, maximum thickness, thickness at point A, and volumes of CTVHR-CT and CTVHR-MR are presented in Table 1. Two-sided paired t-tests showed that the width at point A, maximum thickness, thickness at point A, and total volumes were significantly overestimated in CTVHR-CT compared with CTVHR-MR. The height of CTVHR-CT was comparable to CTVHR-MR.
Table 1
The dimensions and volumes of CTVHR from CT and MRI
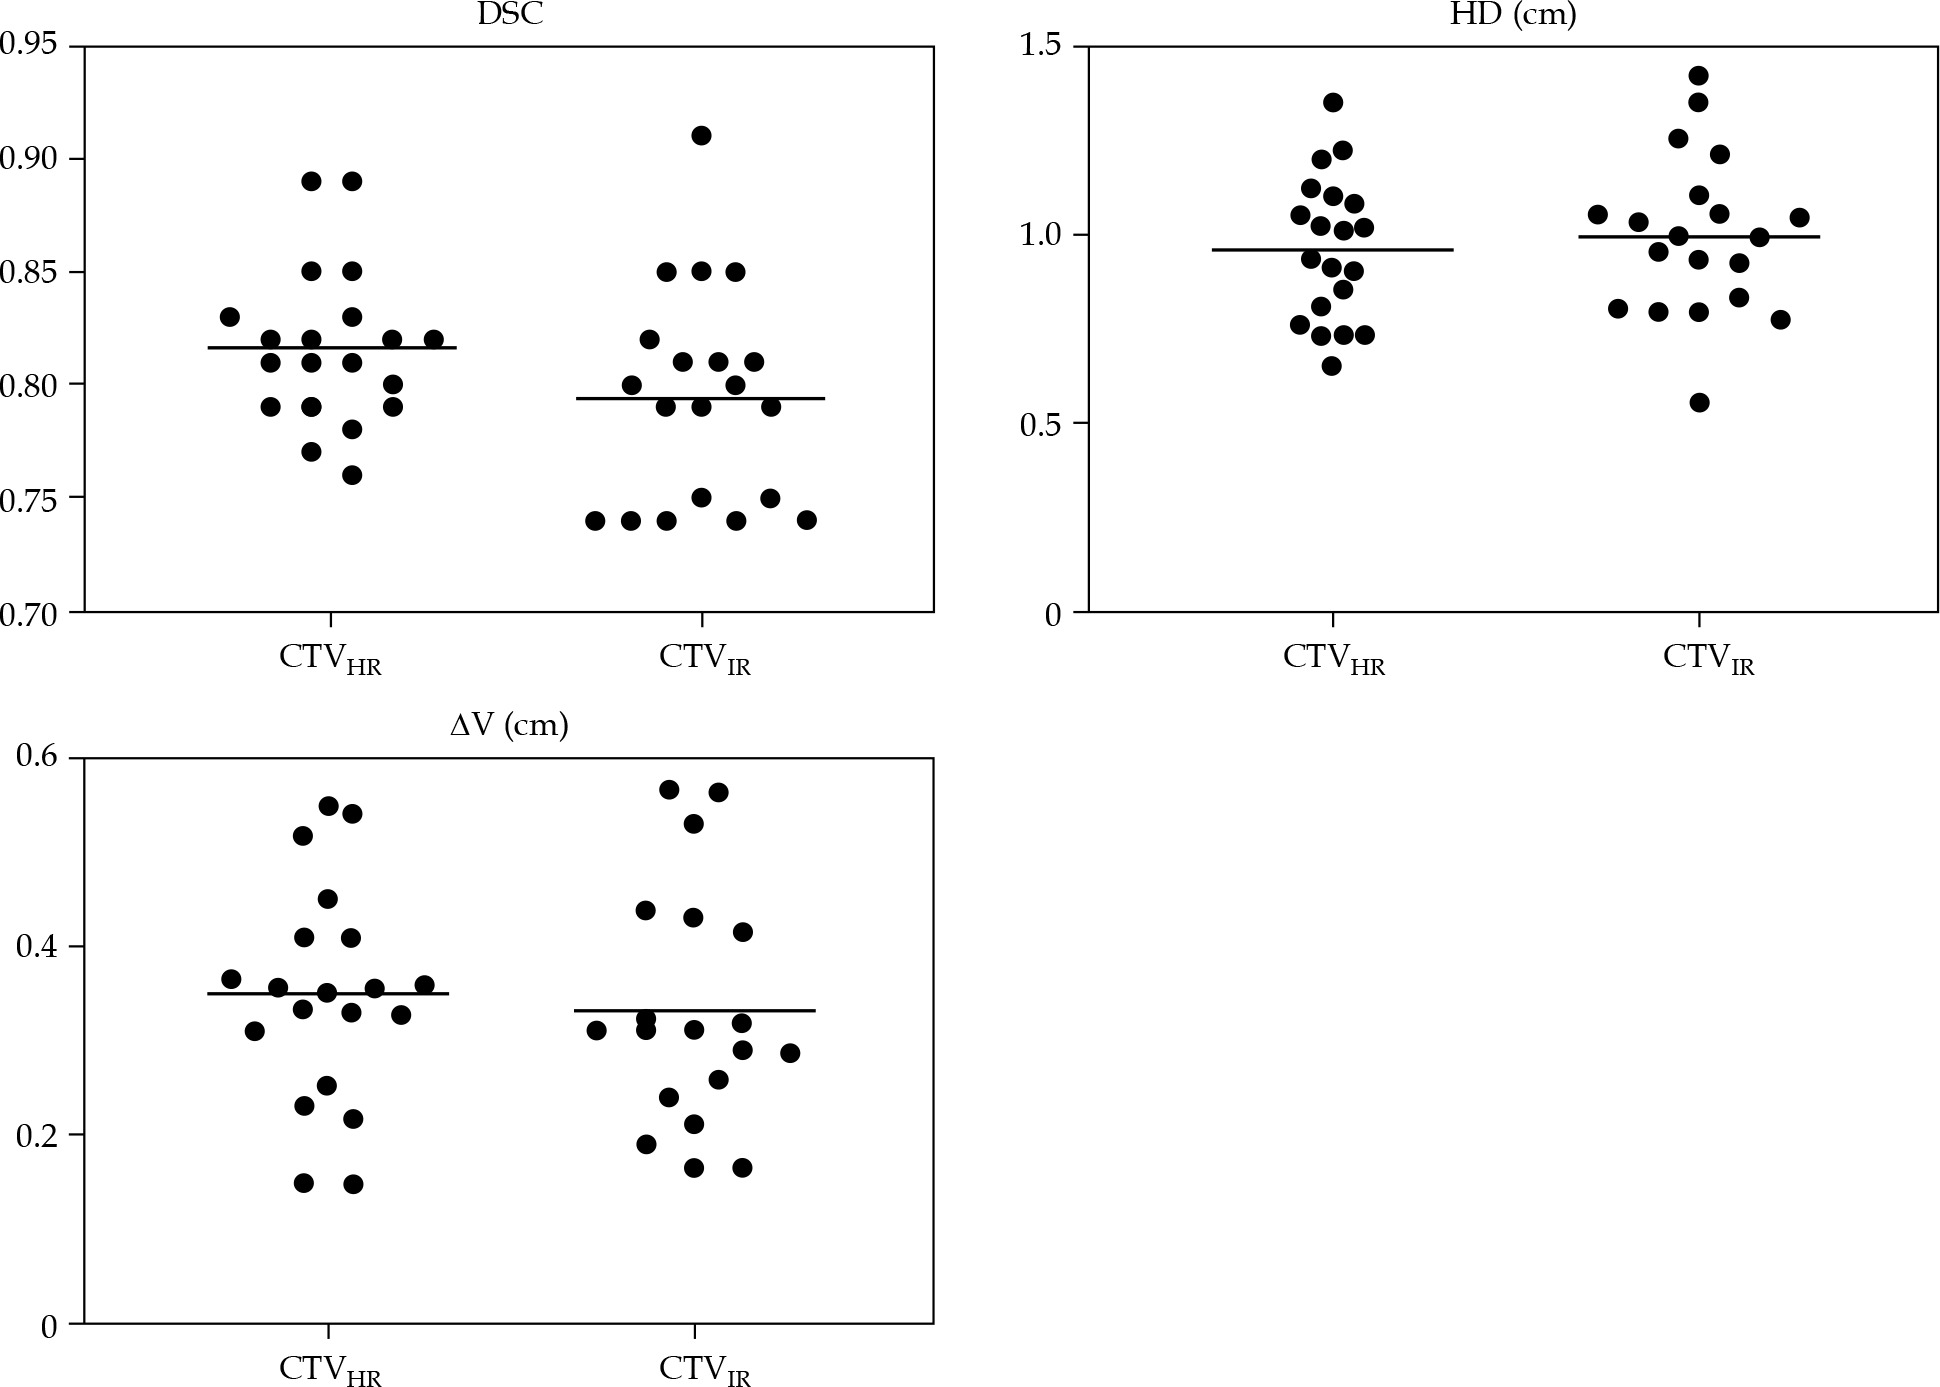
Comparison of conformal parameters of DSC, HD, and ΔV
The mean values and the range of DSC, HD, and ΔV of CTVHR and CTVIR are shown in Table 2 and Figure 2. Conformality indices of both CTVHR and CTVIR were comparable.
Comparison of dose parameters
The D98 and D90 values were significantly lower for CTVHR-CT as compared to CTVHR-MR (Table 3).
Table 3
DVH parameters of CTVHR and CTVIR from CT and MRI
| Parameters | CTVHR-CT | CTVHR-MR | P-value | CTVIR-CT | CTVIR-MR | P-value |
|---|---|---|---|---|---|---|
| D98 (Gy) | 4.43 ±0.51 | 4.82 ±0.54 | 0.030 | 2.50 ±0.38 | 2.67 ±0.38 | 0.269 |
| D90 (Gy) | 5.23 ±0.68 | 5.63 ±0.62 | 0.035 | 3.13 ±0.35 | 3.28 ±0.51 | 0.219 |
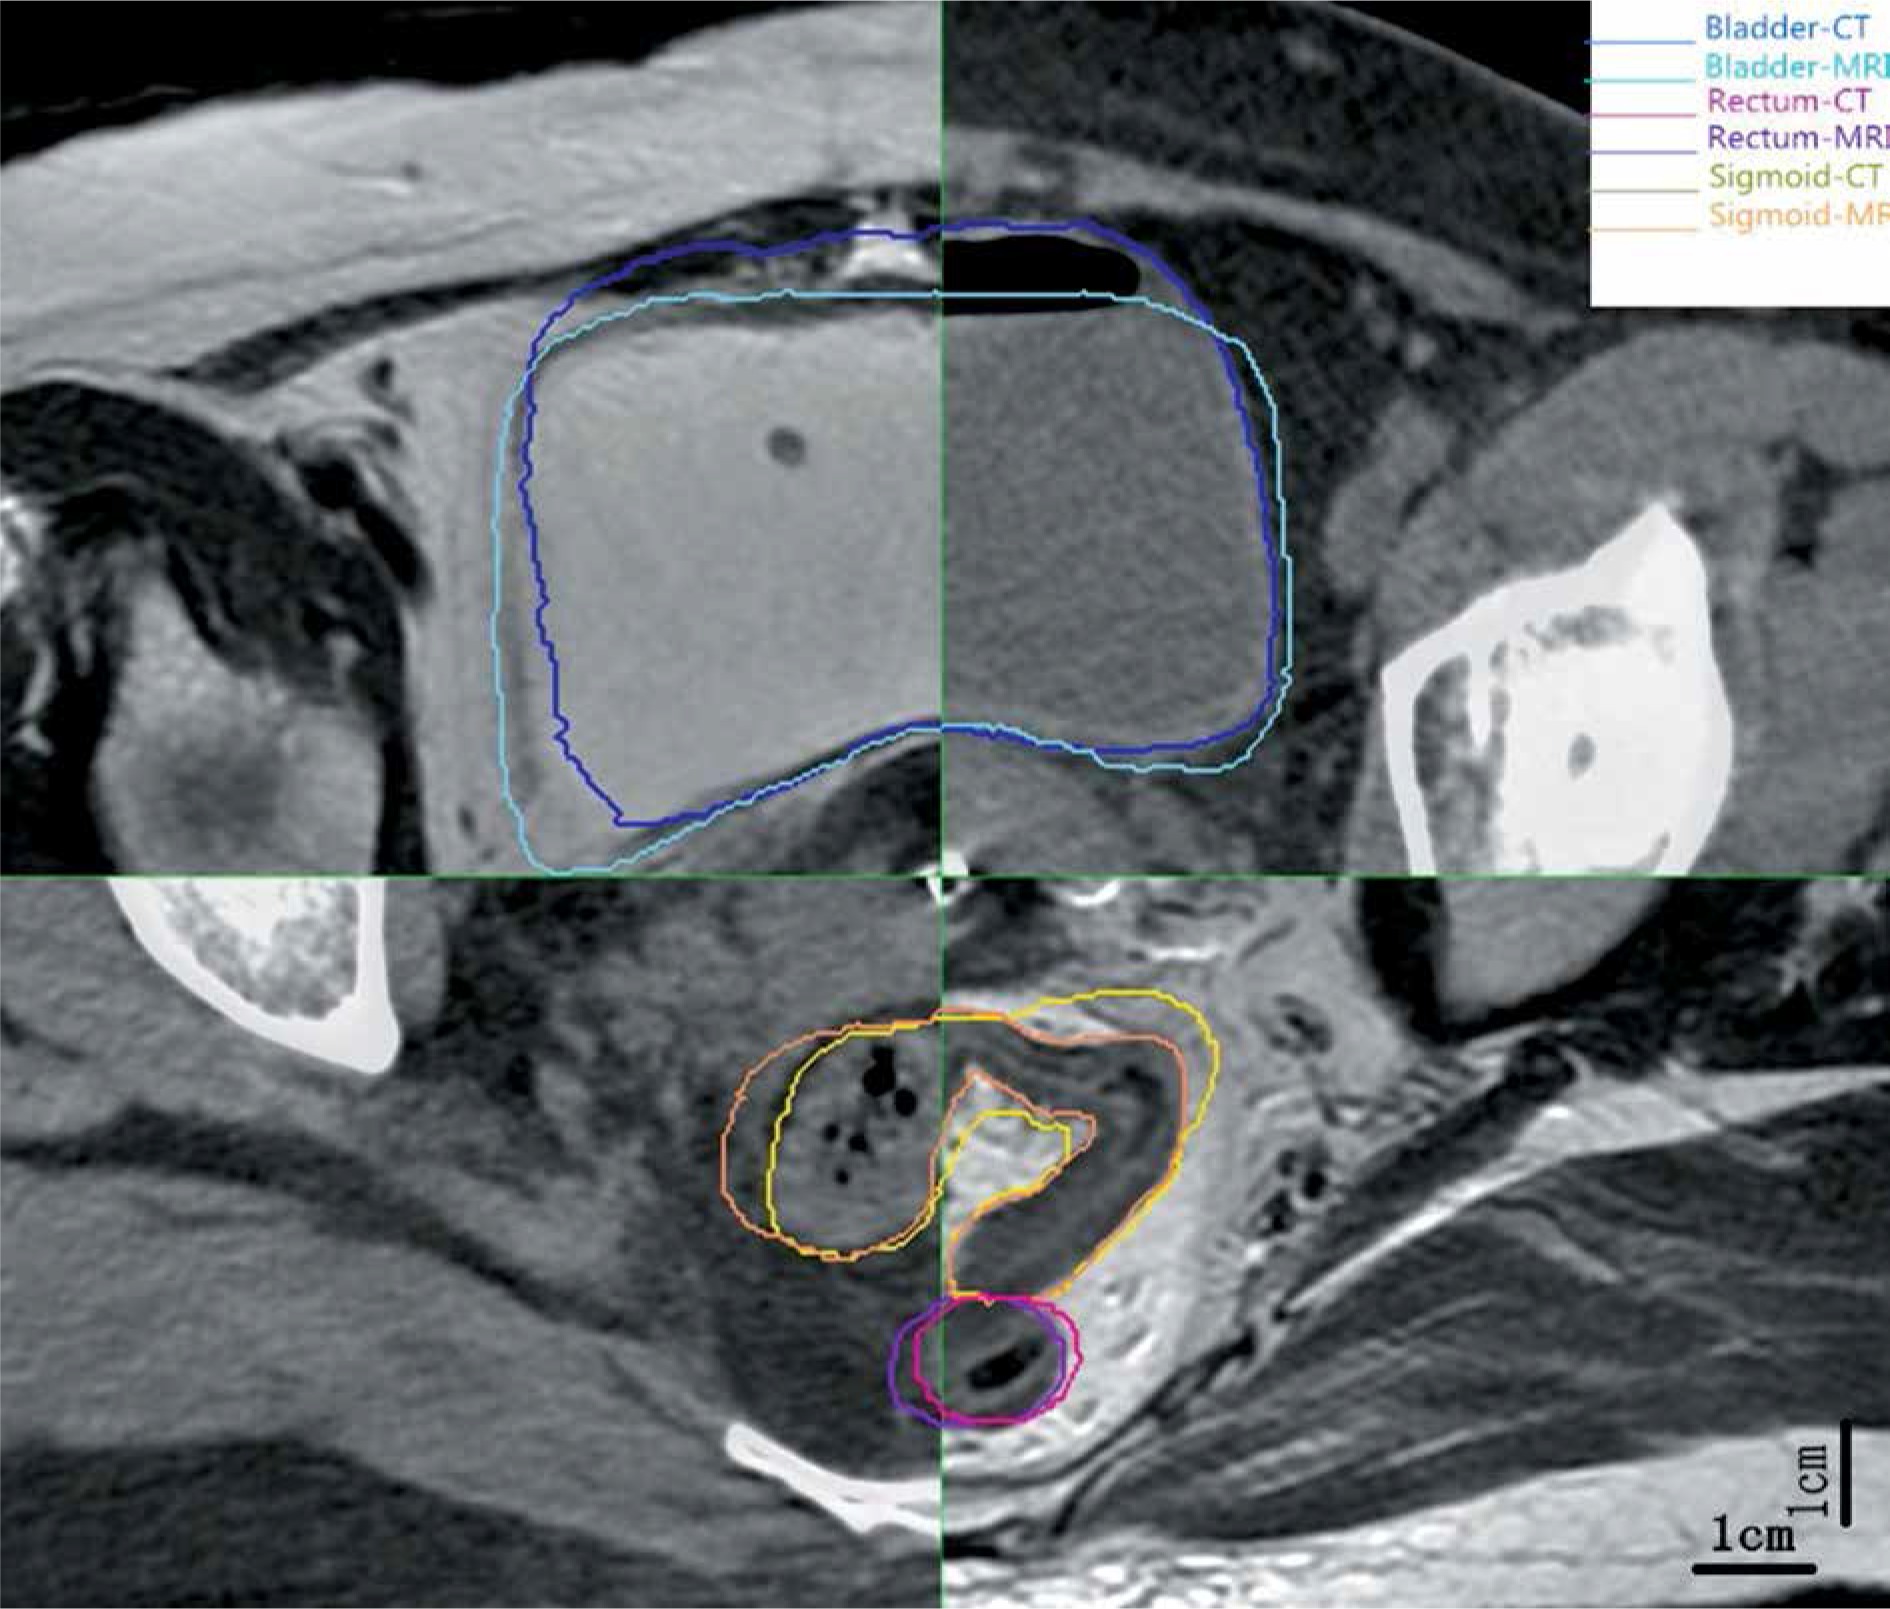
The contours of the bladder, rectum, sigmoid, and small intestine appeared to properly overlap on both CT and MRI scans (Figure 3). No statistical difference was observed for the doses to 0.1 cc, 1 cc, and 2 cc volumes for the above OARs between CT and MRI (Table 4).
Table 4
Mean doses with standard deviation for OARs with CT and MRI
Discussion
For more than a decade, the application of 3D imaging both during and after BT insertion has increased globally [13,14]. A 3D imaging-based BT has been well recognized as a much more precise technique than the traditional orthogonal radiographs. It allows for optimal dose coverage of the targets, leading to improvements in oncological outcomes [15]. CT images are by far the most used data for 3D BT. There are only a few institutions that own dedicated MRI for direct BT planning. However, the limitations of delineated targets on CT images were noted when compared to MRI-based ones [11,16,17,18]. Herein, our study assessed the accuracy of CT versus MRI, utilizing conformality indices, geometrical dimensions, and dose parameters.
In our study, the target dimensions, width, and thickness were significantly overestimated in CT compared with MRI, while the height was comparable. Because of the overestimated width and thickness, the volumes were significantly larger in CTVHR-CT. These differences come from the improved visibility of T2-weighted MRI. It can distinguish and better delineate soft tissue and tumor in the pelvis. The parametric ligaments were depicted with a wide variation in shape and thickness on CT [19]. Therefore, wide CTVHR volumes may be outlined on CT images for patients with a uterosacral or parametrial extension [2]. Several studies indicated that the height was similar between CT and MRI [11,20,21]. Rai et al. [22] reported that the height was significantly underestimated in CTVHR-CT contours; however, the statistics were similar between the heights of CT + MRI at diagnosis (CTVHR-CTdMRI) and CT + MRI at BT (CTVHR-MR). Viswanathan et al. [11] considered that CT contouring results can be improved by contrast-enhanced imaging and careful integration of information obtained from clinical examination and MRI immediately before BT. Although the tumor itself generally does not exhibit strong enhancement post-EBRT, uterine vessels can be identified as surrogates in the delineation of cervical-uterine junction on contrast-enhanced CT images. This junction can guide contouring of the superior border of CTVHR. Mahantshetty et al. [23] suggested that a CT-based target using MRI at diagnosis and real-time transrectal ultrasonography data during BT seems comparable to the gold standard of MRI-based approach in IGABT for cervical cancer. In our study, pre-BT MRI and clinical examination were performed and used as references for contouring on CT images. The tumors were significantly reduced after EBRT and heights of tumors shrunk to the cervix in 12 cases before BT. Therefore, there was no significant difference in the height between MRI and CT in this study. CT images were comparable to MRI for contouring OARs in our study. The difference in the volume of rectum was occasionally statistically significant because of the interval time between MRI and CT [24].
The parameters of volume, length, width, and height can be accounted for the general shape of CTV comparing CT with MRI, while the DSC, HD, and ΔV can shed light on the spatial correlation between two groups [25]. These parameters have been commonly used in a comparative study of target areas and to evaluate the accuracy of 3D medical image segmentation [26]. Pötter et al. [18] analyzed conformity index (CI) between CT contours and reference contours on MRI with the applicator in place. They found that most disagreements occurred between the contour set in caudal and cranial regions of CTVHR-MR. The CI and coefficient of variation (CV) of OARs volumes contoured across physicians for patients treated with interstitial brachytherapy had been reported by Damato et al. [27]. Twenty-three gynecologic radiation oncology experts contoured the same 3 cervical cancer BT patients to compare CT with MRI contours, and found that Dice coefficients were 89% for stage IB2 patient with complete response (CR), 74% for stage IIB case with partial response (PR), and 57% for stage IIB patient with CR [28]. Mason et al. compared CTVHR with corresponding cone beam CT (CBCT), ultrasound (US), and CBCT-US-fused images using DSC (range, 0.81-0.84) [29]. Novakova et al. [30] used HD and ΔV to determine the optimal number of plans for locally advanced cervical cancer and found HD to be an easy-to-implement criterion to select those patients’ pre-treatment. HD was used to compare differences in the contour edge, while ΔV presented differences in the inner center of a mass. These three parameters can comprehensively compare the internal and external shape differences between the two target areas. On the other hand, the conformity parameters can also provide a preliminary evaluation of the fusion quality of CT and MR images. DSC above 0.70 presented good result [31]. The values of HD and ΔV parameters below 0.5 cm showed little difference, and the smaller their values, the better the results [32]. The differences in conformal parameters of DSC, HD, and ΔV between the two target areas in our study were mainly due to the following reasons: 1. The differences in the display of soft tissues between MRI and CT; 2. The differences in the slice thickness of MRI and CT, which was 5 mm for MRI and 3 mm for CT, and could impact the delineation of the target area; 3. Each patient underwent CT first and then MRI scan. The CT scan process only needs no more than 1 minute, while the MRI scan needs about 15 minutes. Therefore, there was a time gap between the two scans. The bladder size and intestinal filling change during the MRI scanning, which might lead to differences in boundaries of CTVIR. According to our study, DSC and ΔV of CTVHR and CTVIR comparing CT with MRI were similar; however, the difference in HD values was relatively large. CT images regarding pre-BT MR images for delineating were still not enough.
For adaptive planning of cervix cancer BT, ABS guidelines recommended that 3D imaging with ultrasound, CT, or MRI should be performed when feasible to estimate cervical tumor dimensions and ensure adequate coverage of the tumor [33]. In our study, the D90 and D98 for the CTVHR and CTVIR with CT were compared with MRI. Because of the larger volume in CTVHR-CT, the D90 and D98 values were significantly lower. Since MRI is not available for planning of each BT fraction in all institutions where image-guided cervix cancer BT is performed, studies combining MRI and CT for different fractions have been reported. Beriwal et al. [34,35] were first to report the use of MRI at the time of first BT planning with the applicator in place, followed by subsequent CT-based fractions comparing with single MRI for all fractions. Mean D90 for CTVHR and doses of OARs with the MRI-only were comparable to the MRI-CT method. Nesvacil et al. [36] described a technique of combining MRI for first BT fraction and CT for subsequent fractions. The results showed a striking similarity between cases of small tumors and intracavitary applications with fully MRI-based planning, both in terms of CTVHR coverage and corresponding OARs dose limits. For larger tumors, complicated applications, and situations with unfavorable OARs topography, MRI-based adaptive BT planning remains superior over CT-based. Choong et al. [8] reported their experiences of using an alternative CT/MRI-based (hybrid) approach, with all patients having a pre-BT MRI scan at 4 days before treatment and a second MRI scan with applicators in place at the first fraction. CT was used for subsequent fractions; the CTVHR from MRI at the first fraction was transferred into subsequent fraction CT image sets for the hybrid approach. Dosimetry and late toxicity rates achieved were similar between the two groups.
According to dose parameters of OARs, no significant differences between CT and MRI were identified in our study; CT images were comparable to MRI for contouring OARs. However, many studies have found improved dose avoidance using MRI approaches [8,24,36]. These results were obtained probably due to better identification of tumor delineation, the wall of bladder, rectum, and sigmoid, and the interval time between MRI and CT scans.
In future, we are planning to conduct more analysis on how to precisely fuse a part of pre-BT MR images with CT at BT to delineate the CTV area more accurately.
Conclusions
According to our study, the width and thickness of CTVHR are significantly overestimated on CT as compared to MRI. DSC and ΔV of CTVHR and CTVIR are similar; however, there is a difference in HD. Dosimetrically, the D98 and D90 for CTVHR are lower for CT-based technique. Concerning OARs, CT images are comparable to MRI. These differences are due to the soft tissue resolution between CT and MRI, not the difference in organ geometry. CT images regarding pre-BT MR images for delineating are still not enough and MRI fusion is required.


