
Introduction
Type 1 diabetes mellitus (T1D), an autoimmune disorder, is becoming increasingly common, affecting over 1.52 million children and young adults under the age of 20, according to the International Diabetes Federation [1]. The widespread prevalence of overweight and obesity among people with T1D worldwide poses a particular challenge to medical professionals. It is estimated that in the developmental population of T1D patients, the problem of excessive body weight affects up to 35% of patients, and the percentage of overweight children increases as soon as diabetes is diagnosed [2].
The coexistence of excessive weight in patients with T1D is associated with additional risk factors of developing cardiovascular complications, microangiopathy and macroangiopathy.
Moreover, the prevalence of insulin resistance associated with overweight and/or obesity worsens glycemic control, increases daily insulin requirements as well as HbA1c levels, and leads to a more atherogenic lipid profile. Estimated glucose disposal rate (eGDR) has been used to measure insulin resistance in patients with T1D. The formula takes into account the following clinical measurements: waist-to-hip ratio, HbA1c, presence of hypertension, and in children: HbA1c, daily insulin requirement, and age [3–6].
In addition, insulin resistance and obesity are the most important risk factors for metabolic dysfunction-associated fatty liver disease (MAFLD) in children and adolescents, which is currently recognized as the most common cause of chronic liver disease [7–10]. The currently recommended screening test is assessment of alanine aminotransferase (ALT). Ultrasonography is commonly used as a first-line diagnostic procedure for MAFLD imaging. Other methods include magnetic resonance imaging and spectroscopy as well as computed tomography scans, each of which has its limitations. Liver biopsy is recommended for the diagnosis of fatty liver disease, but is not commonly used in children. Recent reports suggest the use of transient elastography performed with FibroScan in the diagnosis of MAFLD. The histological classification of MAFLD includes metabolic dysfunction-associated fatty liver (MAFL), and metabolic dysfunction-associated steatohepatitis (MASH) [11–14]. The presence of MAFLD is an additional risk factor for the development of micro- and macrovascular complications [15].
The aim of this study was to compare and analyze metabolic control, the incidence of insulin resistance and MAFLD in children and young adults with T1D with excessive body weight and in T1D patients with normal body weight.
Material and methods
The study was performed in the Pediatric Endocrinology and Diabetology Division, Department of Clinical Pediatrics as well as the Outpatient Clinics of the Provincial Specialist Children’s Hospital in Olsztyn in the years 2019–2022.
Thirty-two patients with type 1 diabetes and normal weight (T1D-N), and 31 with type 1 diabetes and excessive body weight (T1D-E) were included in the study. Inclusion criteria for all study participants were age 10–24 years and duration of type 1 diabetes of at least 2 years. Patients with other known autoimmune diseases, microvascular complications or disease remission, and patients who had undergone trauma, surgery, or acute infection in the previous month were excluded from the study.
The standard anthropometric measurements were obtained (weight, height, and waist circumference) and referenced to percentile (pc) charts according to age and sex. Body mass index (BMI, kg/m2) was calculated using the formula: body weight (kg)/height2 (m2) and standardized BMI (BMI-SDS): (BMI – BMI 50 pc)/0.5x (BMI 50 pc – BMI 3 pc). Excess body weight was defined as BMI > 90 pc based on BMI for age (percentile charts of nationally representative groups).
Blood pressure was determined based on the average of three measurements obtained during an outpatient visit using an ambulatory standard automated upper arm blood pressure monitor.
Additionally, in patients with T1D the daily requirement of insulin was counted (IU/kg/24 h).
Eight milliliters of venous blood was collected for laboratory testing after 8-12 hours of fasting and then centrifuged for 10 minutes at 2,000 rpm. Blood tests including fasting blood glucose (FBG), glycated hemoglobin (HbA1c), insulin, total cholesterol (TC), low-density lipoprotein (LDL), high-density lipoprotein (HDL), triglycerides (TG), ALT, aspartate aminotransferase (AST), gamma-glutamyltransferase (GGT), and 25-hydroxyvitamin-D were performed using standard methods at the Diagnostic Laboratory of the Provincial Specialist Children’s Hospital in Olsztyn. The remaining material (serum) was retained at –80°C until assayed.
To assess insulin resistance in patients with type 1 diabetes, the estimated glucose disposal rate (eGDR) was used, calculated using two indirect methods:
eGDR1: 20.91 + [1.51 × (boy 1, girl 0)] – [0.1 × (age in years)] – [0.13 × (waist circumference in cm)] – [0.3 × HbA1c%] – [2.11 × daily insulin requirement], and eGDR2: 21.158 + (–0.09 × waist circumference in cm) + (–3.407 × HBP [hypertension: no, 0; yes, 1]) + (–0.551 × HbA1c%). Lower eGDR values indicate greater insulin resistance [16, 17].
Based on the standard protocol for measuring carotid intima-media thickness (cIMT), three measurements were made in the left and right common carotid artery using a PHILIPS, Toshiba Apolio 500 ultrasound scanner. The average of a total of six measurements was taken into account in the analyses [13, 18, 19]. An abdominal ultrasound examination was performed to determine the presence of features of fatty liver disease. The description took into account the size and echogenicity of the liver, as well as the visibility of hepatic vessels. The criteria for the diagnosis of MAFLD were: increased ALT levels (> 37 U/l), typical ultrasound findings, and exclusion of other causes of fatty liver disease.
Statistical analysis
STATISTICA v.13.3 software was used to perform statistical analyses. Quantitative variables were expressed as mean and standard deviation (SD), and the values of categorized variables were presented in terms of cardinality (N).
Due to the fact that all parameters met the criteria of normal distribution, Student’s t-test was used to analyze the differences between the examined parameters to compare two groups. Results were considered statistically significant at the level of p < 0.05.
Results
General characteristics of the study groups and a comparison of the analyzed parameters between T1D-N and T1D-E patients are shown in Table I.
Table I
General characteristics of the study groups and a comparison of the analyzed parameters between patients with type 1 diabetes and normal weight (T1D-N), and patients with type 1 diabetes and excessive body weight (T1D-E)
The analysis in the study showed that patients with type 1 diabetes and excessive body weight comparing to those with normal weight had higher systolic blood pressure (125.58 ±8.18 vs. 120.16 ±10.02 mmHg, p = 0.022), diastolic blood pressure (78.19 ±7.03 vs. 73.94 ±7.95 mmHg, p = 0.028) and triglyceride levels (118.19 ±71.20 vs. 71.31 ±18.76 mg/dl, p = 0.001). It is worth noting that T1D-E subjects had a significantly larger waist circumference (80.42 ±6.98 vs. 69.00 ±7.27 cm, p = 0.0001) which indicated central obesity.
We also noted a difference, although not significant, in glycemic control among diabetic patients. Mean HbA1c levels from the year before and during the study were higher in T1D-E patients (7.99 ±0.93% and 8.1 ±1.21%) than in the T1D-N group (7.61 ±0.89% and 7.78 ±0.91%; p = 0.099, p = 0.252). Average daily insulin requirement was 0.83 ±0.16 IU/kg/24 h in patients T1D-E and 0.85 ±0.17 IU/kg/24 h in T1D-N (p = 0.593). There were statistically significant differences in eGDR1 and eGDR2 between the groups. Lower values of estimated glucose disposal rate, and thus lower insulin sensitivity, were noted in T1D-E vs. T1D-N: eGDR1: 5.16 ±1.33 vs. 6.96 ±1.32, eGDR2 9.37 ±1.21 vs. 10.66 ±0.9 (p = 0.0001, p = 0.0001) (Table II).
Table II
Data related to disease course and glycemic control in the study groups
We reported lower concentrations of 25-(OH)-D3 among T1D-E than in the T1D-N patients (19.42 ±8.39 vs. 29.45 ±23.36 ng/ml, p = 0.012). The detailed cIMT analysis did not show any significant differences between the T1D-N and T1D-E groups (0.43 ±0.06 vs. 0.44 ±0.04 mm, p = 0.581) (Table I).
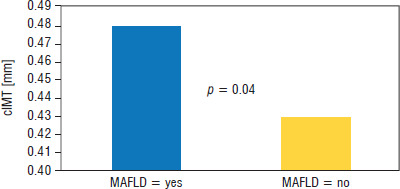
There was higher prevalence of MAFLD in patients with T1D-E compared to the T1D-N group (13% vs. 0%, p = 0.014). Patients with MAFLD had higher levels of TC, TG, LDL, AST, ALT, GGT, and cIMT. In the T1D-E group, cIMT in subjects with metabolic dysfunction-associated fatty liver disease (MAFLD = yes) was 0.48 ±0.03 mm, which was higher than the cIMT value in the group without metabolic dysfunction-associated fatty liver disease (MAFLD = no), which was 0.43 ±0.03 mm. The differences were statistically significant (p = 0.04) (Table III, Fig. 1).
Table III
Comparison of patients with and without MAFLD in the T1D-E group
Discussion
In recent years, in most countries of the world, there has been a significant increase in the incidence of obesity during developmental age in the general population, including in patients with type 1 diabetes [20]. The cause of excessive body weight in children is multifactorial and partially overlaps with the risk factors for simple obesity. Genetic, environmental, socio-economic, and psychological factors that determine a positive energy balance also contribute to the development of excessive body weight in this group. Additionally, factors directly related to type 1 diabetes and the treatment method should be taken into account. These include intensive insulin therapy, especially the use of a personal insulin pump, improper nutrition, female sex, puberty, early onset of the disease, low physical activity, psychosocial factors, repeated episodes of hypoglycemia, and fear of its occurrence [21]. Furthermore, excessive weight gain during development is critical and may contribute to obesity and its complications in later life, as most children who are obese in early childhood continue to be obese in adolescence and adulthood [22]. In the DCCT/EDIC study, excessive body weight in patients with T1D was reported as a risk factor of dyslipidemia, hypertension, insulin resistance, and extensive atherosclerosis, thus increasing the risk of cardiovascular complications [23, 24].
Friedland et al. identified a relationship between obesity and increased total cholesterol and triglyceride levels in obese children and adolescents [25]. Typical dyslipidemia in obesity is characterized by high levels of triglycerides, low HDL levels, and normal or slightly elevated LDL cholesterol [26]. Moreover, patients with type 1 diabetes are more likely to have dyslipidemia, which is characterized by higher levels of LDL and lower levels of HDL cholesterol [27, 28]. Furthermore, high levels of triglycerides and total cholesterol and low HDL levels correlate with poorer glycemic control [29].
The data obtained from our study showed a correlation between higher BMI and hypertriglyceridemia, which is consistent with the results of previous studies.
Arterial hypertension is also a significant clinical problem in patients with type 1 diabetes. Despite the young age of patients with T1D, higher blood pressure values occur more often than in the general population. Its pathogenesis in this disease is complex. In addition to diabetic nephropathy, poor metabolic control and, more recently, excessive body weight and insulin resistance are also emphasized [30, 31]. Redondo et al. reported “a 3.5 times higher incidence of hypertension in children with type 1 diabetes and obesity” [32].
A similar relationship can be observed in our study. Higher values were obtained in the group of patients with T1D-E compared to the group of patients with T1D-N. Our findings provide further evidence that even though T1D is an independent risk factor for hypertension, excessive body weight significantly accelerates its occurrence.
When comparing the T1D-E and T1D-N patients, glycemic control, as reflected by HbA1c, should be analyzed. According to Noor et al., in a study conducted among adults with type 1 diabetes, obesity was associated with higher HbA1c values and older age [33]. In our study we made a similar observation – HbA1c values were slightly higher among patients with T1D-E, although the difference was not statistically significant. This may be attributed to the small sample size, age of study participants, and the short duration of the disease that was analyzed.
Many studies draw attention to the occurrence of insulin resistance in patients with type 1 diabetes. Excess visceral fat tissue leads to reduced sensitivity of cells to insulin, including exogenous insulin. The anthropological expression of insulin resistance is therefore a higher BMI and waist circumference [34].
In patients with type 1 diabetes, it is proposed to use the previously described eGDR1 and eGDR2 indices to assess insulin resistance [16, 17, 35]. In their work, Chillaron et al. found that “lower eGDR values are associated with insulin resistance and the occurrence of metabolic syndrome among patients with type 1 diabetes” [36]. Many other studies have also confirmed this relationship and the correlation with BMI [37, 38]. Similarly to others, we observed lower eGDR1 and eGDR2 values in the group of patients with T1D and excessive body weight, thus indicating greater insulin resistance. The use of these indicators in clinical practice therefore seems to be invaluable in identifying insulin resistance in patients with type 1 diabetes.
Based on these results, we concluded that weight gain resulting from an increase in the content of visceral fat tissue and insulin resistance in patients with type 1 diabetes may be an important cause of the development and progression of chronic complications.
Metabolic dysfunction-associated fatty liver disease is nowadays more frequently diagnosed among patients with type 1 diabetes, including children, adolescents, and young adults. Metabolic disorders resulting from peripheral and hepatic insulin resistance contribute to the occurrence of MAFLD [39].
Al-Hussaini et al. found in a study of 106 type 1 diabetic children aged 8 months to 15 years that MAFLD occurred in 11.3% of the study participants and correlated with high HbA1c values [40].
Until recently, it was believed that atherosclerotic lesions develop independently of MAFLD, as a consequence of the same metabolic disorders. However, MAFLD itself has been shown to increase the risk of vascular complications regardless of classic cardiovascular risk factors, insulin resistance, and other components of the metabolic syndrome, and is associated with higher cIMT values [41–44].
In patients with diabetes, MAFLD additionally increases the risk of polyneuropathy and nephropathy [45]. In our study, MAFLD was reported only among the group T1D-E. Nevertheless, those patients had significantly higher results of ALT, AST, GGT, TG, and LDL than the T1D-E group without diagnosed fatty liver disease. No correlation was found between MAFLD and daily insulin dose, HbA1c and eGDR1, or eGDR2. Moreover, higher cIMT values were noted in the T1D-E group with MAFLD.
Based on the study, it can be concluded that obesity is a major factor in the development of MAFLD, and the presence of liver disease is associated with a higher risk of vascular complications.
The role of vitamin D3 in the development of atherosclerotic changes remains a subject of research. Many studies emphasize its protective effect: it prevents endothelial dysfunction, modulates the course of inflammation, and also has a positive effect on lipid metabolism and insulin sensitivity [46, 47].
Vitamin D3 levels were below the recommended norm in both groups, but lower levels were found in the T1D-E group. This suggests the need for supplementation and dose adjustment not only to the age but also to the body weight of the patients.
Limitations of the study
We acknowledge that our study has some limitations. The study groups included a small population sample and a small number of patients. Further observations and research are needed to determine how obesity among adolescents with type 1 diabetes affects cardiovascular complications and the prevalence of MAFLD.
Conclusions
Excessive body weight in patients with type 1 diabetes causes poorer metabolic control, insulin resistance, increased blood pressure, and hypertriglyceridemia, i.e. typical components of the metabolic syndrome, which consequently leads to an increased risk of vascular complications. Moreover, excessive body weight is a risk factor for the development of MAFLD in patients with type 1 diabetes. Medical care for patients with type 1 diabetes should also include preventive measures aimed at reducing the risk of vascular complications in the future. Particular attention should be paid to maintaining a healthy weight in children and adolescents with type 1 diabetes. We believe that our results may aid in the early management of obese children with T1D to prevent the development of MAFLD and chronic complications.


