
Purpose
Low-dose-rate (LDR) brachytherapy is an effective single treatment modality for low- and intermediate-risk prostate cancer, and is used in combination with external beam radiation for high-risk prostate cancer [1-3]. Many institutions have achieved very high tumor control of 90-95%, with acceptable toxicity and high-quality implants [1, 3-6]. Even though many techniques and approaches exist (pre-plan vs. intra-operative plan, loose seeds versus stranded seeds, high vs. low seed activity) [7, 8], the most important factor is to achieve consistent and acceptable radiation coverage of the prostate, as reflected by post-implant outcomes [9]. Refinements in seed implantation techniques have improved the results over time, and guidelines have been developed to ensure the quality of implants [1, 10].
We selected three important post-implant factors for evaluating variability, including prostate V100 (percentage of prostate volume that received 100% of the prescribed radiation dose) and D90 (radiation dose to 90% of the prostate volume), as these are correlated with tumor control [11], and RV100 (rectal wall volume that received 100% of the prescribed radiation dose), as there is correlation between rectal toxicity and this metric [12, 13]. At the Princess Margaret Cancer Centre, prostate brachytherapy is performed utilizing iodine-125 (125I) seeds, with a prescribed dose of 145 Gy [9, 14]. An implant is considered acceptable if V100 is more than 85% [15], D90 more than 130 Gy [15, 16], and RV100 is less than 1.3 cm3 [13, 16].
Clinical parameters are usually assessed as being within an acceptable standard of performance or not. This binary classification of performance (either within specifications and therefore acceptable, or out-of-specification and therefore unacceptable) does not create an opportunity for process improvement, because the setting of specifications does not provide any information on how a particular process performs while the parameter changes within, and does not exceed pre-determined specifications [17]. Statistical process control (SPC) is the application of statistical techniques to monitor and improve processes [18, 19]. SPC discriminates between variations due to random fluctuations (common cause variation), which are inherent to the process under observation, and non-random fluctuations (special or assignable variation), which usually arise due to factors that are not intrinsic to the process [18, 19]. Control charts can help differentiate between common cause variation and special cause variation. According to methods developed by Shewhart [17], common cause variation is reduced by improving the process, while special cause variation is reduced by first identifying the special cause, and then removing it.
Statistical process control is used in multiple fields of medicine, including infectious disease and preventive medicine [20, 21], orthopedics [22], pediatrics [23], and for improving bio-pharmaceutical manufacturing processes and operations [24]. In radiation oncology, it was described in multiple publications, including investigating energy variations in tomotherapy [25], and for assessing the quality of high-dose-rate (HDR) brachytherapy treatment delivery [26]. In this study, control charts were used in prostate LDR brachytherapy permanent seed implants to identify cases that did not meet the expected level of performance based on the historical record of our implant process for RV100, V100, and D90, and to determine whether the identified variation was associated with clinical observations.
Material and methods
Patient population
This retrospective analysis was approved by the University Health Network Research Ethics Board (No. 10-0294-CE). The study group consisted of 213 consecutive men with prostate cancer treated at the Princess Margaret Cancer Centre. One implant was excluded that was subsequently re-implanted because it did not meet our specifications in terms of dose coverage to target volumes. Eligibility criteria for the study were: age eighteen years or older, histologically confirmed prostate cancer, no evidence of metastases, pre-treatment planning, implant procedure with 125I, and post-implant dosimetry at one month. Average age was 63 years (range, 48-76 years), and 66% of patients had T1CN0M0 and the rest T2N0M0 prostate cancer; 81% Gleason 6, and the rest Gleason 7; average PSA was 5.84 ng/ml (range, 0.4-14.8 ng/ml). All patients received: tamsulosin 0.4 mg starting 1 week before and continued after implant for at least 3 months. Cipro 500 mg p.o. bid × 7 days and meloxicam 7.5 mg p.o. bid × 30 days were provided starting on the night after implant.
Pre-treatment planning
Prostate mapping was performed 2-4 weeks before implantation. Imaging was done using transrectal ultrasonography (B&K Leopard 2001, BeK Medical, Wilmington, MA, USA) at 6.5 MHz. Images were recorded every 5 mm and a VariSeed treatment planning system (version 7.1, Varian, Palo Alto, CA, USA) was used with a prescribed dose of 145 Gy [9, 11]. Clinical target volume (CTV) was defined as the prostate with an anterior and lateral margin of 3 mm, and a 5 mm margin in the cranial and caudal directions, with removal of the expansion into the bladder wall. No posterior margin was added at the rectal interface. For patients with Gleason 7 prostate cancer, lateral margins were 5 mm on the prostate side involved with Gleason 7 tumor [27]. Pre-plan dosimetry goals included prostate CTV V100: > 99%, CTV D90: 120-125%, and CTV V150: 55-62% [27]. Pre-treatment plans aimed to deliver 150% of the dose to intra-prostatic regions that harbored positive biopsy cores. Pre-treatment plans were designed to keep UD5 (dose to 5% of the urethral volume) < 150%, and UD30 (dose to 30% of the urethral volume) < 125% of the prescribed dose [16]. RV100 was kept under 1 cm3.
Implantation procedure
Permanent seed implantation was performed under general anesthesia. Patients were positioned in lithotomy as close to the exact position as possible at the time of mapping session. Under transrectal ultrasound guidance, transperineal insertion of seeds was performed according to the pre-treatment plan. We used partial strands, which is a combination of loose seeds and strands. During the procedure, serial X-ray imaging of the prostate was obtained with each row of seeds implanted to assess the quality of seed insertion, and facilitate intra-operative decision regarding necessary deviations from the pre-plan in order to improve dosimetry to the prostate.
Post-implant dosimetry
Post-implant dosimetry using CT-MR fusion was performed 30 days after the implant. After urinary catheter insertion, axial CT images were taken in the supine position with Aquilion ONE Toshiba CT scanner (Toshiba America Medical Systems, Inc., Tustin, CA, USA). Slices were obtained at 2.5 mm intervals without an inter-slice gap. Axial MR scans were taken using 3T IMRIS/Siemens MRI scanner (IMRIS, Winnipeg, MB, Canada), and were obtained immediately after CT. The slice thickness was 3 mm with no inter-slice gap. CT-MR (high-resolution, T2-weighted) fusion was performed manually by a brachytherapy dosimetrist, relying on brachytherapy seeds as fiducial markers. Seed location was determined in VariSeedTM on CT images, and seed count was verified manually using orthogonal pelvic X-rays. All relevant soft tissue structures were contoured on MR scans, except the urethra, which was contoured on CT scans. Critical organ contouring and dosimetry were performed according to the American Brachytherapy Society guidelines [16]. Dosimetry parameters were captured from dose volumes histograms.
Control charts
A multivariate control chart of Hotelling’s T2 statistic was plotted using the measurement of V100, RV100, and D90 for each implant. Control limits were calculated from the first fifty implants, and the data for subsequent implants were plotted on the control chart. All data points that exceeded the control limit were subject to further investigation. Univariate control charts were plotted for V100, D90, and RV100, and the implants identified as out-of-control on multivariate chart were identified on univariate charts to determine the cause of the out-of-control condition. Hotelling [28] developed a multivariate statistic, which combines the observations X (as a vector x1, x2, …xn) for n variables measured at each observation, the mean vector μ (μ1, μ2, …μ n) and their covariance Σ into a single statistic T2, which can be plotted on a multivariate control chart as:
T2 = (X – μ)’ Σ–1 (X – μ)
where Σ–1 (X – μ) is the inverse of the covariance matrix [29]. The calculation for the multivariate control chart was implemented using National Institute of Standards and Technology (NIST) Dataplot statistical analysis software.
Comparison between patients in-control and out-of-control
Comparison between patients in-control and patients out-of-control was performed as follow:
(A) Pre-treatment patient characteristics were obtained during the initial consult visit at the radiation oncology department of Princess Margaret Cancer Centre, including age, baseline prostate specific antigen (PSA) serum level, number of prostate biopsy cores with malignancy, prostate volume, baseline international index of erectile function (IIEF) score, baseline international prostate symptom (IPS) score, maximal urine flow rate, voided urine volume (ml), and urinary bladder post-void residual (PVR).
(B) Pre-treatment simulation (Sim) dosimetry parameters: Sim V200, Sim V150, Sim V100, Sim V90, Sim V80, Sim D100, Sim D90, Sim D80, Sim CTV V200, Sim CTV V150, Sim CTV V100, Sim CTV V90, Sim CTV V80, Sim CTV D100, Sim CTV D90, Sim CTV D80, Sim UD5 (Gy), Sim UD10, Sim UD30, Sim UD50, and Sim RV100 (cm3).
(C) Prostate brachytherapy seed and needle data: number of seeds used, needles number, seed loss, and seed migration to lung [30, 31].
(D) Parameters of post-implant dosimetry performed 30 days after the implant: V200, V150, V100, V90, V80, D100, D90, D80, CTV V200, CTV V150, CTV V100, CTV V90, CTV V80, CTV D100, CTV D90, CTV D80, UD5, UD10, UD30, UD50, RV100, and prostate edema. Prostate edema was calculated according to the following formula:
Prostate edema (%) = [((post-treatment prostate volume)/(pre-treatment prostate volume)) – 1]*100.
Data points that were out of control were compared to data points that were in-control using Student’s t-test.
Results
Control charts
Two hundred and twelve consecutive implants were included in this analysis. Univariate control charts were generated by sequentially plotting the one-month post-planning V100, D90, and RV100 for each patient. Multivariate control chart was plotted using Hotelling’s T2 formula (Figure 1). Twelve data points exceeded the multivariate control limit, triggering investigation. These points were identified on the three univariate control charts. For all the univariate control charts, control limits were calculated based on data for the first fifty implants (Figure 1B-D). Of the three univariate control charts, the V100 chart had the most out-of-control points. For V100, the runtime data had a distribution that was asymmetrical as the V100 could not be greater than 100%, and thus the upper control limit could not be more than 100%. The mean value for the first fifty patients was 95.3% (Figure 1B). Twelve out-of-control points fell below the control limits. Ten of the twelve out-of-control points on the T2 control chart fell below the lower control limit of the univariate V100 chart. For D90, the runtime data was distributed approximately symmetrically about the mean, with a mean value of 115.9% in the initialization phase (Figure 1C). The process was found to be in-control during this interval, with only three data points falling below the lower control limit; these data points were also outside the multivariate control limits.
Fig. 1
A) Hotelling’s T2 multivariate control chart using measurements of V100, RV100, and D90 for each implant; B) Univariate control charts for V100, C) D90, and D) RV100. Control limits were set based on the first fifty acceptable implants (blank rhombuses). Rhombuses with solid fill denotes patient’s data after the 50 implants. Central dashed line indicates average, while solid lines denotes upper and lower control limits
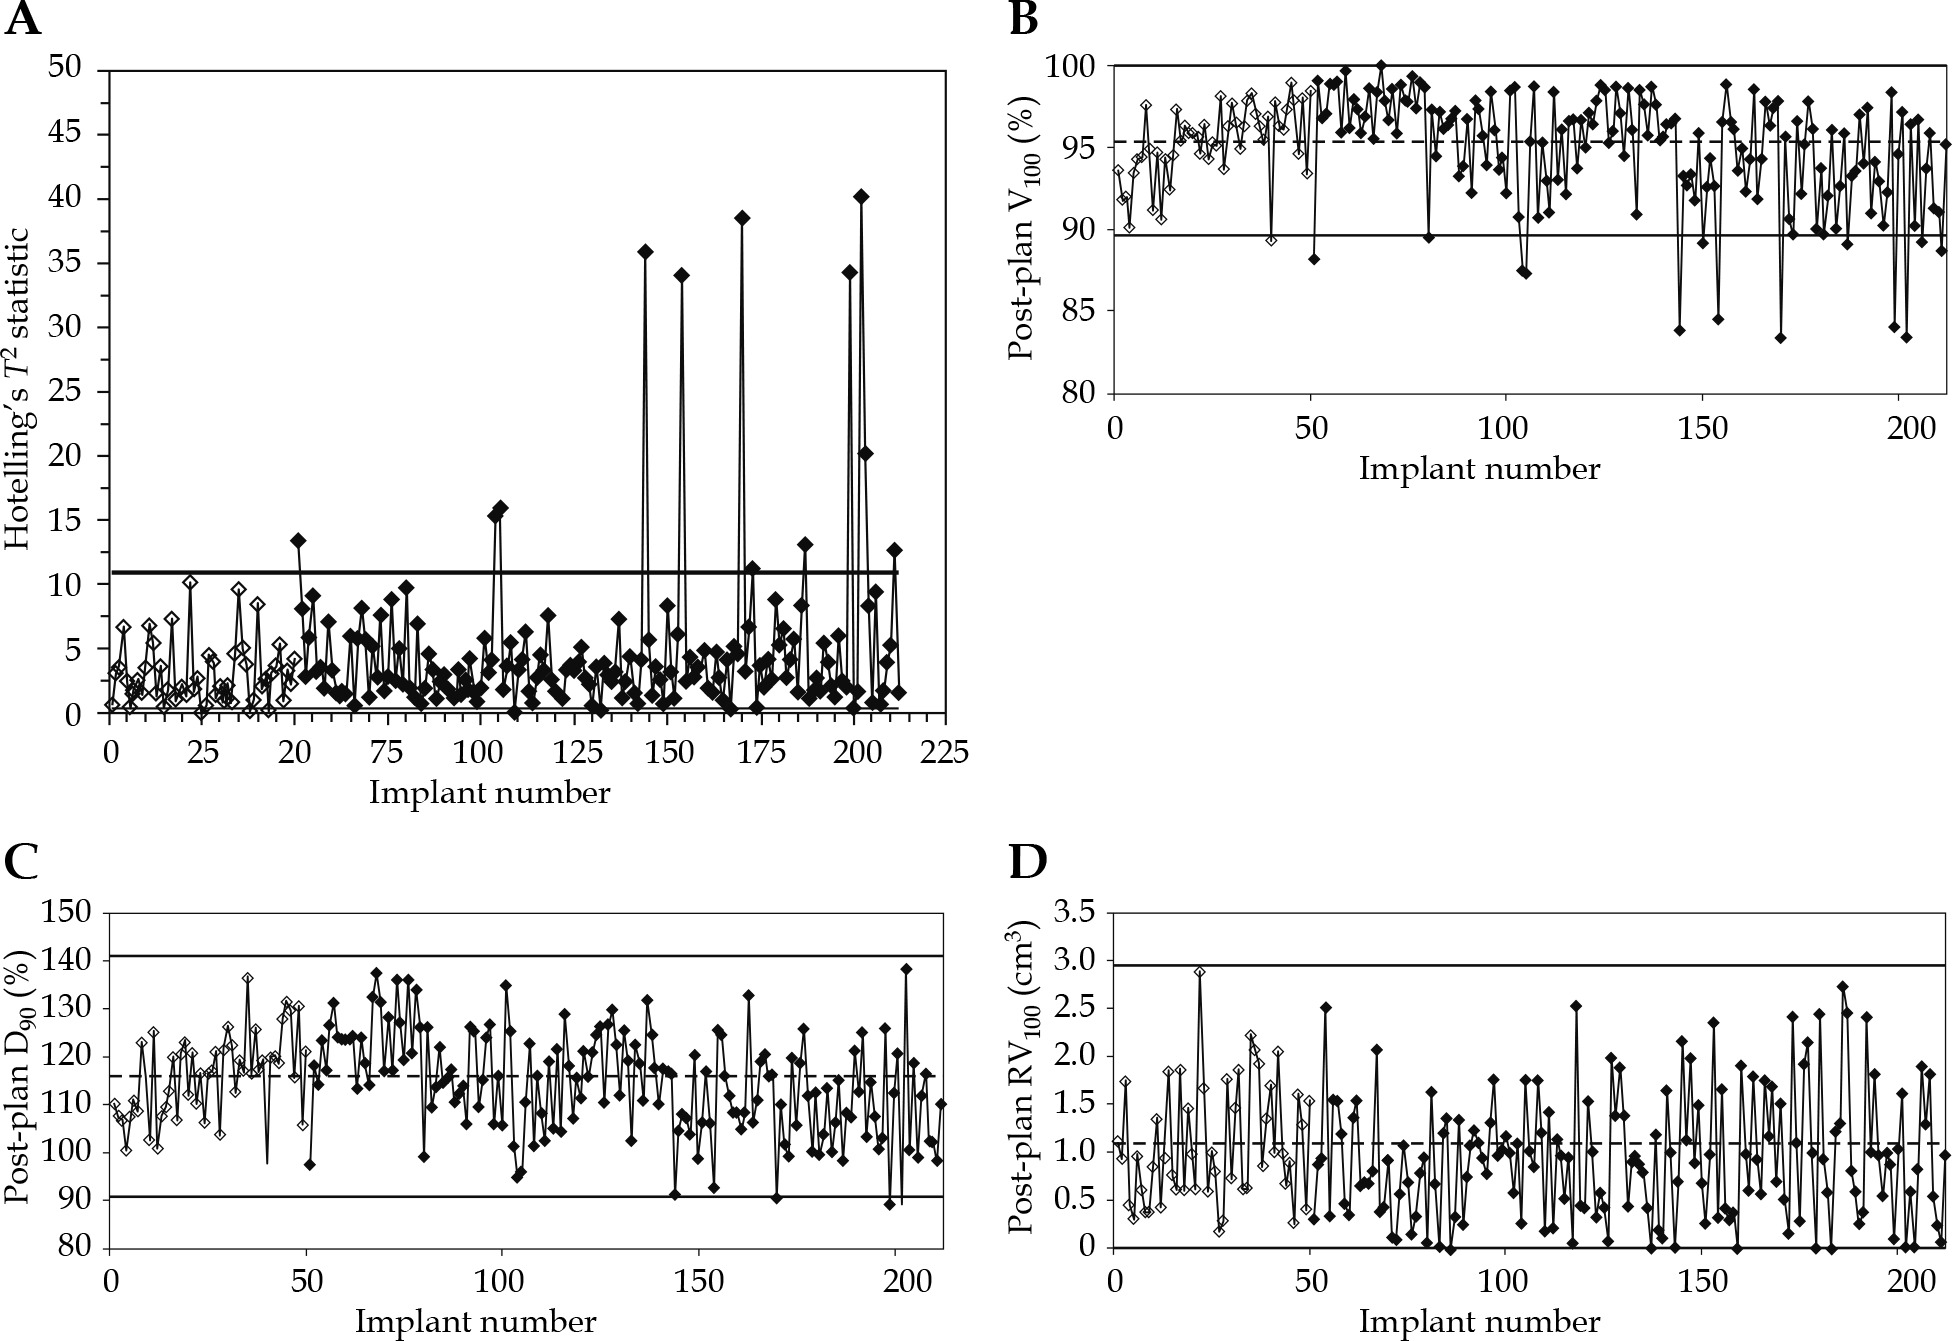
The data for RV100 was skewed to the right, as RV100 could have only positive values. The mean of RV100 was 1.1 cm3 during the initialization phase of the control chart (Figure 1D). All 212 measurements of RV100 fell below the upper control limit.
Comparison between in-control and out-of-control patients on control charts
We compared the patients who were in-control and out-of-control on the multivariate control chart, on both the multivariate and V100 univariate control charts, on the V100 univariate control chart only, and on the D90 univariate control chart only, for pre-treatment characteristics, simulation dosimetry parameters, prostate brachytherapy seed and needle data, and post-implant dosimetry data (Table 1).
Table 1
Post-implant dosimetry with CT-MR fusion was performed 30 days after the implant. Dosimetry parameters were compared between patients in-control and out-of-control (1) on multivariate control chart, (2) on both multivariate and V100 univariate control charts, (3) on V100 univariate control chart only, and (4) on D90 univariate control chart only
Pre-treatment patient characteristics were not statistically significantly different between patients in-control and out-of-control for age, baseline PSA, number of prostate biopsy cores with malignancy, prostate volume, baseline IIEF, baseline IPS score, maximal urine flow rate, voided urine volume, and urinary bladder PVR (Supplementary Table 1).
Among pre-treatment simulation dosimetry parameters, Sim D100 was significantly higher (p < 0.05) in patients who were in-control compared with those out-of-control on the multivariate control chart, on both the multivariate and V100 univariate control charts, and on the V100 univariate control chart only. Minor differences in the Sim CTV V100 were found between patients in-control and out-of-control on the multivariate control chart, and in the Sim CTV D80 on the V100 univariate control chart only. The differences in the other simulation dosimetry parameters including Sim V200, Sim V150, Sim V100, Sim V90, Sim V80, Sim D90, Sim D80, Sim CTV V200, Sim CTV V150, Sim CTV V90, Sim CTV V80, Sim CTV D100, Sim CTV D90, Sim UD5, Sim UD10, Sim UD30, Sim UD50, and Sim RV100 were not significantly different between in-control and out-of-control patients on all the control charts (Supplementary Table 2).
The number of needles used during the seed implantation procedure, the number of seeds implanted, the number of seeds lost between implantation and dosimetry, and the number of seeds that migrated to the lungs were not significantly different between patients in- and out- of control (Supplementary Table 3) on all the control charts drawn.
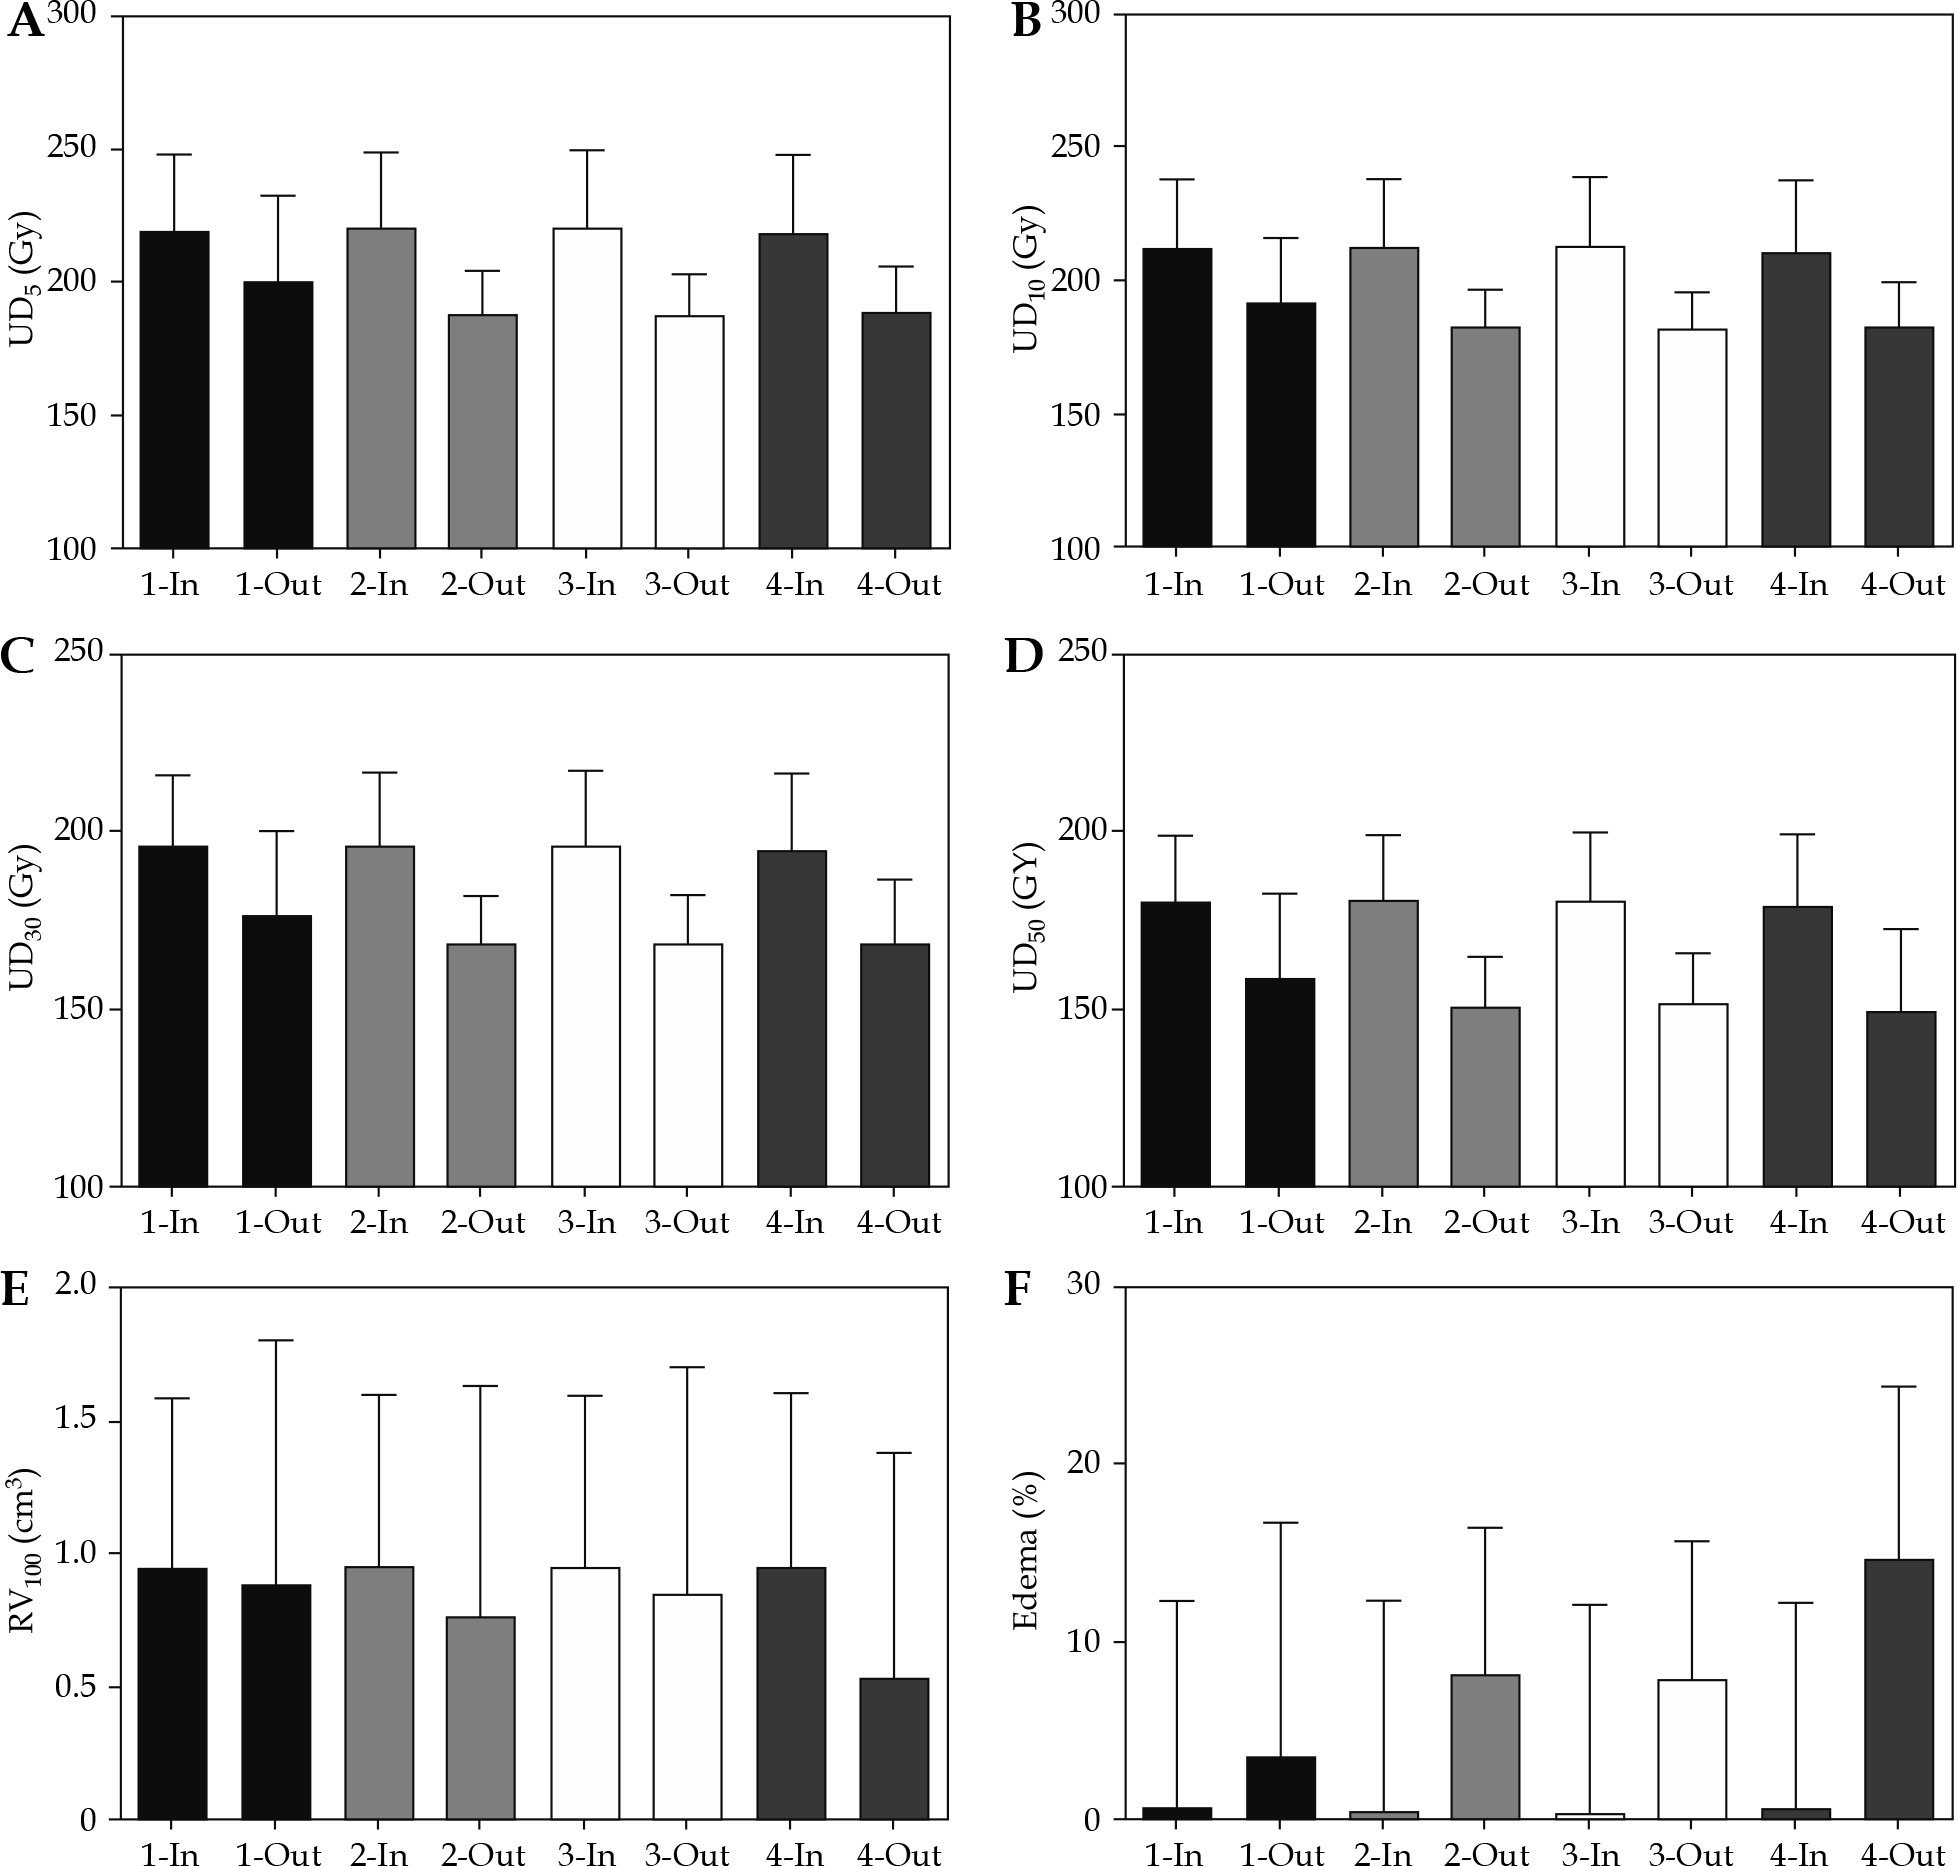
Post-implant dosimetry revealed higher V200, V150, V100, V90, V80, CTV V200, CTV V150, CTV V100, CTV V90, CTV V80 (Figure 2); D100, D90, D80, CTV D100, CTV D90, CTV D80 (Figure 3); UD5, UD10, UD30, and UD50 (Figure 3A-D) among patients in-control compared with patients out-of-control, with differences reaching statistical significance for most of the parameters (Table 1). RV100 was not statistically significantly different between patients in-control and patients out-of-control on all the univariate as well as on the multivariate control charts (Table 1, Figure 4E). Average persistent prostatic edema was lesser in patients in-control as compared with patients out-of-control on all the control charts, and this difference reached statistical significance only in the V100 and D90 control charts (Table 1, Figure 4F). For the multivariate control chart, prostatic edema was not statistically significantly different between the 150, and the 12 patients found to be in-control and out-of-control, respectively. Ten out of the 12 patients, who were found to be out-of-control on the multivariate control chart, were observed to be out-of-control on the V100 control chart. There was a statistically significant difference in prostatic edema in those 10 patients compared with the rest of the 152 patients (Figure 4F). Interestingly, the two patients found to be out-of-control on the multivariate control chart but not on the V100 univariate control chart, had prostatic edema of –19.1% and –20.1%, namely, there was a reduction in prostate volume at one month after the seed implant compared with the prostate volume during pre-implantation investigations.
Fig. 2
Comparison between patients in-control and out-of-control on (1) Multivariate control chart; (2) Both multivariate and V100 univariate control charts; (3) V100 univariate control chart only; and (4) D90 univariate control chart. A) V200; B) CTV V200; C) V150; D) CTV V150; E) V100; F) CTV V100; G) V90; H) CTV V90; I) V80; J) CTV V80
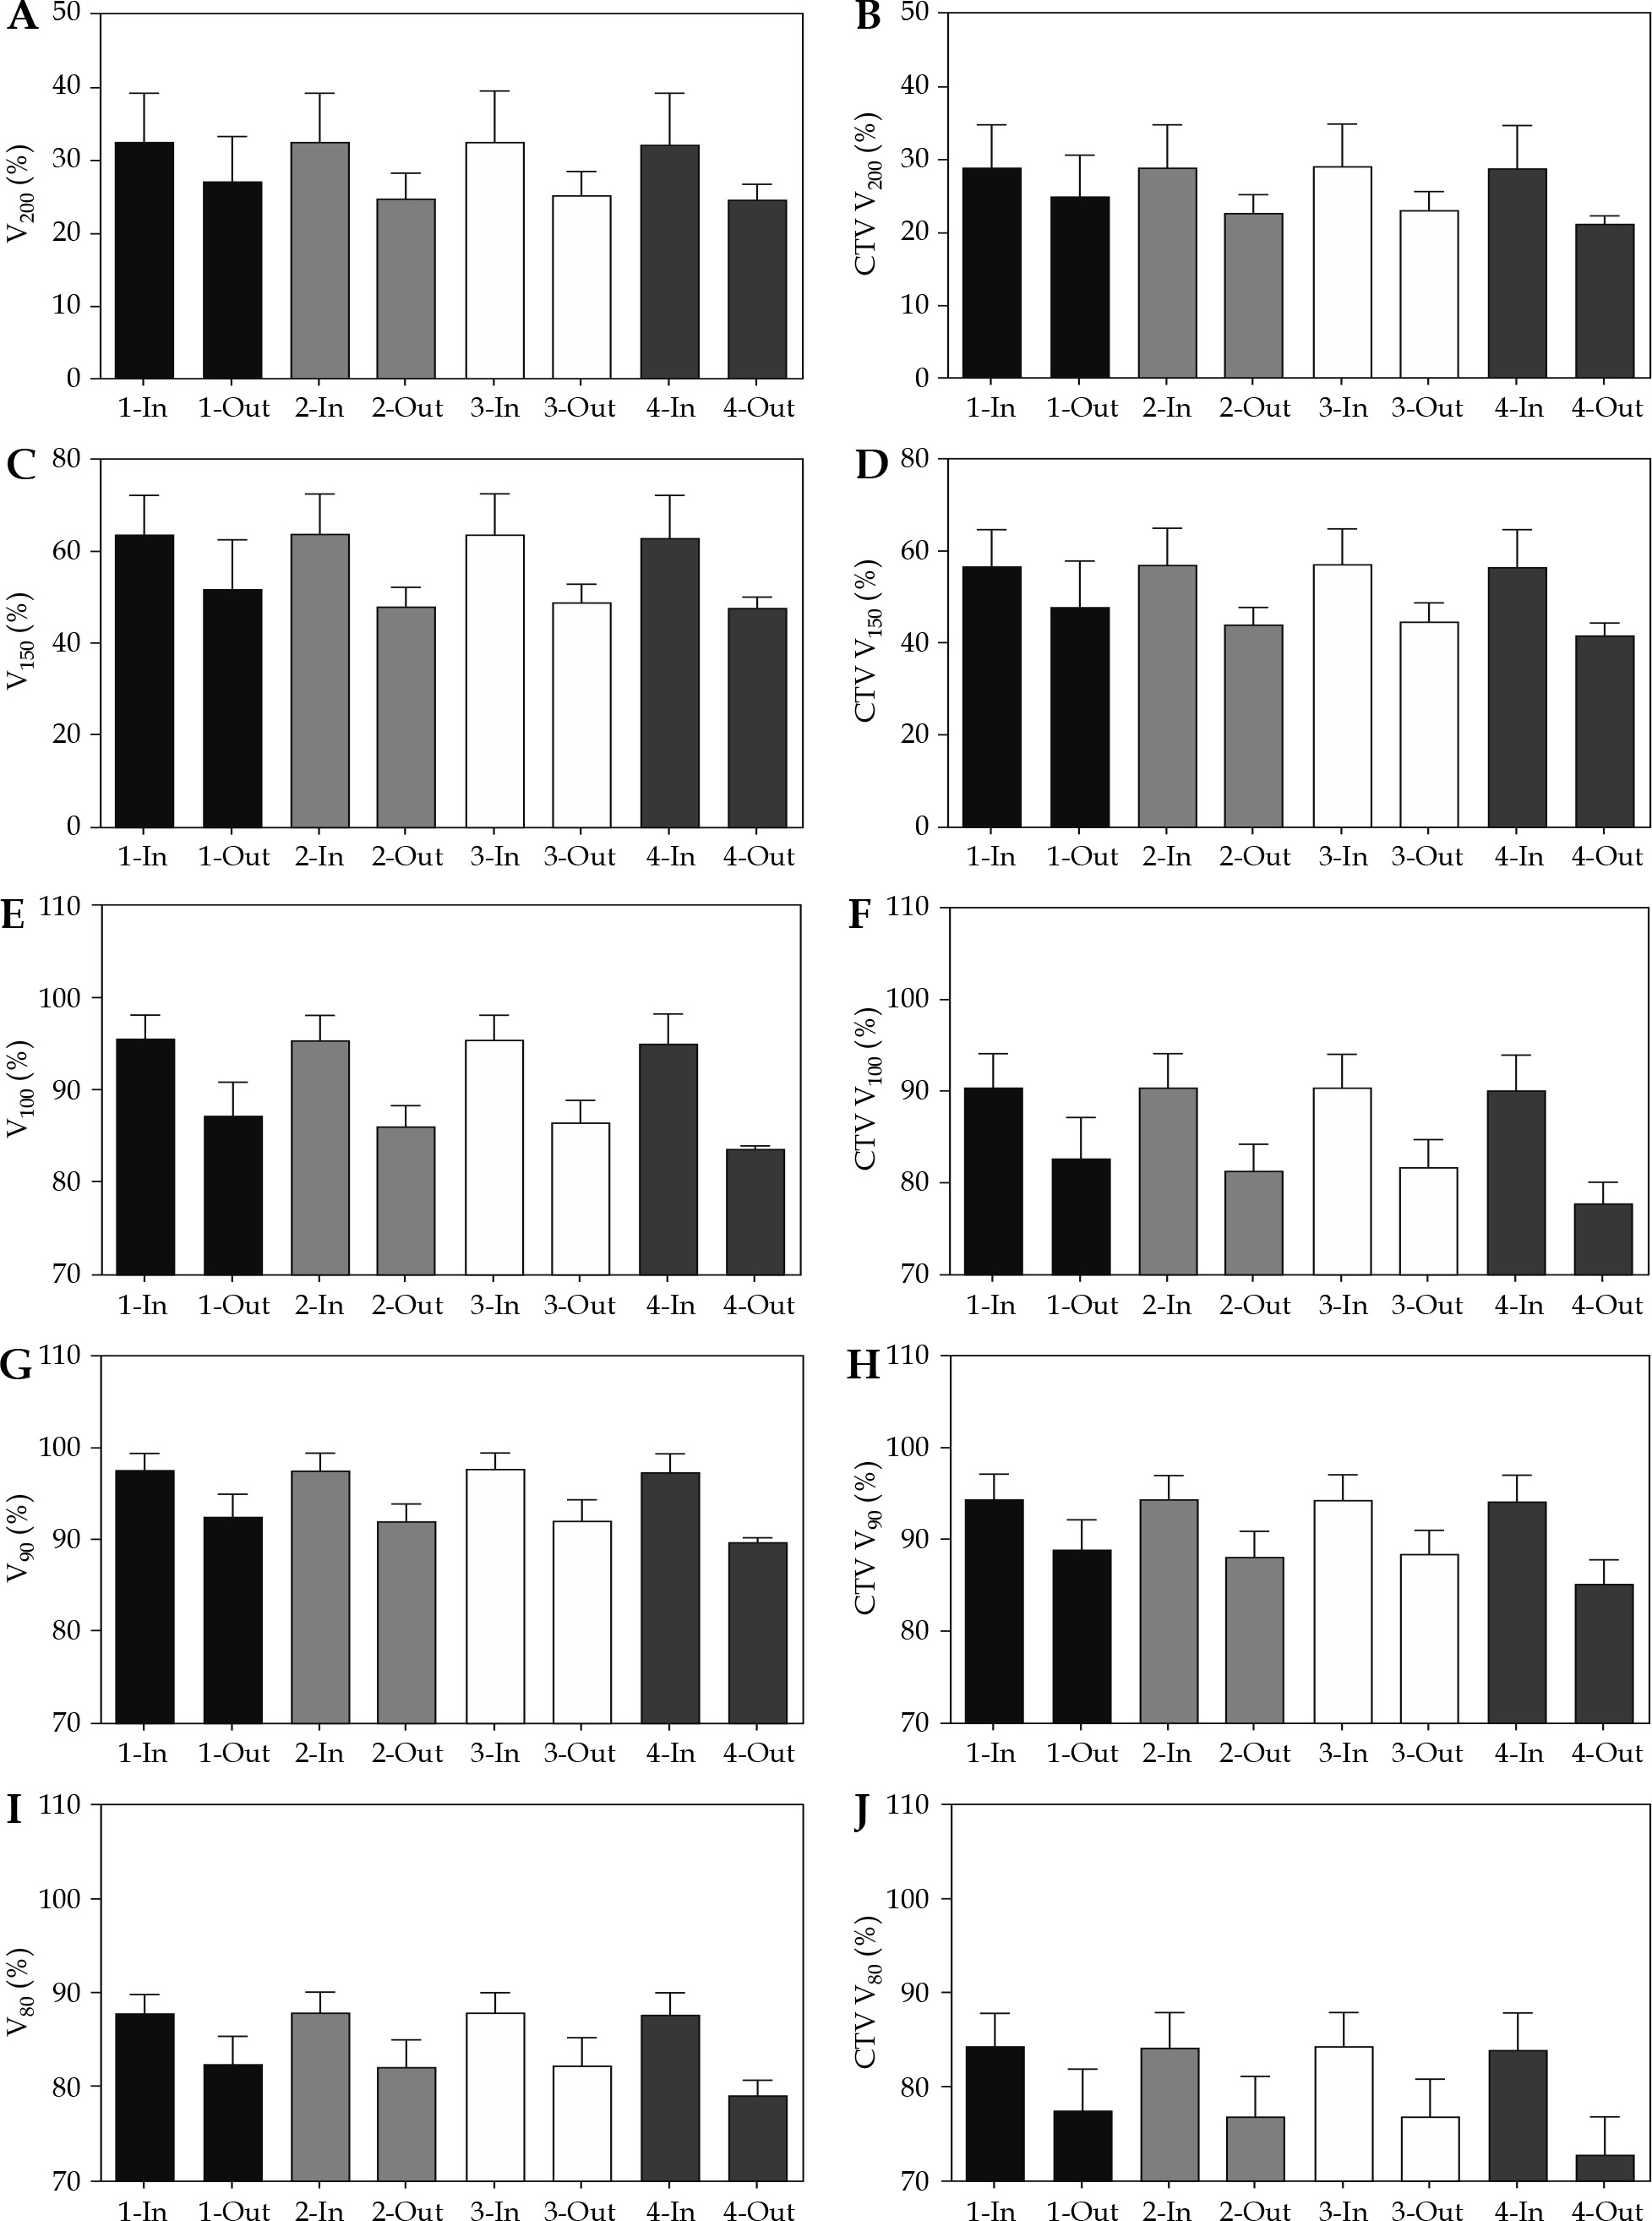
Fig. 3
Comparison between patients in-control and out-of-control on (1) Multivariate control chart; (2) Both multivariate and V100 univariate control charts; (3) V100 univariate control chart only; and (4) D90 univariate control chart. A) D100; B) CTV D100; C) D90; D) CTV D90; E) D80; F) CTV D80
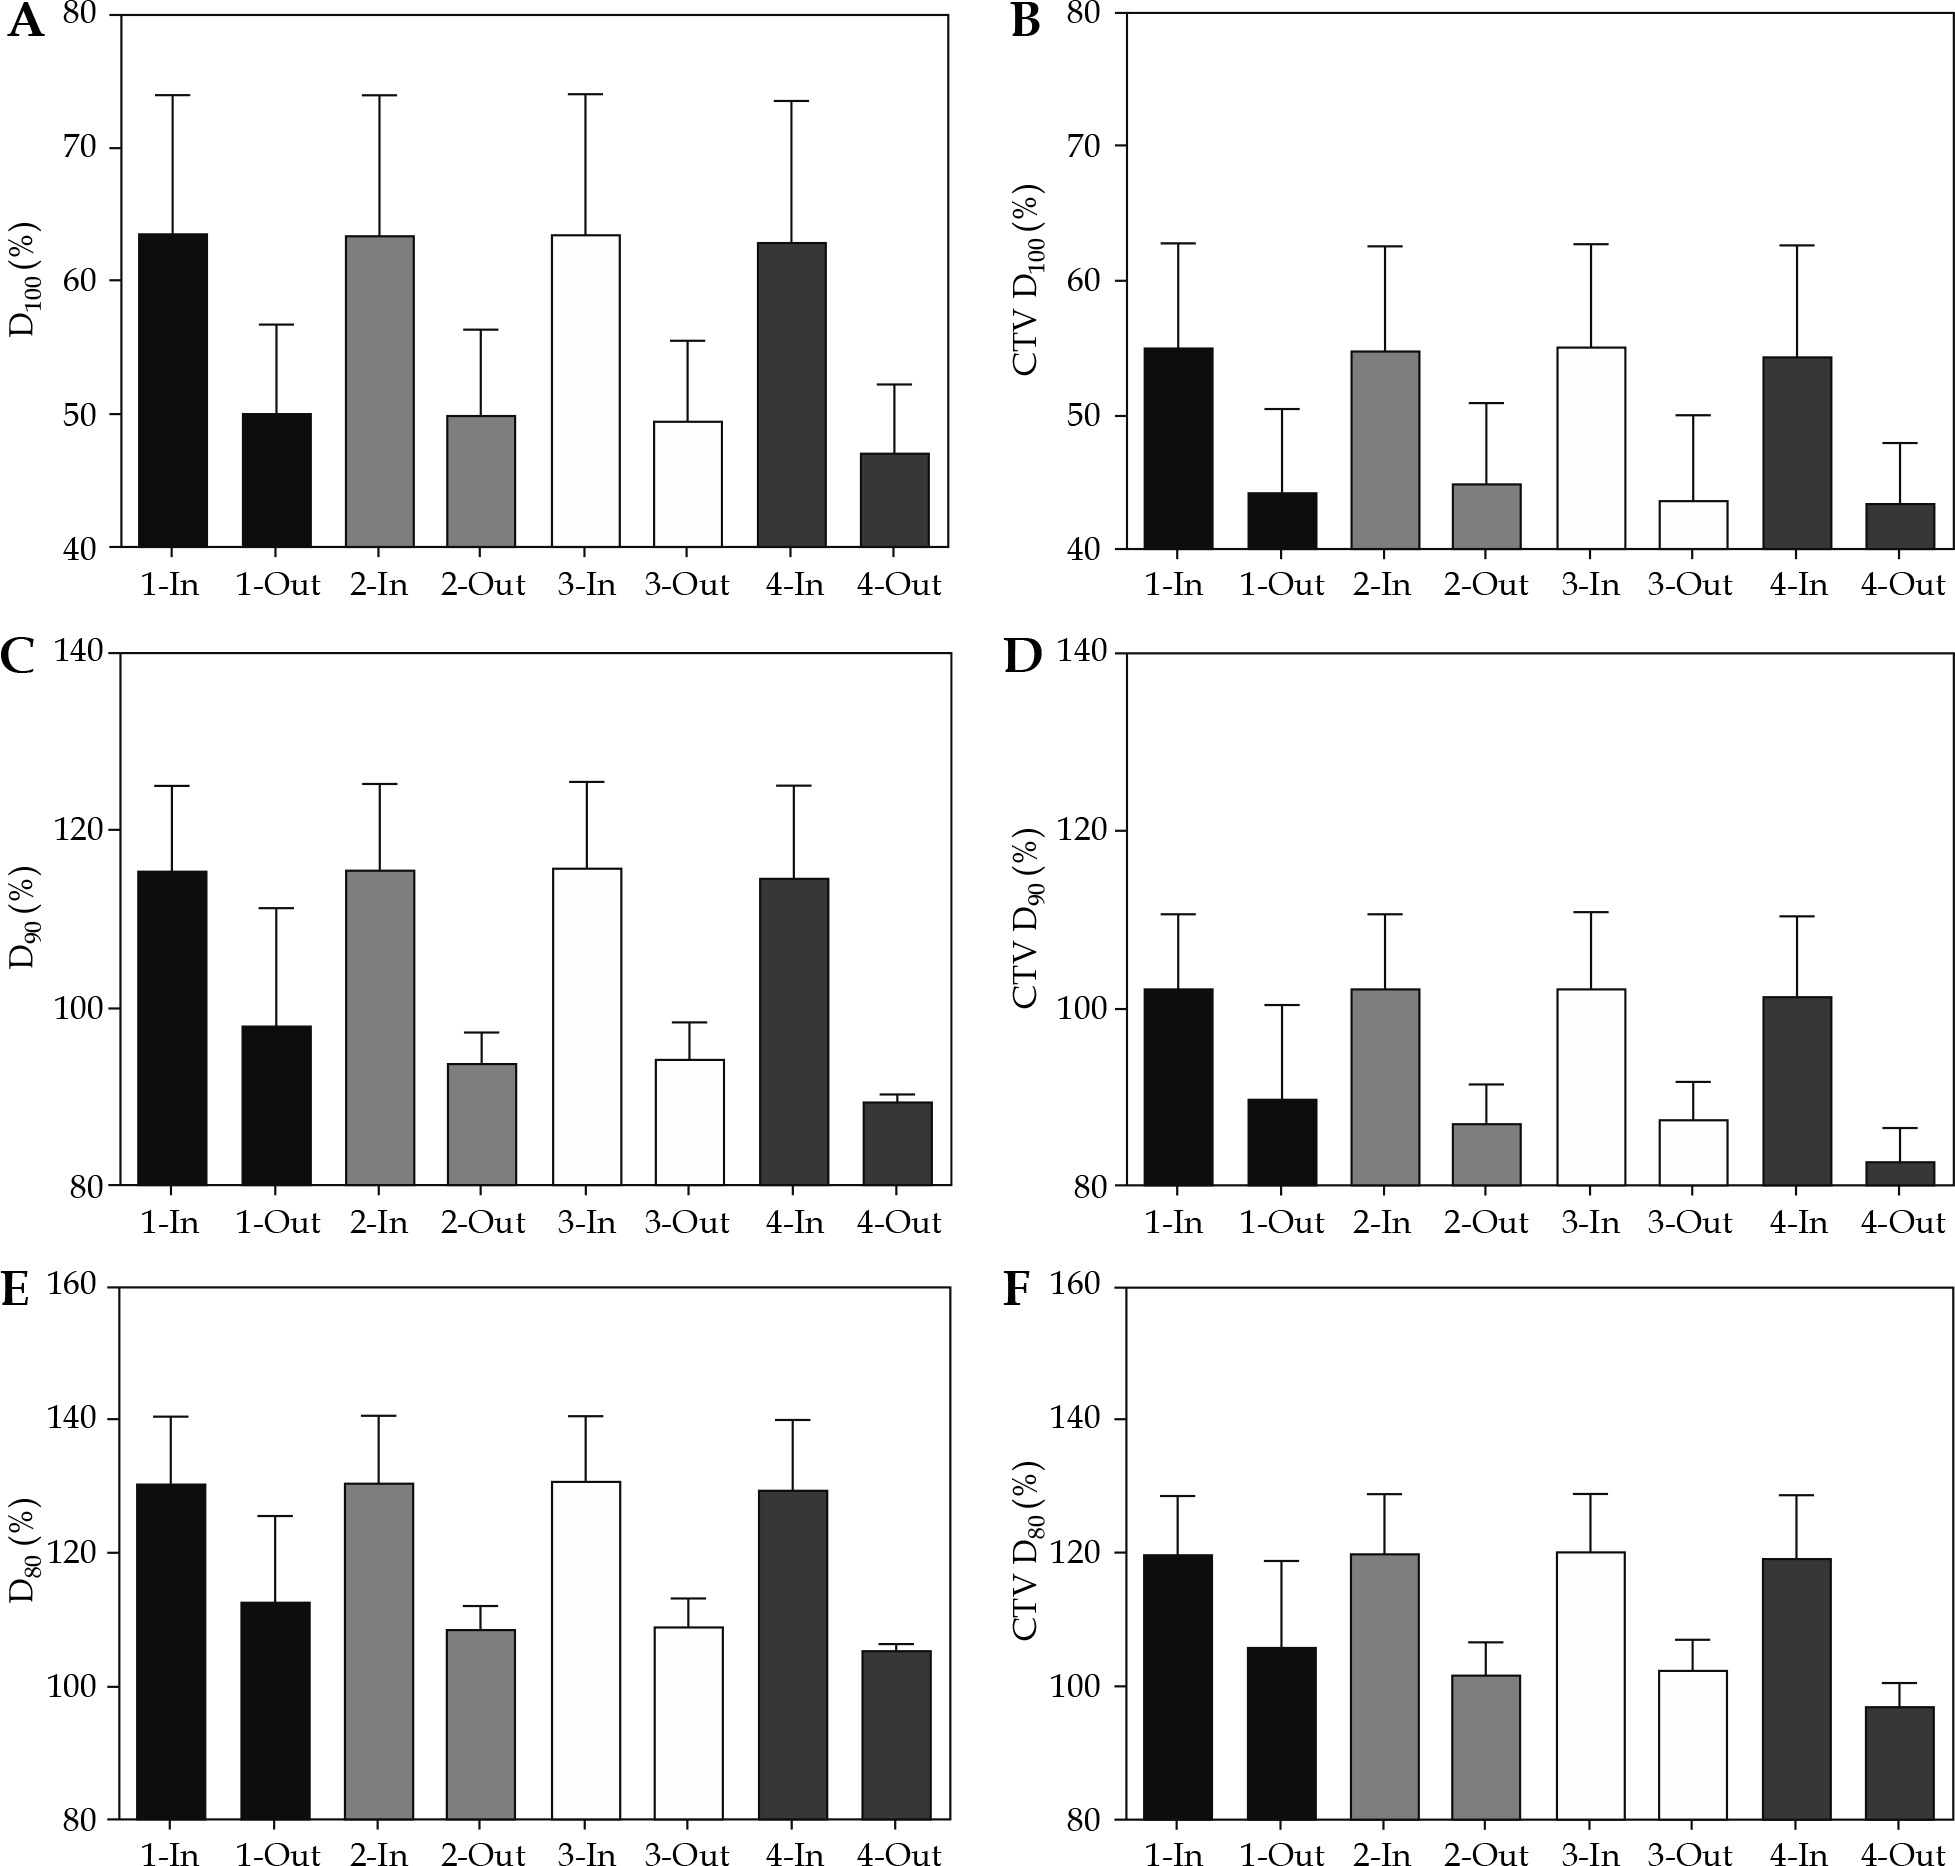
Fig. 4
Comparison between patients in-control and out-of-control on (1) Multivariate control chart; (2) Both multivariate and V100 univariate control charts; (3) V100 univariate control chart only; and (4) D90 univariate control chart. A) UD5 (Gy); B) UD10 (Gy); C) UD30 (Gy); D) UD50 (Gy); E) RV100 (cm3); F) Prostate edema
Discussion
Parameters that are typically used to evaluate prostate implant quality were tracked using univariate and multivariate control charts. A multivariate control chart combining three post-implant measures, such as V100, D90, and RV100 were feasible to implement. Multivariate control chart identified patients with prostatic edema as well as patients with significant reduction in prostate volume following the seed implantation procedure.
Control charts show the mean and variation within a process, which is distinct from whether the process meets standards of acceptability. In this cohort of patients, all implants had met our institution’s standard for quality. Rather than monitor three univariate control charts, a multivariate chart, while computationally more difficult to use, has the advantage of simplicity of tracking a single value, in this case, Hotelling’s T2 statistic.
We previously showed that in 125I seed brachytherapy, the prostate base receives a lower dose, and the apex receives a higher dose compared to pre-implant planned dosimetry [32]. Post-plan V100 is deemed acceptable when it is greater than 85% [15], and experienced centers typically plateau at 90% or more [15]; V100 in this series was 95 ±3.25%. Although V100 was found to be out-of-control in 12 cases, it was within specification for all but five cases.
Post-plan D90 is specified to be above 90% [15, 16]. For the initialization of the control chart, the average was 118%. Of the three metrics studied, only this one has a symmetric distribution, as there is neither an upper nor lower bound to the achievable values. The data were out-of-control only below the center line, indicating that the implants were never unusually hot. Control limits for V100 are narrower than D90, as the upper limit for V100 can be only 100%. RV100 at 1-month dosimetry is ideally less than 1.3 cm3 [16]. At the Princess Margaret Cancer Centre, RV100 < 1.8 cm3 is considered acceptable, as the predicted proctitis ranges between 0-8% at this level [13]. Twenty-five implants did not meet this specification. Only a single run of data was out-of-control (ten implants less than the central line); however, lower values are desirable for this metric. None of the data points were above specification and out-of-control.
Post-implant dosimetry and prostate edema
Post-implant dosimetry showed that patients in-control had more ‘hot’ implants compared with patients’ out-of-control (Figures 2-4). This is seen with regard to metrics relating to the prostate, and the prostatic urethra. Acute prostate inflammation and edema are expected after seed implantation [27]. We have shown that patients with statistically significantly increased prostate edema at 1 month post-brachytherapy had more sub-optimal dose coverage to the prostate CTV [27]. Prostatic edema that was inspected at one-month dosimetry in patients who were out-of-control could be due to prolonged response to intra-operative mechanical injury, radiation-induced prostatitis, or inherent host response factors. Parameters related to the seed implantation process, which may affect edema and were not taken into consideration, include needle punctures that were not successful, and prompted repeated insertion of the needles before seed deposition, and seeds migration within the prostate. Control charts of urethral metrics were not included in the current study, and worth investigating in the future. Prostate edema could explain the lower dosimetry parameters found in out-of-control patients.
Underlying the application of statistical process control to the LDR procedure is the requirement to view the implants as a process, a sequence of inputs and tasks whose goal is a desired outcome. The implant process includes factors that could have predicted the variability, such as pubic arch interference, quality of ultrasound visualization, number of needles inserted, and accuracy of needle insertion during the operative process. It is common to evaluate implants only as regards as to whether or not they fall within or outwith specifications. This binary sorting eliminates an opportunity for quality improvement. To improve the implant process, sources of special cause variability must be identified and eliminated. Plotting planning parameters on control charts identifies those implants that may be a subject to special cause variation, creates an opportunity to reduce variability, and thereby, increase quality of future implants.
In the present study, two patients were found to have reduction in prostate size after prostate brachytherapy. Reduction of prostate volume could be as a result of radiation [33], though contouring errors could not be totally excluded. Previous study by King et al. [34] showed that there is a significant decrease in mean prostate volume of 10.9% from the first to the final day of external beam radiation therapy. Nichol et al. reported that during external beam radiation therapy, the prostate volume decreased by 0.5% per fraction [35].
Conclusions
Control charts helped in identifying the cases, which had uncontrolled variability. Post-treatment prostatic edema is an important factor predicting this in patients treated with 125I permanent brachytherapy. Multivariate control chart identified patients with prostatic edema as well as patients with significant reduction in prostate volume one month following the seed implantation procedure.
Supplementary Material is available on journal’s website.


