
Purpose
Adjuvant radiation therapy plays a key role in the postoperative management of parotid gland cancer [1, 2]. In postoperative adjuvant brachytherapy for parotid gland cancer, the clinical target volume (CTV) is delineated manually by radiation oncologists on the basis of clinical examinations, surgical reports, and imaging studies such as computed tomography (CT) and magnetic resonance imaging (MRI) scans. The radiation source, typically radioactive iodine-125 (125I) seeds, is permanently implanted into the tumor bed and its surrounding tissue, typically within 6 to 8 weeks following partial parotidectomy. The implantation is guided by CT to ensure precise localization. This approach allows for the delivery of high-dose radiation to the target area while minimizing exposure to adjacent healthy structures. However, the quality and efficiency of CTV delineation may vary due to differences in the experience levels of radiation oncologists and the criteria used in different cancer centers [3]. Observer differences arise chiefly at the superior/inferior limits and parapharyngeal-masseteric fascial planes, where postoperative scar-fat replacement obscures anatomic landmarks, and at low-contrast bone–soft-tissue junctions near the mandible and external auditory canal. Although numerous studies have attempted to set uniform standards for CTV delineation to standardize this process and improve its reproducibility [4, 5], improving the delineation efficiency has not received adequate attention. At our treatment center, delineating the target area in the postoperative parotid region typically takes 30 to 60 min.
The use of automated segmentation methodologies in radiotherapy can alleviate the burden of labor-intensive tasks traditionally performed by radiation oncologists. Furthermore, this innovation can enhance the accuracy, consistency, and reproducibility of delineating CTVs [6-8]. Currently, atlas-based automatic segmentation algorithms are widely used in commercial treatment-planning software. However, accurately segmenting complex anatomical structures remains challenging for algorithms that rely on anatomical atlases. These challenges are primarily attributable to the presence of indistinct boundaries, signal inhomogeneities, and various forms of noise, which complicate the segmentation process [9]. Atlas-based auto-segmentation is especially vulnerable here because patient-specific postoperative scar and cavity deformation violates the anatomical correspondence required for accurate deformable registration, causing propagated boundary drift and larger manual correction needs. Additionally, automatic contouring in the head and neck region faces unique challenges due to significant anatomical variability arising from patient positioning factors, including variations in mandibular elevation, oral opening, and vertebral curvature changes. Such variability considerably alters the anatomical representation of structures such as the parotid gland in axial CT images, often posing substantial difficulties for commercial segmentation systems such as RayStation, as previously highlighted by Hirotaki et al. [10].
Alongside the rapid advancements in deep learning within the realm of medical imaging, auto-segmentation algorithms based on deep learning paradigms have shown noteworthy advancements in tasks associated with medical imaging segmentation. Compared with nnU-Net or TransUNet, a 3D Res-UNet was selected because its residual connections stabilize gradient propagation and help recover blurred postoperative boundaries, while deep supervision refines irregular cavities across multiple scales. Even in cases showing significant variations in the size or shape of organs in the CT images to be segmented, deep learning can yield excellent segmentation results by increasing the number of training cases [11]. For instance, Lin et al. [12] employed a 3D CNN for automatic segmentation of gross tumor volumes in MRI scans of patients with primary nasopharyngeal carcinoma and found that the similarity between the automatically segmented dataset and the manually delineated dataset was 79%, while the similarity between manually delineated target volumes was lower (74%). Multiple studies have demonstrated the potential of deep learning technology in automatic segmentation of target volumes and organs at risk [13, 14]. Li et al. [4] also confirmed that a deep learning-based organ at risk (OAR) auto-segmentation model demonstrated high efficiency and good agreement with gold-standard manual contours. This novel approach thereby holds potential for expediting the treatment planning process of brachytherapy for parotid gland cancers, while allowing for more accurate radiation delivery to minimize toxicity. Despite the precision achievable in delineating organs at risk (OARs) with well-defined contours, the clinical target volume (CTV) for postoperative adjuvant brachytherapy in parotid gland cancer presents substantial variability and increased complexity, accompanied by considerable interpatient variations. The variability is driven by scar–fat replacement eliminating clear margins, patient-specific cavity geometry, low-contrast fascial/bony interfaces, and differing margin philosophies. The aim of this study is to establish a deep learning network model for automatic segmentation of the CTV during postoperative brachytherapy for parotid gland cancer, generating consistent, high-quality contours that streamline and support a physician-supervised radiation treatment planning workflow.
Material and methods
Clinical data
This study was conducted with a cohort of 326 patients diagnosed with carcinoma of the parotid gland. Patient selection was based on inclusion-exclusion criteria (Table 1). These individuals underwent surgical excision as an initial therapeutic measure, followed by adjuvant therapy using 125I seeds (Model 6711; fabricated by Beijing Atom and High Technique Industries Inc., Beijing, China), with initial activity levels ranging from 22.2 to 29.6 MBq (0.6-0.8 mCi) upon implantation [15]. Patients treated with postoperative brachytherapy for parotid gland cancer between January 2017 and December 2023 at the Peking University School and Hospital of Stomatology were included in this study. The demographic and tumor baseline characteristics of all 326 eligible patients are summarized in Table 2.
Table 1
Inclusion and exclusion criteria
Table 2
Baseline characteristics of the study cohort (n = 326)
Postoperative CT was performed 3-4 weeks after surgery to permit resolution of early edema and artefacts still remaining within the standard timeframe for adjuvant planning. The CT images were obtained with a matrix size of 512 × 512 and a slice thickness of 2 mm. The post-operative therapeutic strategy for each patient was devised using a brachytherapy planning system (BTPS; Beijing Astro Technology Ltd. Co., Beijing, China) on the basis of these CT images.
Each acquired image was delineated in the axial plane. Subsequently, the aggregated datasets were subjected to random division, with 65.3% (n = 213) of the instances allocated to a training cohort. This cohort was used for the development and training of the anticipated analytical model. Additionally, 16.3% (n = 53) of the instances were allocated to a validation cohort for model tuning, and the remaining 18.4% (n = 60) constituted a test cohort. The predictive accuracy was reported based on the testing dataset.
The study protocol was approved by the Medical Ethical Committee of Peking University School and Hospital of Stomatology (No. PKUSSIRB-202385019). Due to the retrospective nature of the study, the need to obtain informed consent and approval was waived by the committee. All methods were performed in accordance with relevant guidelines and regulations.
CTV delineation in the training and validation sets
For each patient, the tumor bed was first identified on postoperative CT/MRI – supplemented by surgical reports – and then uniformly expanded by 1 cm, an approach analogous to postoperative breast brachytherapy, to define the clinical target volume (CTV). The CTVs of the primary tumor were manually delineated on CT images by two radiation oncologists with five and 16 years’ experience in parotid cancer treatment planning. Before delineation, both radiation oncologists underwent consistency training, which involved delineating the brachytherapy CTVs of five cases not related to this study. During the training, the radiation oncologists discussed the delineation procedures and standards to reduce the variations in target volume dimensions.
In the first phase, radiation oncologist A, with five years’ experience, delineated the CTVs over the post-surgical parotid bed on the TPS system while using the preoperative images for reference. In the second phase, all contours were reviewed by the more senior radiation oncologist B and were modified when necessary. A total of 7780 layers of CTV contours from 266 cases of postoperative brachytherapy for parotid gland cancer were delineated for the training and validation sets of the deep learning model.
Construction of an automatic CTV segmentation model
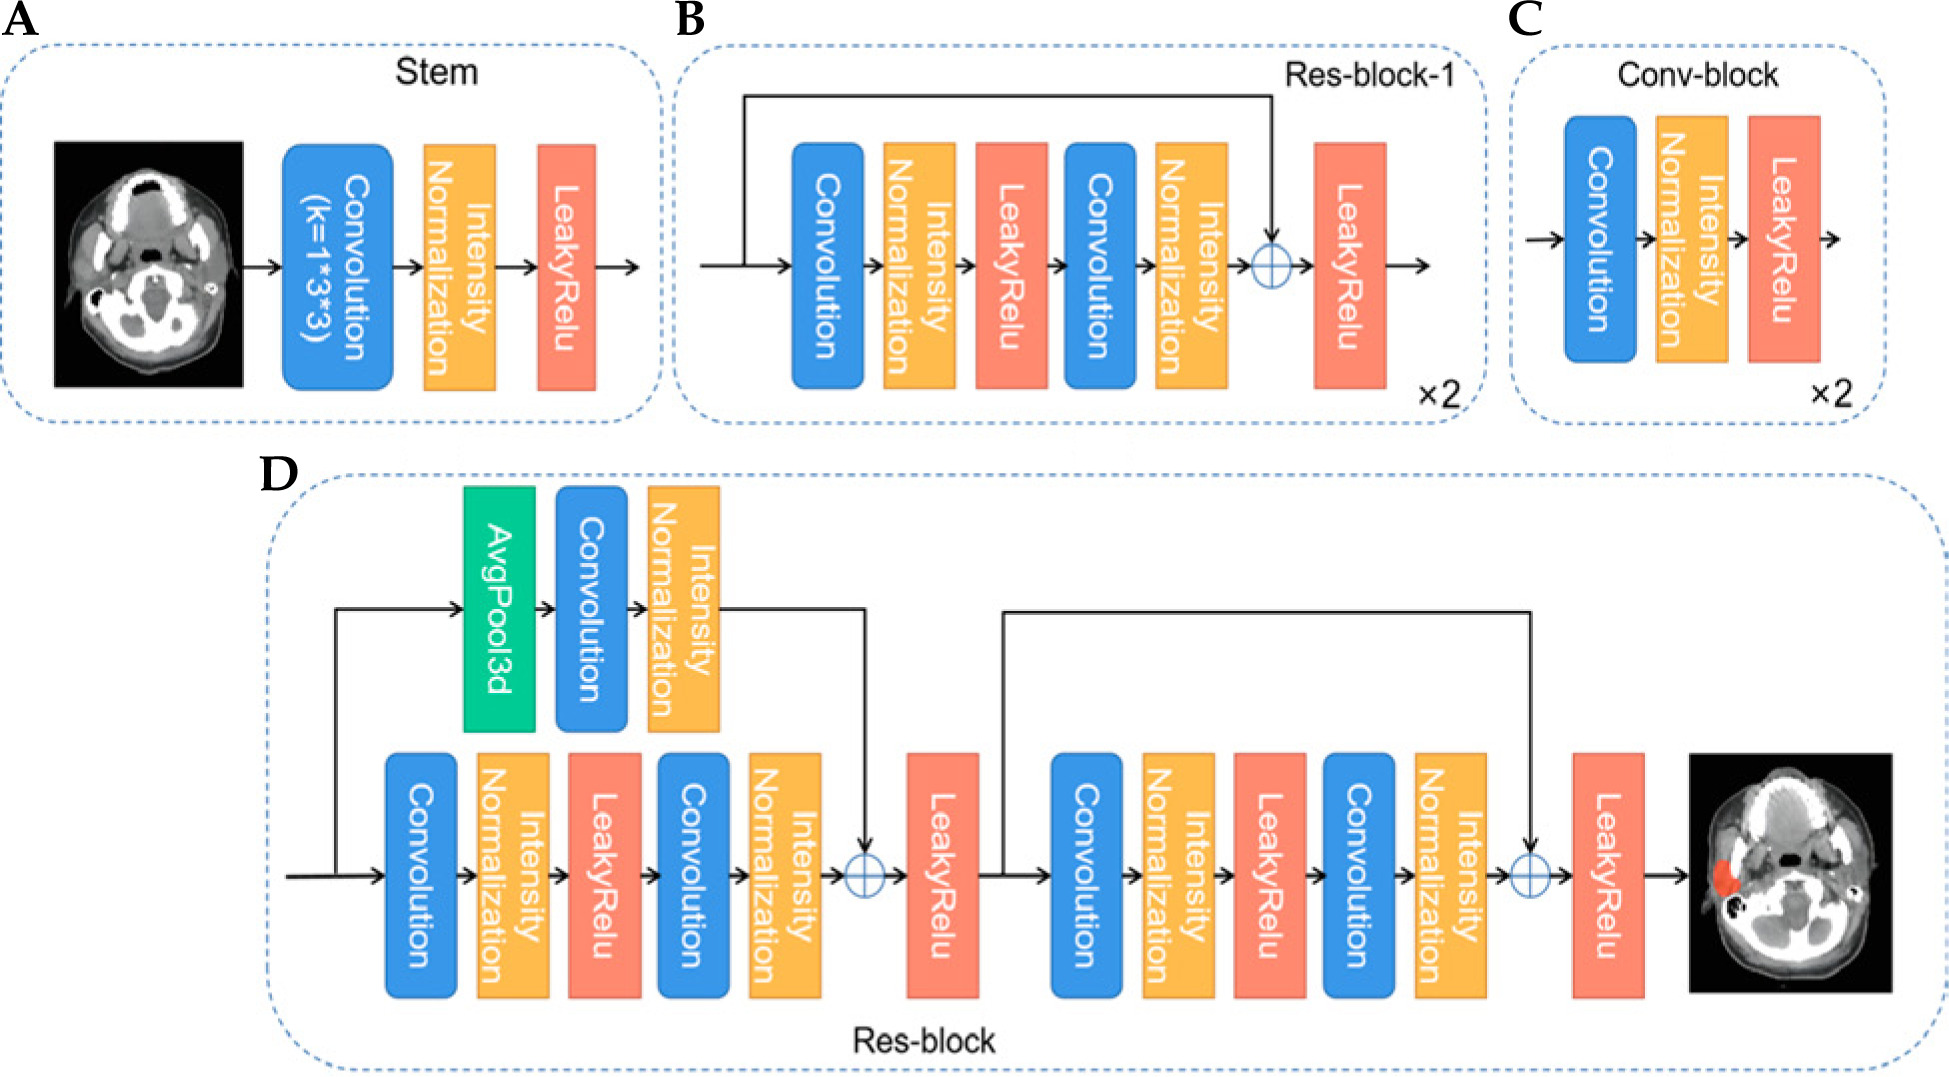
The 3D Res-UNet network structure is shown in Figure 1. U-Net is one of the most advanced open-source frameworks in the field of medical image segmentation and is considered the best baseline model for deep learning-based medical segmentation [16]. Given the structural complexity and blurred boundaries of the parotid gland target region, we employed an enhanced version of U-Net, the Res-UNet network, to improve segmentation accuracy and handle these challenges effectively. Res-UNet builds upon the U-Net architecture by incorporating residual connections to enhance feature learning and mitigate issues related to network depth. While Res-UNet has been previously employed in medical image segmentation [17], it remains an effective model for handling complex structures with residual connections that help mitigate the vanishing gradient problem. The net-work preprocesses the input data by trimming, resampling, and normalizing based on its characteristics. This model consists of an encoder and a decoder path, with skip connections between them. Due to the limited batch size of the 3D network, intensity normalization layers are selected, and leaky rectified linear units (leaky ReLU) are used for activation. The encoder path mainly consists of residual blocks, while the decoder path consists of convolutional blocks. Specifically, as shown in Figure 2, we first use a stem (Figure 2A) to extract input features, increasing the feature dimension to 32, followed by a residual connection. The stem module serves to perform initial feature extraction and processing on the input, providing a solid feature foundation for the subsequent deeper network. This involves a series of convolution operations that enhance the input feature dimensions, enabling the network to capture more low-level feature information, which is crucial for learning complex structures and effectively preparing for the residual blocks and encoder parts. The residual block, as shown in Figure 2B and D, connects the input features with the features extracted by the convolution through residual connections, avoiding the bottleneck problems that may arise from excessive network depth and preventing gradient vanishing issues. We perform two residual connections at each scale to ensure sufficient feature learning. In Res-block-2 and beyond, downsampling is performed by setting the convolution stride. Therefore, to ensure the same size in the residual connection, we use average pooling in the first residual connection (left side of Figure 2D). In the decoder path, we perform a combination of convolution, normalization, and activation function twice at each scale to learn deep semantic information and use transposed convolutions to upsample and restore the feature map size. Additionally, in the decoder, a 1 × 1 × 1 convolution operation is applied to the feature map after each double convolution block, and a sigmoid function is used to generate the predicted probability map, which is then deeply supervised with the corresponding resolution ground truth map. The initial feature map is set to 32 and is doubled during downsampling, reaching a maximum of 320.
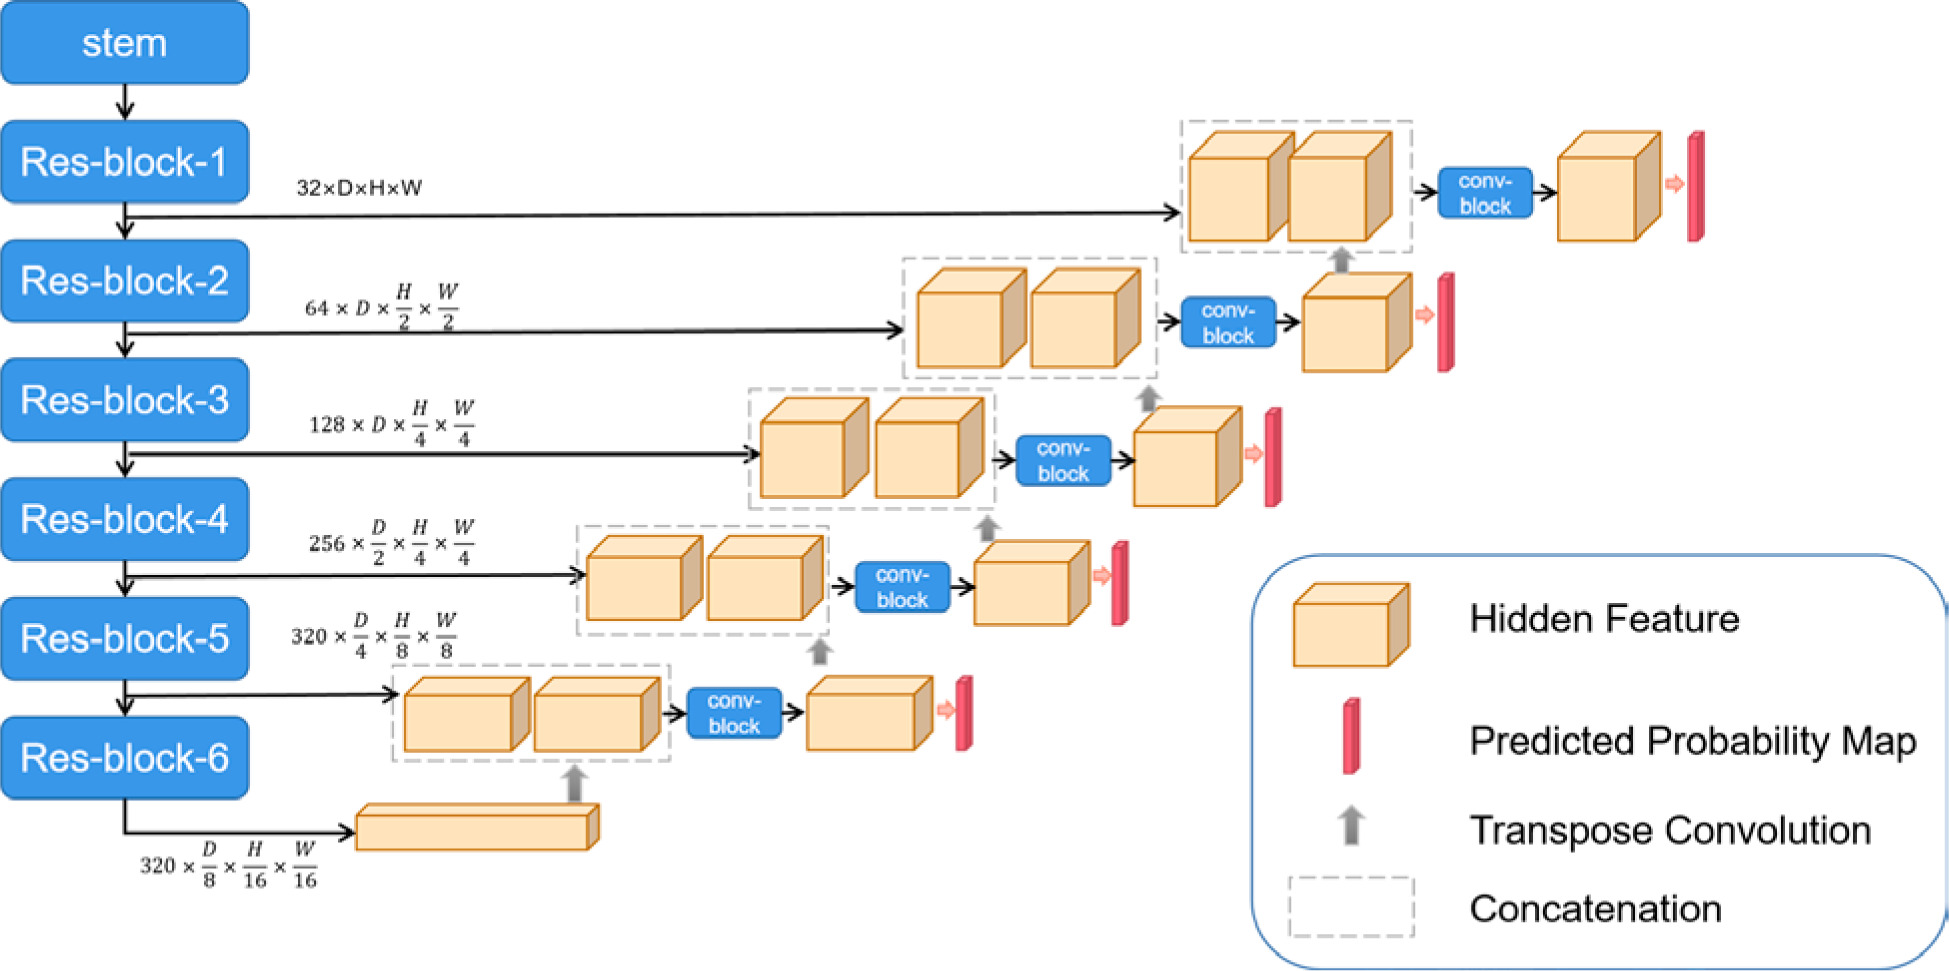
Fig. 2
Schematic diagram of the decoder and encoder paths. A) Stem module extracts input features, increasing the feature dimension to 32, followed by a residual connection. B, D) Residual blocks connect input features with the features extracted by the convolution, avoiding bottlenecks and preventing gradient vanishing issues. C) Average pooling and convolution module combines 3D average pooling and convolution layers to extract features and reduce dimensions
During the model construction phase, CT data from 266 patients were used for training and validation. All images were preprocessed before being input into the Res-UNet model, including resampling, normalization, data augmentation (mirroring, rotation, scaling), and cropping.
Loss calculation
The model was trained using a standard deep supervision scheme [18]. For each resultant output, the computation of loss was performed using ground truth segmentation masks that had been subject to downsampling, corresponding to each output. The loss function (L) was articulated using the following equation (Equation 1):
Where αd and βd were the weight coefficients, both assigned as 1 and 1 in this method; Ld represents the loss at the dth layer in deep supervision, with d∈(1,2,3,4,5).
The loss function (Ld) was defined as the sum of dice loss (Ldice) [19] and cross-entropy loss (Lce) [20]. Dice loss and cross-entropy loss were defined as follows (Equation 2):
Where yin and pin represent the actual segmentation ground truth labels and predicted segmentation labels for the ith pixel of the nth class. I and n represent the total number of pixels and classes, respectively.
Optimization of the model was conducted using a Stochastic Gradient Descent (SGD) optimizer augmented with Nesterov momentum for enhanced convergence properties. The commencement learning rate was calibrated to 1e-2 to balance the trade-off between convergence speed and stability. Furthermore, the optimization process was characterized by a batch size of 2, with an epoch delineated by 250 iterations of training. To ensure comprehensive learning, the termination criterion for the optimization process was established at a maximum of 1000 epochs. This computational endeavor was performed using a 24GB GeForce RTX 3090 graphics processing unit (NVIDIA), which offered substantial computational capacity. The software framework underpinning these operations was Python 3.10.13, with PyTorch 2.1.1 serving as the deep learning platform, thus providing a robust environment for model development and evaluation.
Test set delineation and automatic segmentation
Using preoperative images for reference, radiation oncologist A delineated the CTVs for the 60 cases in the test set using a commercially available brachytherapy planning system (BTPS; Beijing Astro Technology Ltd. Co., Beijing, China). Subsequently, radiation oncologist B reviewed the delineations and modified them as necessary, recording the time required for both delineation and modification. After training and validation of the deep learning model, the model with the best validation performance was applied to the 60 cases in the test set, and the time required for segmentation was recorded. Subsequently, the resulting CTVs were reviewed and modified by radiation oncologist B when necessary. The time required to complete the session, including the auto-segmentation and the modifications, was recorded.
Quantitative evaluation metrics
The output accuracy of the deep learning model was compared with the gold-standard manual delineations using an array of metrics, including the Dice similarity coefficient (DSC), Jaccard index, 95% Hausdorff distance (95HD), precision, and recall. Specifically, the DSC was used to articulate the volumetric congruence between the ground truth (A) and the segmentation achieved through deep learning methodology (B). This measure is mathematically represented in the literature as Equation 3, where values spanning from 0 to 1 denote the spectrum from non-existent to perfect overlap, respectively [21].
The Jaccard index is a pivotal metric for evaluating the congruence between datasets within the realm of algorithmic performance assessment. It is determined as the ratio of the intersection’s cardinality to the union’s cardinality concerning the sets A and B, as encapsulated in Equation 4. This metric provides a quantitative measure of similarity, facilitating the comparison of computational segmentation results against reference standards [22].
The Hausdorff distance (HD) is a distance-centric metric that is fundamentally designed to quantify the dissimilarity between two distinct datasets [23]. It is defined as the maximal distance from any given point within one dataset to the nearest point within the comparative dataset. Consequently, lower values of HD are indicative of greater accuracy in segmentation outcomes, suggesting a closer approximation to the target dataset.
Assessment of precision and recall was based on measurement of true positives (TPs), false negatives (FNs), and false positives (FPs) [24]. Precision was calculated as the quotient of TP over the sum of TP and FP (TP + FP) and provided a quantitative measurement of the exactitude of positive classifications. This metric is encapsulated in Equation (5).
Recall was determined as the fraction of TP relative to the sum of TP and FN (TP + FN) and served as a measure of the model’s capacity to correctly identify all actual positives. This relationship is formalized in Equation (6).
Subjective validation
For the qualitative assessment, datasets from the test group were evaluated by two experienced senior oncologists, each with over 20 years of clinical practice, following a blinded allocation to ensure impartiality. The quality of segmentation was appraised using a 4-point scale: 0 points indicated a severe defect characterized by large and conspicuous errors; 1 point was assigned for a moderate defect, where minor correctable errors were observed; 2 points denoted a mild defect with the presence of clinically negligible errors; and 3 points signified precise segmentation, necessitating no further modifications. Segmentation quality achieving a score of 2 or higher was classified as adequate for clinical utilization.
Results
Accuracy of CTV segmentation
Axial CT images of a representative case from the test dataset with manually and automatically delineated contours of the CTV are shown in Figure 3. The average results of quantitative statistical analysis for the 60 cases in the test dataset are presented in Table 3.
Fig. 3
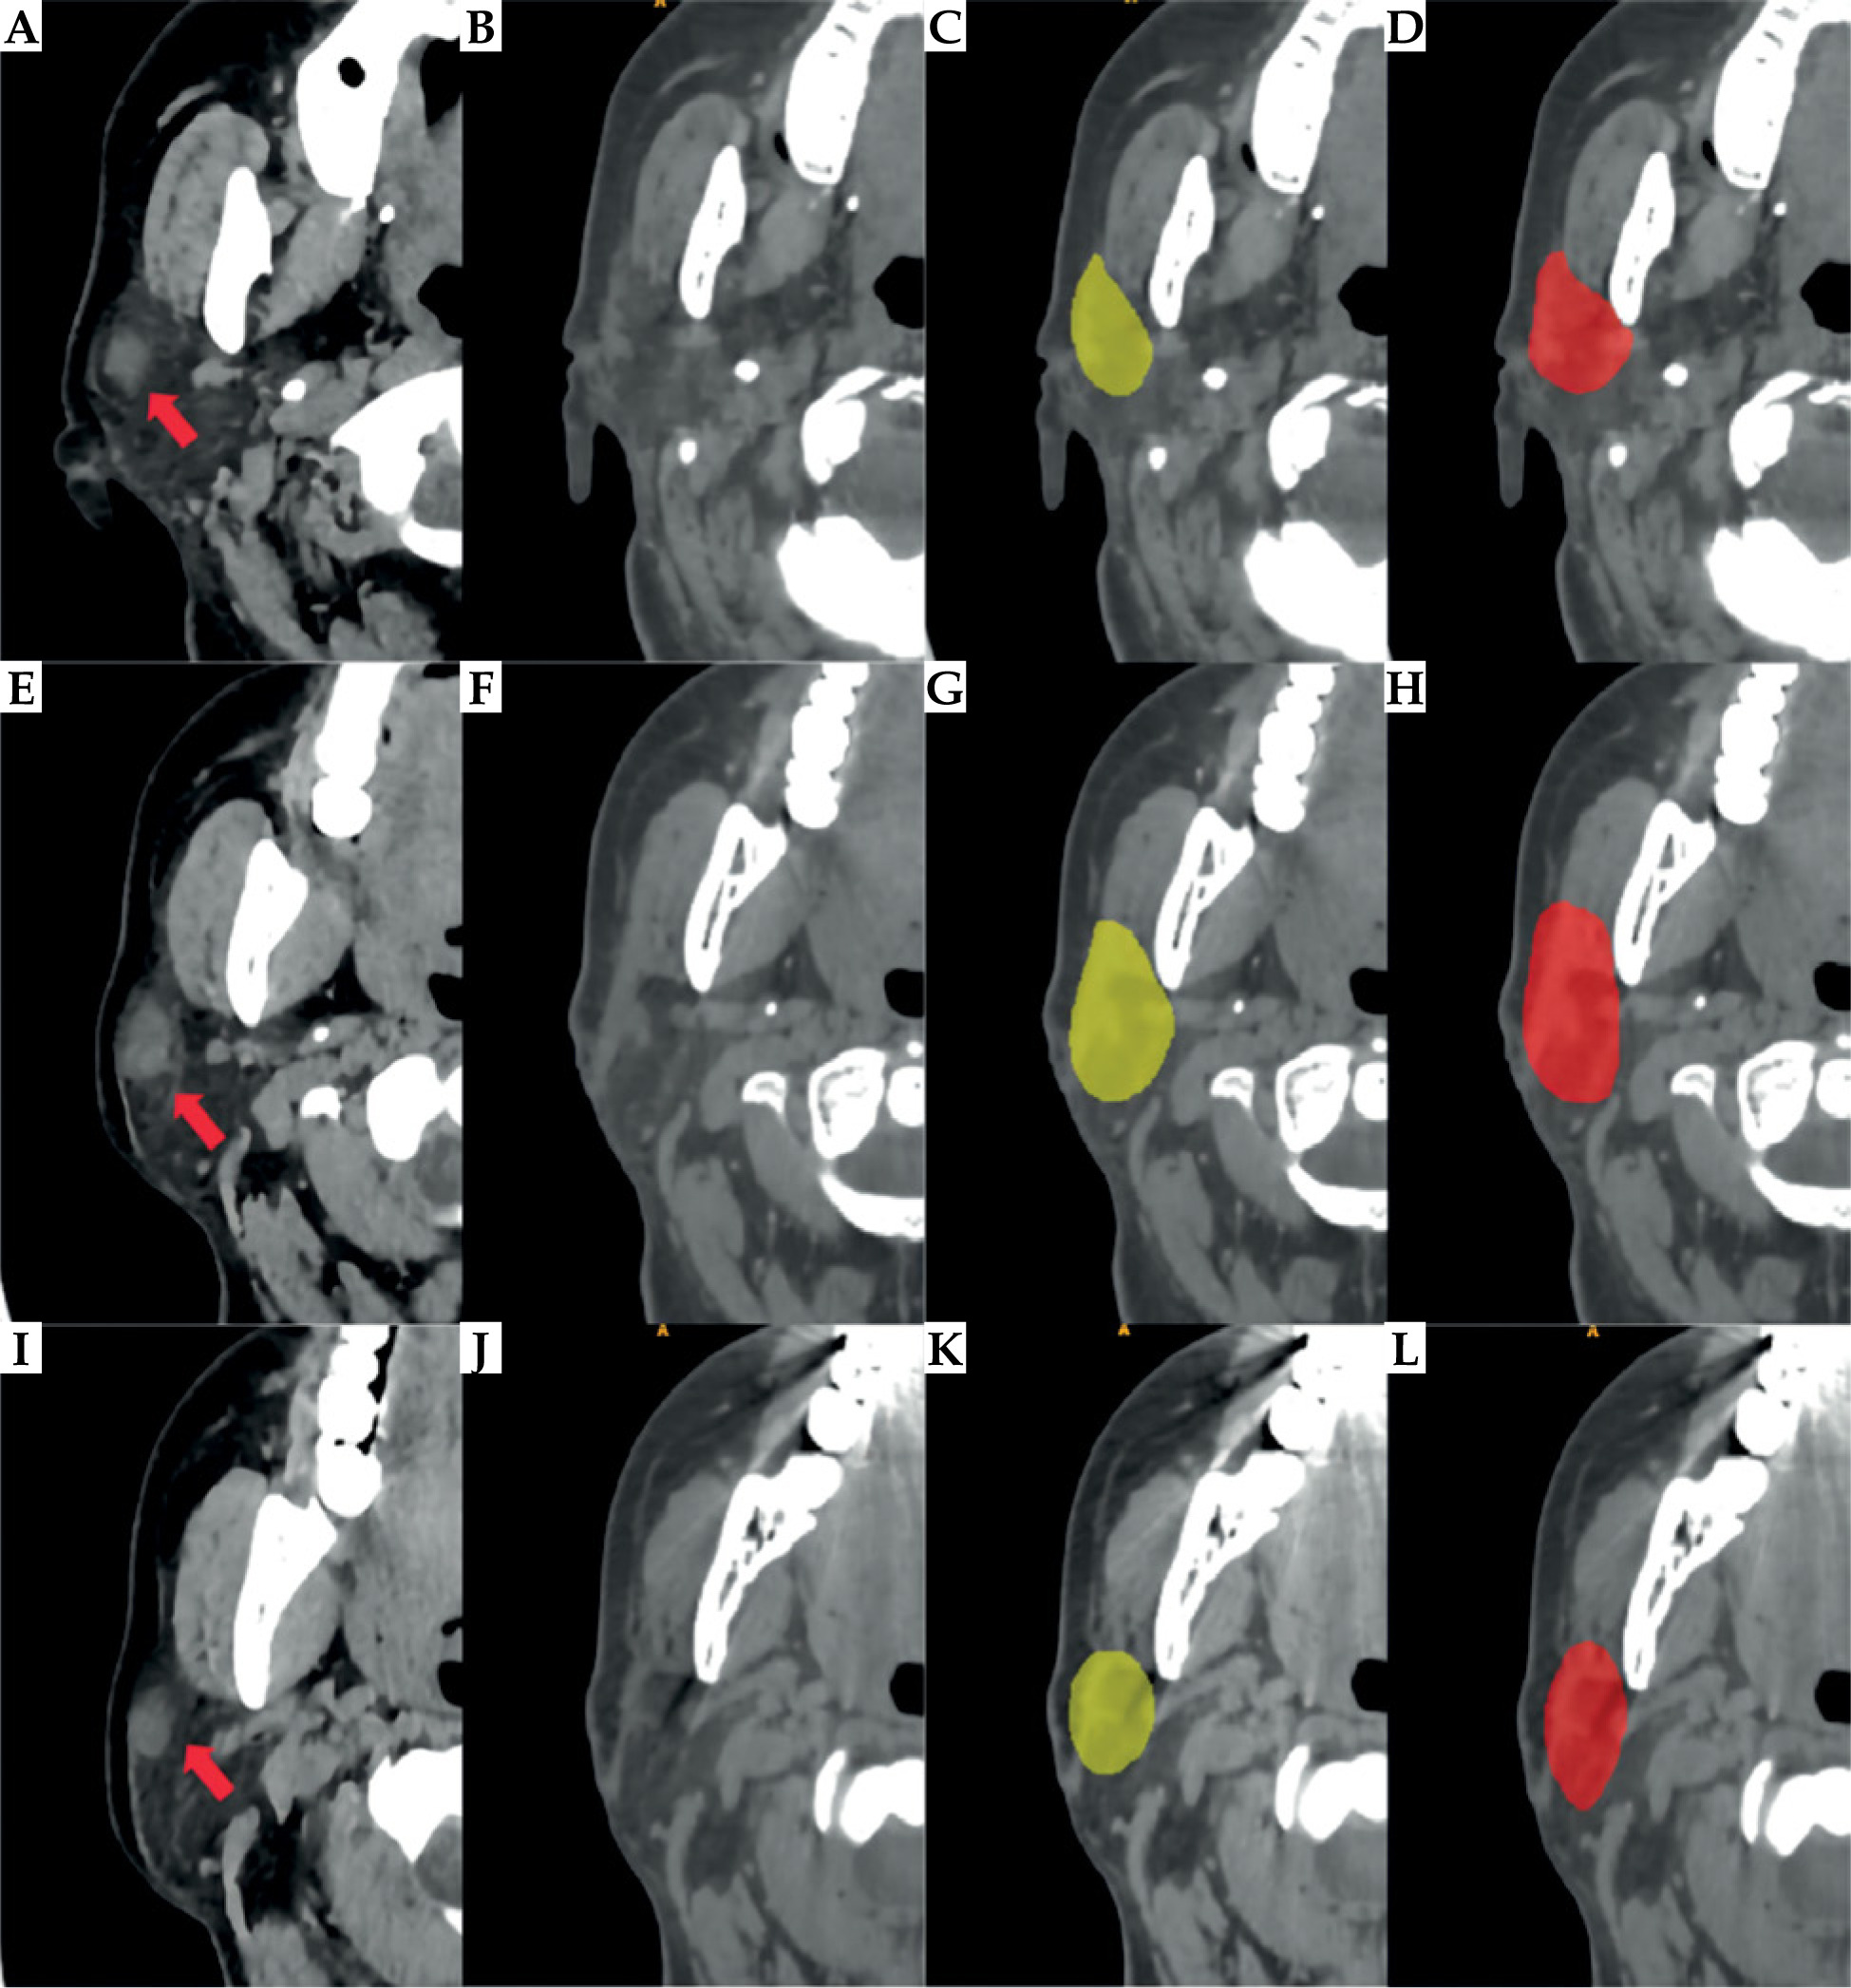
Comparison of CTV delineation performed by a radiation oncologist and the deep learning model. A, E, I) Different cross-sectional images from the preoperative CT scan of the same patient with parotid gland cancer; red arrows indicate primary tumor sites in parotid gland; B, F, J) Postoperative CT scan images, in which the contours of the original tumor are not visible. C, G, K) CTV delineated by the radiation oncologist; D, H, L) CTV automatically segmented by the deep learning model
Subjective validation
The qualitative evaluation was conducted by presenting the results of manual and automatic segmentation to two senior radiation oncologists, with the statistical results shown in Table 4. The data in the table represent the average scores of the 60 cases in the test dataset. For the manual delineations, the average scores assigned by radiation oncologists C and D were 2.90 ±0.06 and 2.92 ±0.05, respectively. The process required an average delineation time of approximately 46.7 minutes per case. For the automatically generated contours produced by the 3D Res-UNet model, radiation oncologist C assigned an average score of 2.54 ±0.11, while oncologist D’s average score was 2.65 ±0.09. The two experts’ mean scores for automatic contours (2.54 vs. 2.65) showed no clinically relevant difference; both exceeded the ≥ 2 acceptability threshold. The expert refinement phase was performed immediately after automatic segmentation by radiation oncologist B (16 years’ experience); the final delineations received average scores of 2.89 ±0.06 from radiation oncologist C and 2.92 ±0.04 from radiation oncologist D. The expert refinement phase required about 11.9 minutes per case, reducing the total time needed compared to purely manual segmentation, while maintaining scores comparable to manual delineation.
Table 4
Expert ratings for the three delineation methods
Although automatically generated contours received reasonably high subjective ratings, the automatic segmentations alone were not considered directly suitable for clinical use without expert refinement. In clinical practice at our institution, automatic segmentations serve as preliminary contours, always requiring subsequent physician review and modification prior to clinical implementation or dose distribution planning.
Segmentation time
The average time needed for CTV segmentation was 9.4 s using the deep learning model, while the average time for expert review after automatic segmentation was 11.9 min. In comparison, the traditional expert manual segmentation required 46.7 min. Manual refinements mainly extended thin lobulated margins at low-contrast scar-fat interfaces and trimmed occasional spill-over into adjacent bone/air spaces; residual edits involved minor smoothing and adjustment of superior-inferior limits.
Discussion
Deep learning algorithms have recently emerged as useful tools for medical image segmentation, which plays an essential role in medical image processing, particularly in applications such as radiation therapy planning, and is a critical task in many diagnostic and analytical workflows. The majority of research on medical image segmentation has focused on developing and employing automated segmentation tools, such as deep learning models, to reduce the workload of clinical doctors, expedite the delineation process, and enhance segmentation quality [25]. In this study, we developed an automatic segmentation model based on deep learning to delineate CTVs for brachytherapy performed after surgery for parotid gland cancer, and compared the results of automated segmentation with those obtained manually by radiation oncologists. The segmentation generated by this model was shown to approximate the expert segmentation (DSC = 0.709 ±0.105). The relatively large SD reflects case-to-case heterogeneity in postoperative anatomy (scar/fat replacement and cavity geometry) and the small, irregular CTV volumes, where a few missed or excess voxels disproportionately lower the Dice. Expert evaluation suggested that the CTV delineated solely by the deep learning model could be clinically applied with slight modifications. Moreover, when the model was used to support manual delineation of CTVs, it significantly reduced the delineation time and improved efficiency while achieving the same quality as expert-delineated CTVs (DSC = 0.924 ±0.031), indicating its potential for reducing the burden of experts and increasing the accuracy of delineation.
Several studies have described the application of deep learning to radiotherapy of head and neck cancer, and automatic segmentation of CTVs is often discussed as one of the main applications. Li et al. [26] developed a deep learning model for automatic segmentation of CTVs in enhanced magnetic resonance images in patients undergoing external radiotherapy for nasopharyngeal cancer, with an average DSC of 0.89 in comparison with expert-delineated volumes. Cardenas et al. [27] developed an automatic segmentation model for delineating the CTV in CT images of patients undergoing external radiotherapy for oropharyngeal cancer, achieving a median DSC of 0.81 in comparison with expert-delineated CTVs. Kihara et al. [28] tested a deep learning model for automatic segmentation of CTVs in CT images of patients with oropharyngeal cancer, obtaining a DSC of 0.76. Nevertheless, these studies included patients undergoing either sole radiotherapy or preoperative radiotherapy. In postoperative CT images, the absence of primary tumor contours presents an additional challenge for CTV segmentation using deep learning models. To date, only a few studies have investigated the use of deep learning models for segmentation of postoperative CTV. The postoperative setting in this study presents a markedly different challenge from conventional automatic segmentation tasks. After tumor resection, the target volume lacks visible tumor borders and is surrounded by irregular postoperative anatomy, so CTV delineation must rely on subtle imaging cues and indirect references to pre-operative scans. This “missing-tumor” scenario demands model adaptations beyond those used for intact organs, underscoring the innovative contribution of applying deep learning to cases with substantial postoperative variability and uncertainty.
In previous research, Li et al. employed nnU-net for delineating the residual parotid gland and six organs at risk in brachytherapy for parotid gland cancer, achieving DSC scores of 0.87, 0.88, 0.91, 0.75, 0.89, 0.74, and 0.93, respectively [4]. However, segmenting the target volume is more challenging as it requires precise localization of the tumor bed, which is a specific region within the structurally complex residual parotid gland. Additionally, the target volume, unlike the organs at risk, does not exhibit readily distinguishable anatomical landmarks on CT images, thus rendering the direct delineation process significantly more complex and demanding. When the tumor is adjacent to organs at risk, it is also necessary to include portions of these organs within the target volume, complicating decision-making further. In this study, we optimized the model architecture based on nnUnet by introducing a 3D Res-Unet network model, and trained and validated it using a larger sample size. In comparison with the aforementioned studies, the DSC index obtained in this study using only the deep learning model was lower (DSC = 0.709 ±0.105). The potential reasons for this result are as follows. First, as stated in previously published studies [29], in postoperative CT images, the absence of primary tumor contours due to surgical resection disrupts the original structure of the parotid gland, resulting in the lack of clear tumor contours in these images and thus posing greater challenges for both manual delineation and deep learning-based automatic segmentation. Experienced radiation oncologists showed moderate agreement in the delineation of CTVs for brachytherapy after parotid cancer surgery. Second, postoperative changes, such as blurred soft tissue boundaries, disordered internal structures of the parotid gland, and tissue displacement, may increase anatomical diversity. Third, while our approach, wherein manual delineation was performed by a single radiation oncologist and reviewed by a more senior radiation oncologist, limited inter-observer variability, intra-observer variability inevitably affects the consistency of training data. Fourth, the CTVs of parotid gland tumors have a smaller size, but more irregular and speculated margins. While DSC is a widely adopted metric in assessing segmentation quality, it is highly sensitive to the size of the evaluated item [30], wherein minor differences between volumes may cause significant variations in DSC values.
To provide a more comprehensive evaluation, this study also incorporated qualitative expert evaluations. According to the evaluations by two experts, the target areas segmented solely using the deep learning model were still clinically applicable with slight modifications. Thus, this study assessed the feasibility of using a deep learning model to assist manual CTVs delineation for postoperative brachytherapy of parotid gland cancer. The CTVs obtained with the assistance of the deep learning model showed good consistency with those obtained by radiation oncologists (DSC = 0.924 ±0.031), while significantly reducing the time required for delineation. In comparison with the traditional method, this approach reduced the delineation time by an average of 74.5%. From the patient’s perspective, faster and more standardized contours can shorten the interval to treatment initiation, reduce additional visits or repeat imaging, and lessen anxiety and indirect costs associated with prolonged planning. In expert qualitative evaluations, it also achieved scores similar to the traditional method. However, it should be noted that although the automatic contours achieved mean scores of approximately 2.6, they still required expert verification and minor edits before clinical adoption, underscoring that automatic CTVs should serve as decision-support tools rather than fully autonomous inputs. The discrepancy between the raw automatic contours (Dice 0.709 ±0.105) and the expert-refined contours (Dice 0.924 ±0.031) is chiefly attributable to two predictable factors: postoperative target beds show scar-fat replacement and loss of a discrete tumor boundary, producing low-contrast and semantically ambiguous interfaces that can lead the model to local under- or over-segmentation, and systematic boundary deviations cluster at anatomically complex multi-tissue junctions such as the parapharyngeal fat-medial pterygoid transition, the fascia along the masseteric space and the peri-external auditory canal bone/soft tissue interface where intensity heterogeneity and geometric variability are greatest. These concentrated and interpretable deficits account for most of the residual error corrected during rapid expert review and indicate clear targets for future optimization.
However, this study still had several limitations. First, by serving as the main reference data for CTV delineation, the preoperative imaging data indirectly participated in the training of the deep learning model by influencing the radiation oncologist’s delineations in the training dataset. In future studies, attempts will be made to input preoperative imaging data into the neural network model in hopes of achieving better automatic segmentation quality. Second, this was a single-center retrospective cohort with strict inclusion criteria (T1-T3, node-negative) and relatively uniform surgical approaches and imaging parameters, which may introduce selection bias and limit generalizability. As our cohort was dominated by low–intermediate grade tumors, external validation in high-grade and rarer histologic subtypes is planned, since these cases may require broader margins or exhibit more distorted postoperative beds, potentially affecting auto-segmentation performance. Thirdly, this study did not include a dose-distribution comparison between manual and physician-reviewed automatic contours, which remains a limitation; a prospective dosimetric evaluation is planned to assess whether the two approaches yield clinically equivalent treatment plans. Lastly, the segmentation of target volumes not only depends on medical imaging but can also integrate multiple types of information such as functional imaging, surgical records, and pathological diagnoses.
Conclusions
Automatic contouring, followed by physician review, enabled rapid and clinically acceptable CTV generation for postoperative brachytherapy in parotid-gland cancer. This workflow reduced the average delineation time from 46.7 minutes (fully manual) to 11.9 minutes per case after expert review, while maintaining contour quality comparable with manual delineation. Accordingly, the proposed deep-learning model functions as a useful support tool that streamlines physician-led radiation-treatment planning.


