
Purpose
In radiation therapy, according to the American Association of Physicists in Medicine (AAPM) guidelines, dose calculation in any treatment plans should be verified with an independent secondary dose calculation before the plan is used for patient treatment [1-3]. Treatment planning system (TPS) must use government-approved dose calculation. In order to verify dose calculation of TPS, each clinic should either purchase a commercially available independent secondary dose calculation software or develop in-house independent dose calculation software [4, 5]. In general, both commercial and in-house independent second check software require designated computers/server client to perform independent dose calculation as a part of quality assurance for clinical workflow. Jayakody et al. systematically reviewed and summarized studies on independent dose verification in high-dose-rate (HDR) brachytherapy for treatment plan verification and quality assurance of TPS [6].
Commercially available second check software programs, such as BrachyCheck (Axios Oncology, Oceanside, NY, USA), Brachy MUCheck (Oncology Data Systems, Inc., Oklahoma City, OK, USA), and RADCALC (Lifeline Software, Inc., Tyler, TX, USA) typically use all treatment plan information, such as images, structures, dose, and plan imported from a commercial TPS through DICOM (Digital Imaging and Communications in Medicine) file transfer as input data. These software programs calculate doses for HDR brachytherapy using AAPM task group 43 (TG-43) formalism. They require paid license and designated computer(s) for software installation. In literature, there are several in-house second check software [4, 5, 7, 8], which also rely on TG-43 formalism. These software programs either require a network access to TPS for data transmission, or manually entered data. Efficiency of networked data transmission and manual data entry may be affected by various factors, including network stability and users’ familiarity with the software. In adverse scenario, additional processing time may be required.
In this study, an independent secondary dose calculation software was developed based on TG-43 formalism using graphical user interface (GUI). A simple treatment plan report was considered as input (treatment source strength, number of channels, dwell position coordinates, and dwell times for each channel as well as reference point coordinates and doses) that can run on commonly used computer systems (Windows, MacOS, and Linux), to improve the efficiency of HDR brachytherapy in clinical practice, especially in time-sensitive operating room setting for intra-operative radiation therapy (IORT) using HDR brachytherapy.
Material and methods
TG-43 formalism and parameters
Equation 1 of the updated TG-43 formalism (TG-43U1) [9] for line-source approximation determined dose-rate at dose calculation point P (x, y, z) from a line source with length of L in Figure 1, and consisted of five parameters:
[9]
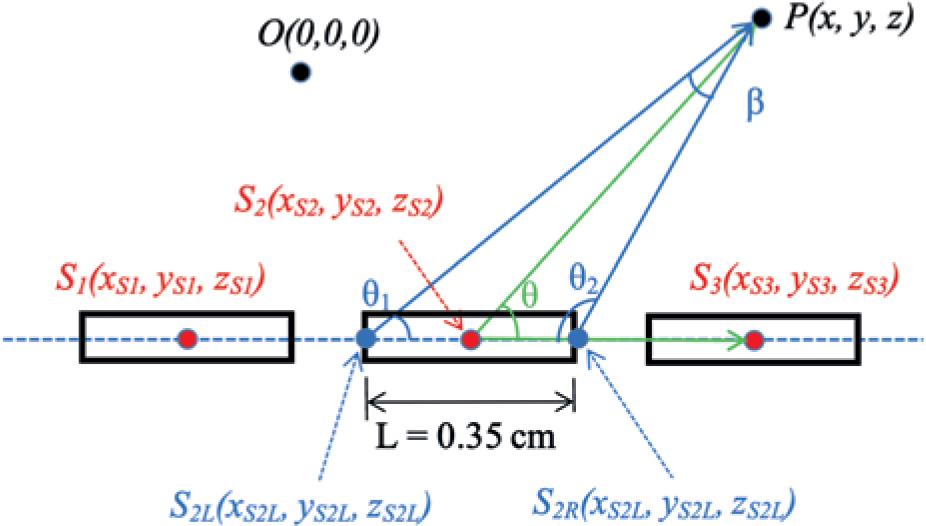
Fig. 1
Three line-source positions, each having a center point ( S1, S2, and S3, respectively). The reference dose point is P(x, y, z), and two angles θ and p are defined for line-source approximation. The point O(0,0,0) is the origin of coordinate system. Note that source shape in this schematic diagram is simplified as symmetric. Any asymmetry of source configuration or part of shielding in the source design is embedded in the anisotropy function of TG-43 formalism for a specific 192Ir source model in the AAPM Report 229
Where Sk is the strength of radioactive source translated into a quantity of air-kerma (dose in air). The unit is a symbol ‘U’, where 1 U = 1 cGy cm2/h. The Λ is a conversion factor from a radioactive material to air-kerma strength of the source, and it is a specific value to a given radioactive source and source model by a manufacturer. The geometry function, GL(r, θ) is an effective inverse square dose fall-off due to the distance between the source and dose calculation point, while neglecting scattering and attenuation of photons in the source and medium. The radial dose function, gL(r), is the effect of dose fall-off or buildup due to photon scattering and attenuation on transversal-plane. The anisotropy function, F(r,θ), is the dose reduction due to photon attenuation within metal encapsulation of HDR source itself. These two factors, i.e., radial dose function and anisotropy function are normalized to the reference geometry (P(r0, θ0), where r0 = 1 cm and θ0 = 90 degrees). Hence, gL(r) value is unity at r = 1, and F(r,θ) value is unity at r = 1 and θ = 90 degrees.
The AAPM Report 229 contains consensus data of these five TG-43 parameters for currently available commercial iridium-192 (192Ir) HDR brachytherapy sources, to provide more detailed data points proximal to the source and polar angle close to 0 or 180 degrees [10, 11]. According to the AAPM Report 229, TG-43 parameters are obtained for dose calculation in homogeneous water medium, and the maximum distance between the source and a dose point is 10 cm. Since the second check software developed in this study utilized TG-43 formalism and parameters, it had the same limitation on the distance from the source to a dose point. This study used the same TG-43U1 formalism and consensus dataset from the AAPM. In our clinic, GammaMedplus iX afterloader (Varian, a Siemens Healthineers Company, Palo Alto, CA, USA) is used for HDR brachytherapy. In the GammaMedplus iX using 192Ir HDR source, air-kerma strength (Sk) is 40700 U corresponding to nominal source activity of 10 Ci, dose-rate constant (Λ) is 1.117 cGy/h/U, and length of source L is 0.35 cm. The AAPM Report 229 [10] provides radial dose function and anisotropy function in tabular format with discrete data points. In this study, an intermediate data point for radial dose function and anisotropy function was estimated by a linear interpolation from the nearest two discrete data points in the table. If a dose point was very close to the source (i.e., smaller than the lowest value of the table) or faraway (i.e., larger than the highest value of the table), the limit value of the table was selected (i.e., the smallest value of the table for a very close case, or the highest value of the table for a faraway case).
Line-source approximation and dose calculation
There are two different approximate models for the geometry function: point-source approximation (GP(r)) and line-source approximation (GL (r, θ)), described in the Equation (4) of TG-43U1 report. In this study, line-source approximation was employed the same as the commercial TPS. The distance r was computed from Cartesian coordinates of each source dwell position S(xs, ys, zs) and a reference point P(x, y, z) using the following equation:
The angle θ is defined as the polar angle specified between the center of source axis and the dose calculation point P(x, y, z) (Figure 1), while β is the angle subtended by both ends of the hypothetical line source L, with respect to the dose calculation point P(x, y, z) (Figure 1).
The difference of line-source approximation from point-source approximation in TG-43U1 formalism is the angles θ and β from a 192Ir line source with length of L (Figure 1). In this study, the coordinates of all possible dwell positions were extracted from the treatment plan report, and the axis of source was expressed as a vector between the possible dwell positions (Figure 1). The angle θ in line-source approximation can be calculated using Eq. (2-3). In a demonstration case illustrated in Figure 1, there were three source positions with center positions as S1, S2 and S3. The angle θ of the source position S2 was defined by two vectors (
The angle β was determined from the sum of internal angles (180° = θ1 + θ2 + β) of the triangle, of which three vertices were S2L, S2R,, and P seen in Figure 1. The vector was defined as from the origin, and its unit vector was specified as . Therefore, the coordinates of both ends (S2L and S2R) for the source position S2 were determined using Eq. (3). The active source length of 192Ir HDR source for GammaMedplus iX was 0.35 cm, and half of the active source length was 0.175 cm in Eq. (3).
Dose to each reference point (Di, where i is the index for a reference point) was calculated using Eq. (4), and was the sum of the dose from all the dwell positions computed by multiplying dose rate (
Input data to the software
A commercial independent dose calculation software used in our institution (Brachy MUCheck, Oncology Data Systems, Inc.) imports a treatment plan file in DICOM format, which is exported from TPS (Varian BrachyVision, version 16.1.5). It requires access to the TPS for data transfer and communication. In contrast, this study utilized the treatment plan report as a text file input for the software, bypassing the need for DICOM files. A treatment plan report is printed in PDF (portable document format) file using the print layout option as “BrachyFull.tml” in the BrachyVision (version 16.1.5) TPS. All text from the PDF file is copied and pasted into a text file without any modification. The text file becomes the input file for the software, and the software automatically reads the input text file. In most other institutions, source decay is taken into account in TPS and treatment source strength for a treatment plan is different from nominal strength due to source decay. In contrast, in our institution, the nominal source strength is used for the treatment planning, and therefore source strength in any treatment plan is the same as the nominal source strength. The source decay is accounted for at HDR afterloader console computer. When the console computer reads the transferred treatment plan from the TPS, dwell times are automatically scaled by the ratio of source strength (nominal/treatment). Because the second check software reads the treatment source strength from the treatment plan report, the nominal strength is read for the treatment source strength in our institution, while decayed source strength is read for the treatment source strength in other institutions. Information extracted from the input file includes the treatment source strength, number of channels, dwell position coordinates, and dwell times for each channel as well as reference point coordinates and doses. Additionally, no patient-related protected health information (PHI) is accessed, recorded, nor utilized by the software.
Python programming and GUI conversion
Python 3 programming language was used to develop the software using Google Colab environment to ensure compatibility across all operating systems. A widely adopted GUI toolkit, tkinter [12], was utilized to encapsulate the developed core script into a user-friendly interface, where users can interactively select input file and receive real-time dose calculation results. Even though the software source code operates on web-based Google Colab, the GUI-converted software runs locally at any standard computer systems, with no installation process needed.
Application on clinical cases
The calculated dose in the independent second check software was compared with the dose at reference points from the TPS, and the absolute dose difference was reported as well as the relative percent difference. The absolute (Ddiff, abs in Eq. (5.1)) and relative percent dose difference (Ddiff, rel in Eq. (5.2)) from that of TPS was calculated using Eq. (5).
The software was tested for 117 clinical plans. Clinical cases included HDR brachytherapy treatment plans with different gynecological applicators (102 cases) and IORT using HDR HAM applicators (15 cases). Vaginal cylinder brachytherapy cases used template plans depending on inserted cylinder size in diameter. Other gynecological applicators were tandem and ovoid (T&O) and additional needles to cover lateral extension of the tumor from the cervix of uterus. For vaginal cancers, vaginal cylinder plus needles was used. Furthermore, universal interstitial cylinder (UIC) was utilized with additional interstitial needles, and interstitial needles were exclusively capitalized without any sold applicators.
Results
Python software
An HDR source-specific TG-43 parameter dataset was incorporated into a Python software. This dataset was verified by comparing with those in the AAPM Report 229 [10], and no discrepancy was identified. The step-by-step process of dose calculation using the software is outlined in Figure 2. It was noted that any number in the input file was considered as a character in the Python tool requiring conversion into numeric format for calculations. Plan-specific input data were imported from the treatment plan report, and plan-specific TG-43 parameters were determined by the distance r, polar angle θ, and angle β calculated between individual dwell positions and each reference dose point.
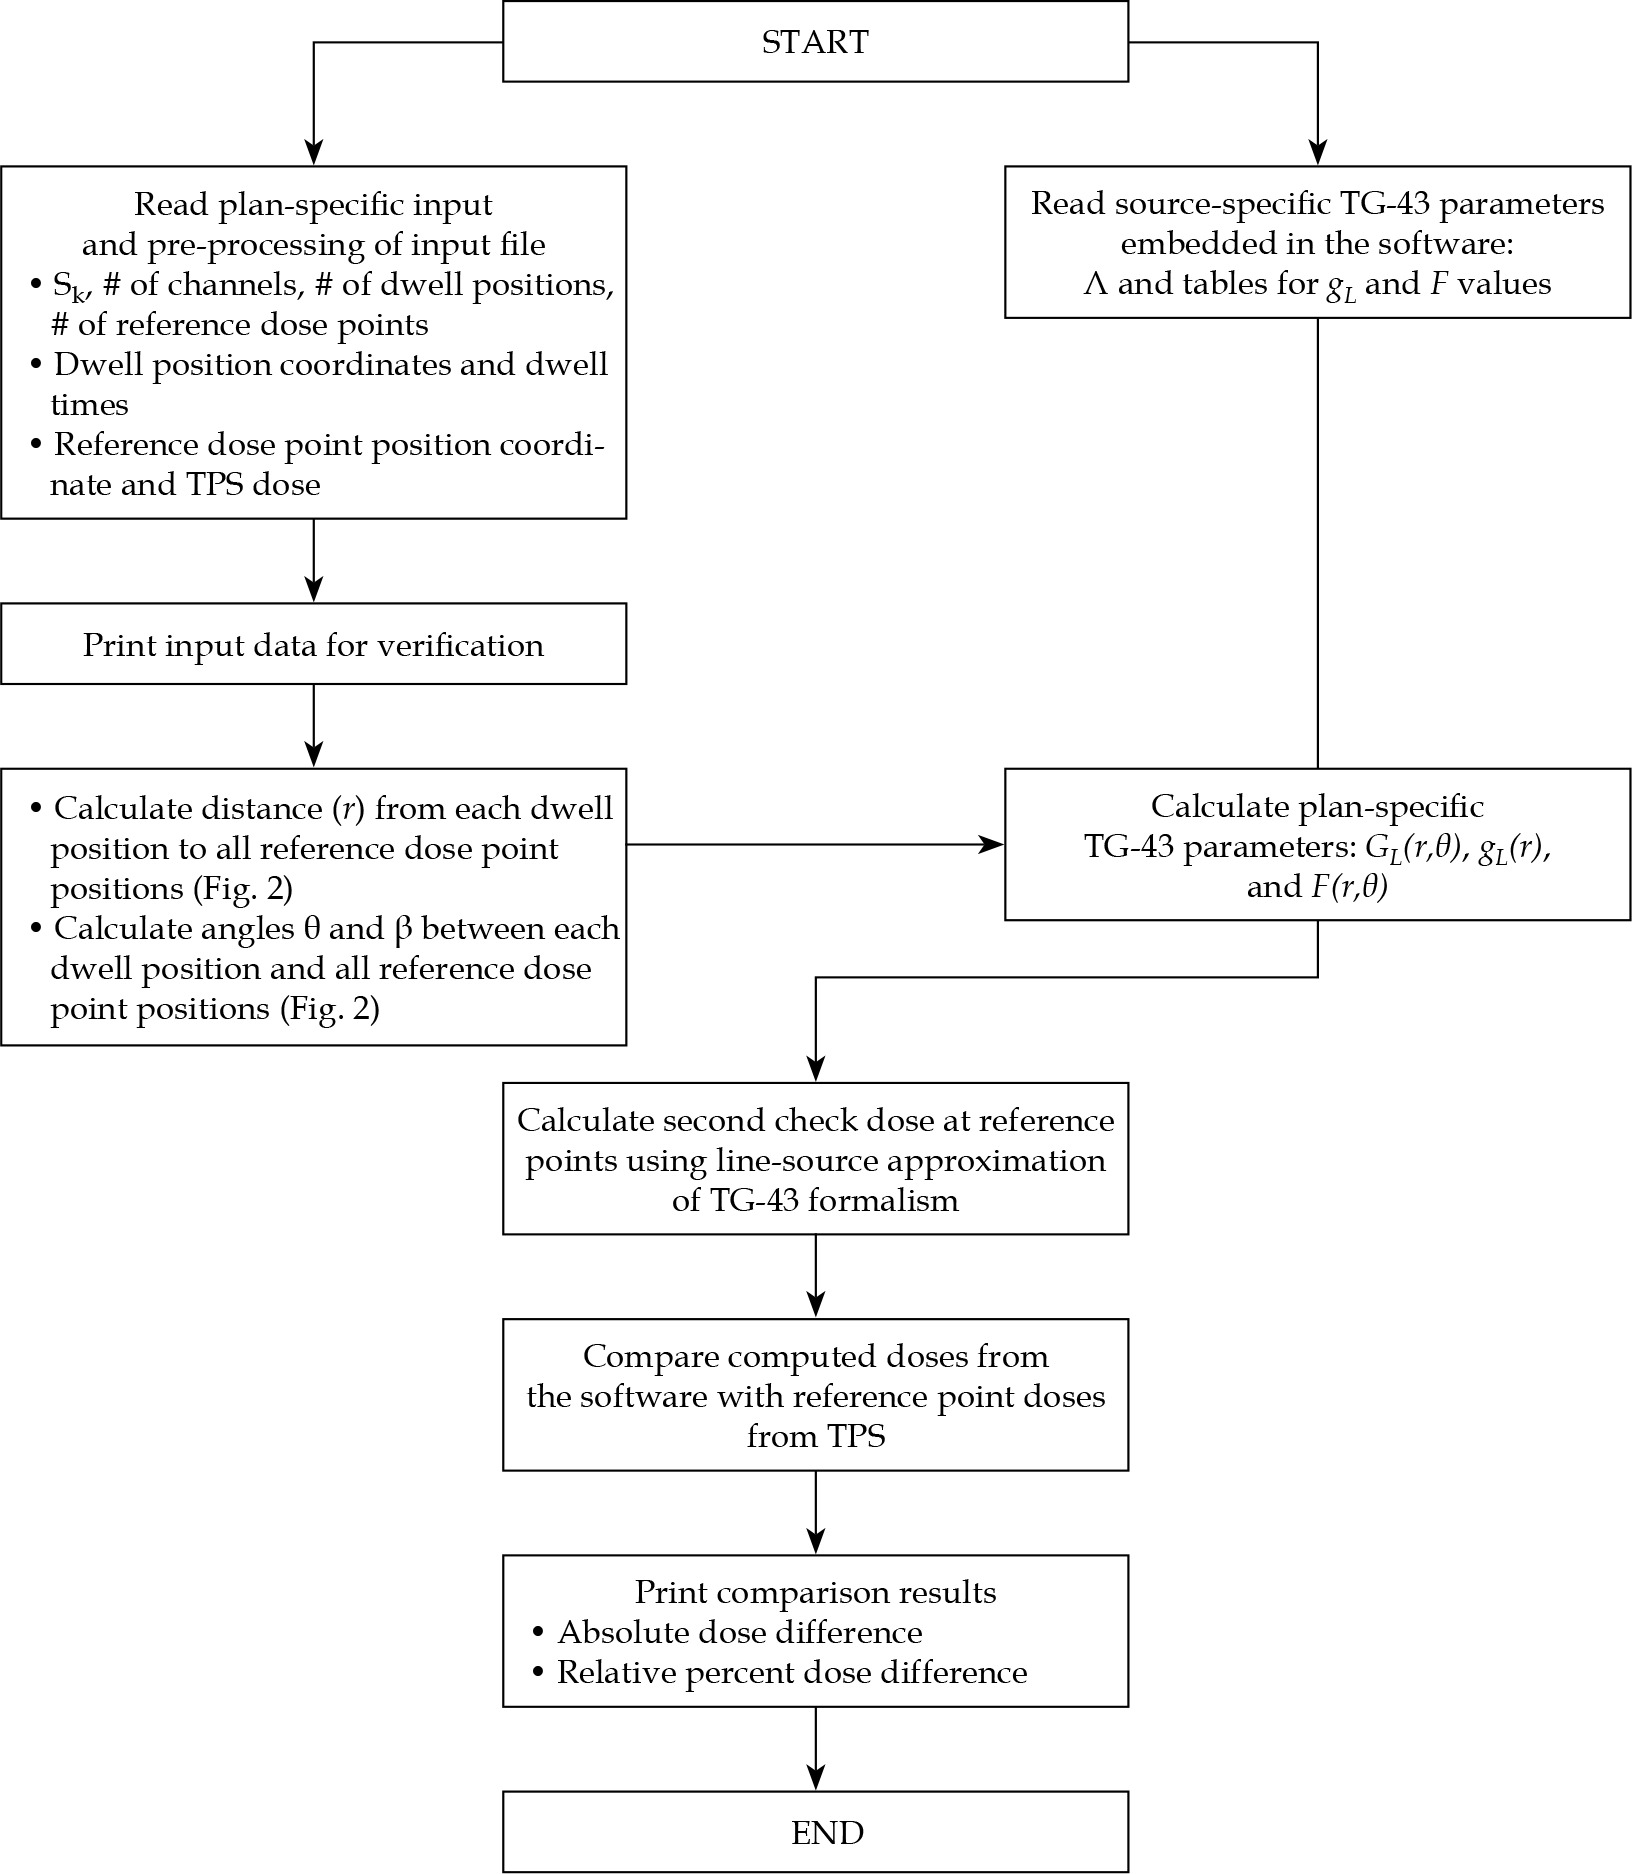
The text input file includes a few lines in the header of each page, which are sometimes located in the middle of lines for dwell position coordinates and dwell times. This may lead to potentially wrong number of dwell positions and dwell times. Therefore, those lines are eliminated by pre-processing of the input file. In the pre-processing, the software reads the input text file line-by-line, and any header lines are ignored whenever they are identified by the software. The pre-processing is embedded in the software, and is automatically performed first prior to dose calculation as soon as the software runs. In order for users to verify correct input data, the software reads the input data from the treatment plan report and displays them in a text box on the left-side of GUI, which can be used to compare with dose calculation results shown on the right-side text box.
GUI of the software
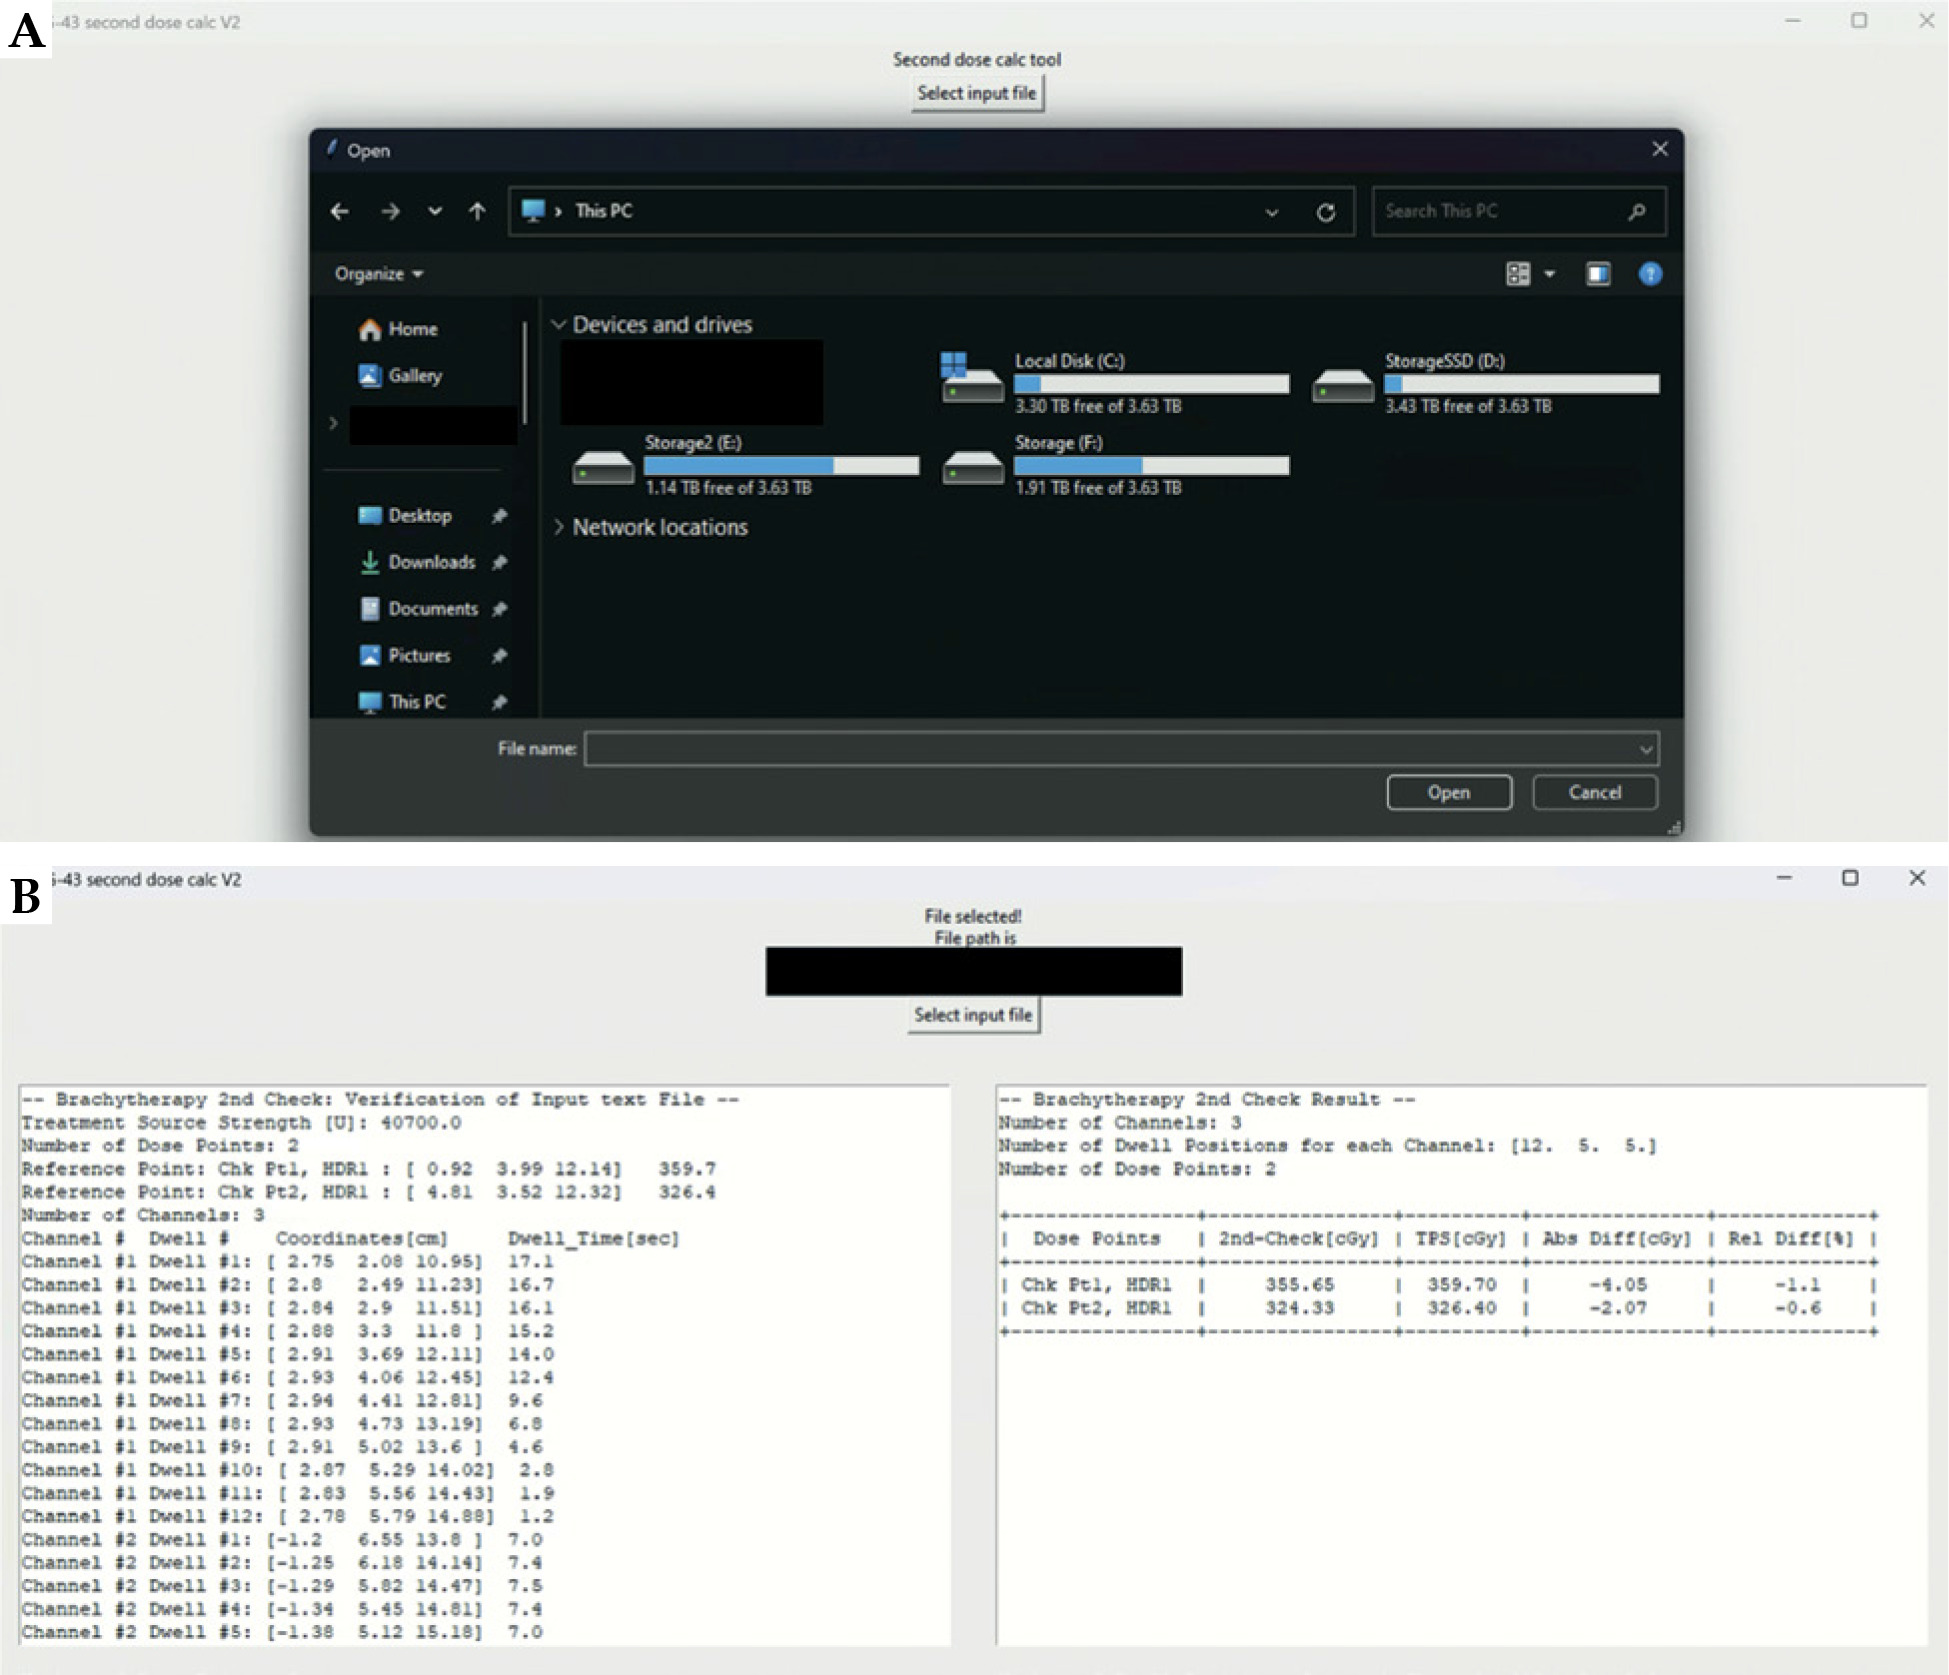
GUI of the developed software allows users to easily select an input file by clicking the select input file button, and indicate a text file from the drop-down window, as illustrated in Figure 3A. Once the input file is selected, the software window displays the file path, reads the input file, prints the verification of input data (Figure 3B) in the left text box, and shows real-time calculated dose computation results in the right text box (Figure 3B). Without the need to reboot the software, users can continue to select other input files for additional dose calculation tasks.
Fig. 3
Example of GUI environment for A) selecting input, B) printing verification of input data (left-side text box), and output results (right-side text box). The right-side text box shows the number of channels (3 channels) and the number of dwell positions for each channel (12, 5, and 5). The left-side text box shows the details of channel #1 and #2 (dwell position coordinates and dwell times). The details of channel #3 are not shown due to limited size of text box, but they can be seen by scrolling the text box down
Application on clinical cases
The software operates real-time without any delay of clinical workflow and the computation time is instantaneous. In our clinic, two reference dose points are selected for each plan around the area where the prescribed dose is expected. For a gynecological treatment plan, two traditional “A” points of pear-shaped dose distribution are selected as two reference points. Since the pear-shaped dose distribution is modified to cover high-risk clinical target volume (HR-CTV), the reference point doses are not always the same as the prescribed dose, depending on HR-CTV location. For an IORT plan, the prescription dose is assigned to a plane parallel to the HAM applicator by 1 cm apart, and two reference points are selected on that plane. The details of patient cohorts are summarized in Table 1, with the types of applicators used. Thirteen applicators groups were categorized based on the type of applicator and the total number of channels. The mode of prescription doses was 600 cGy per fraction (ranging from 500 cGy to 700 cGy) for gynecological applicators, and 1200 cGy in single fraction (ranging from 1000 cGy to 1500 cGy) for IORT HAM applicators, respectively.
Table 1
Summary of relative percent dose difference of independent dose calculation compared with TPS (234 dose points for 117 clinical cases with 13 applicator groups)
| Applicator type (No. of cases; No. of dose points) | No. of channels | Relative percent dose difference (Ddiff, rel, Eq. (5.2)) | |||
|---|---|---|---|---|---|
| Mean | Standard deviation | Minimum | Maximum | ||
| Cylinder (4; 8) | 1 | –1.06 | 0.33 | –1.5 | –0.5 |
| T&O (8; 16) | 3 | –0.94 | 0.18 | –1.3 | –0.6 |
| T&O + tandem (9; 18) | 4 | –0.87 | 0.15 | –1.2 | –0.5 |
| T&O + 2 needles (9; 18) | 5 | –1.01 | 0.23 | –1.4 | –0.5 |
| T&O + 3 needles (10; 20) | 6 | –1.15 | 0.36 | –2.3 | –0.6 |
| T&O + 4 needles (8; 16) | 7 | –0.92 | 0.14 | –1.2 | –0.7 |
| T&O + 5 needles (4; 8) | 8 | –1.28 | 0.67 | –3.0 | –0.8 |
| T&O + 6 or more needles (5; 8) | 9 – 12 | –0.97 | 0.32 | –1.4 | –0.4 |
| Cylinder + needles (17; 34) | 4 – 7 | –1.04 | 0.47 | –1.7 | 0.9 |
| UIC + needles (15; 30) | 6 – 9 | –1.10 | 0.28 | –2.0 | –0.7 |
| Needles only (10; 20) | 6 – 12 | –1.09 | 0.55 | –2.8 | –0.1 |
| IORT HAM (15; 30) | 2-13 | –0.90 | 0.28 | –1.5 | –0.1 |
| Interstitial (3; 6) | 18 | –1.03 | 0.11 | –1.2 | –0.9 |
| Total (117; 234) | 1-18 | –1.02 | 0.36 | –3.0 | 0.9 |
The absolute dose discrepancy between the second check software and TPS is highly dependent on the prescription dose for each plan. Therefore, relative percent dose difference is more meaningful than absolute dose difference in clinical practice. The independent secondary check software resulted in lower dose than that of TPS in all the cases, except for one case. The average ± standard deviation value of the relative percent dose difference from the TPS dose was –1% ±0.36%, with maximum of –3% difference. Tolerance level for disagreement between second check software and TPS was observed as < 3%, and action level was < 5% [13, 14]. In the current study, there were 13 different groups of HDR brachytherapy applicators (Table 1), and the average relative percent dose difference between the independent second check and the TPS ranged from –0.87% (T&O + 2 needles group) to –1.28% (T&O + 5 needles group). Because the data among these 13 groups were independent (i.e., not paired), and the sample size of each group was small and different among the groups, non-parametric statistical analysis, such as Kruskal-Wallis H-test was performed using InStat software (GraphPad Software, Inc., Boston, MA, USA). Even though the difference among these 13 groups was statistically significant (p-value < 0.05), the average relative percent dose difference (0.41%) between the smallest (T&O + 2 needles group) and the largest group (T&O + 5 needles group) was not clinically meaningful.
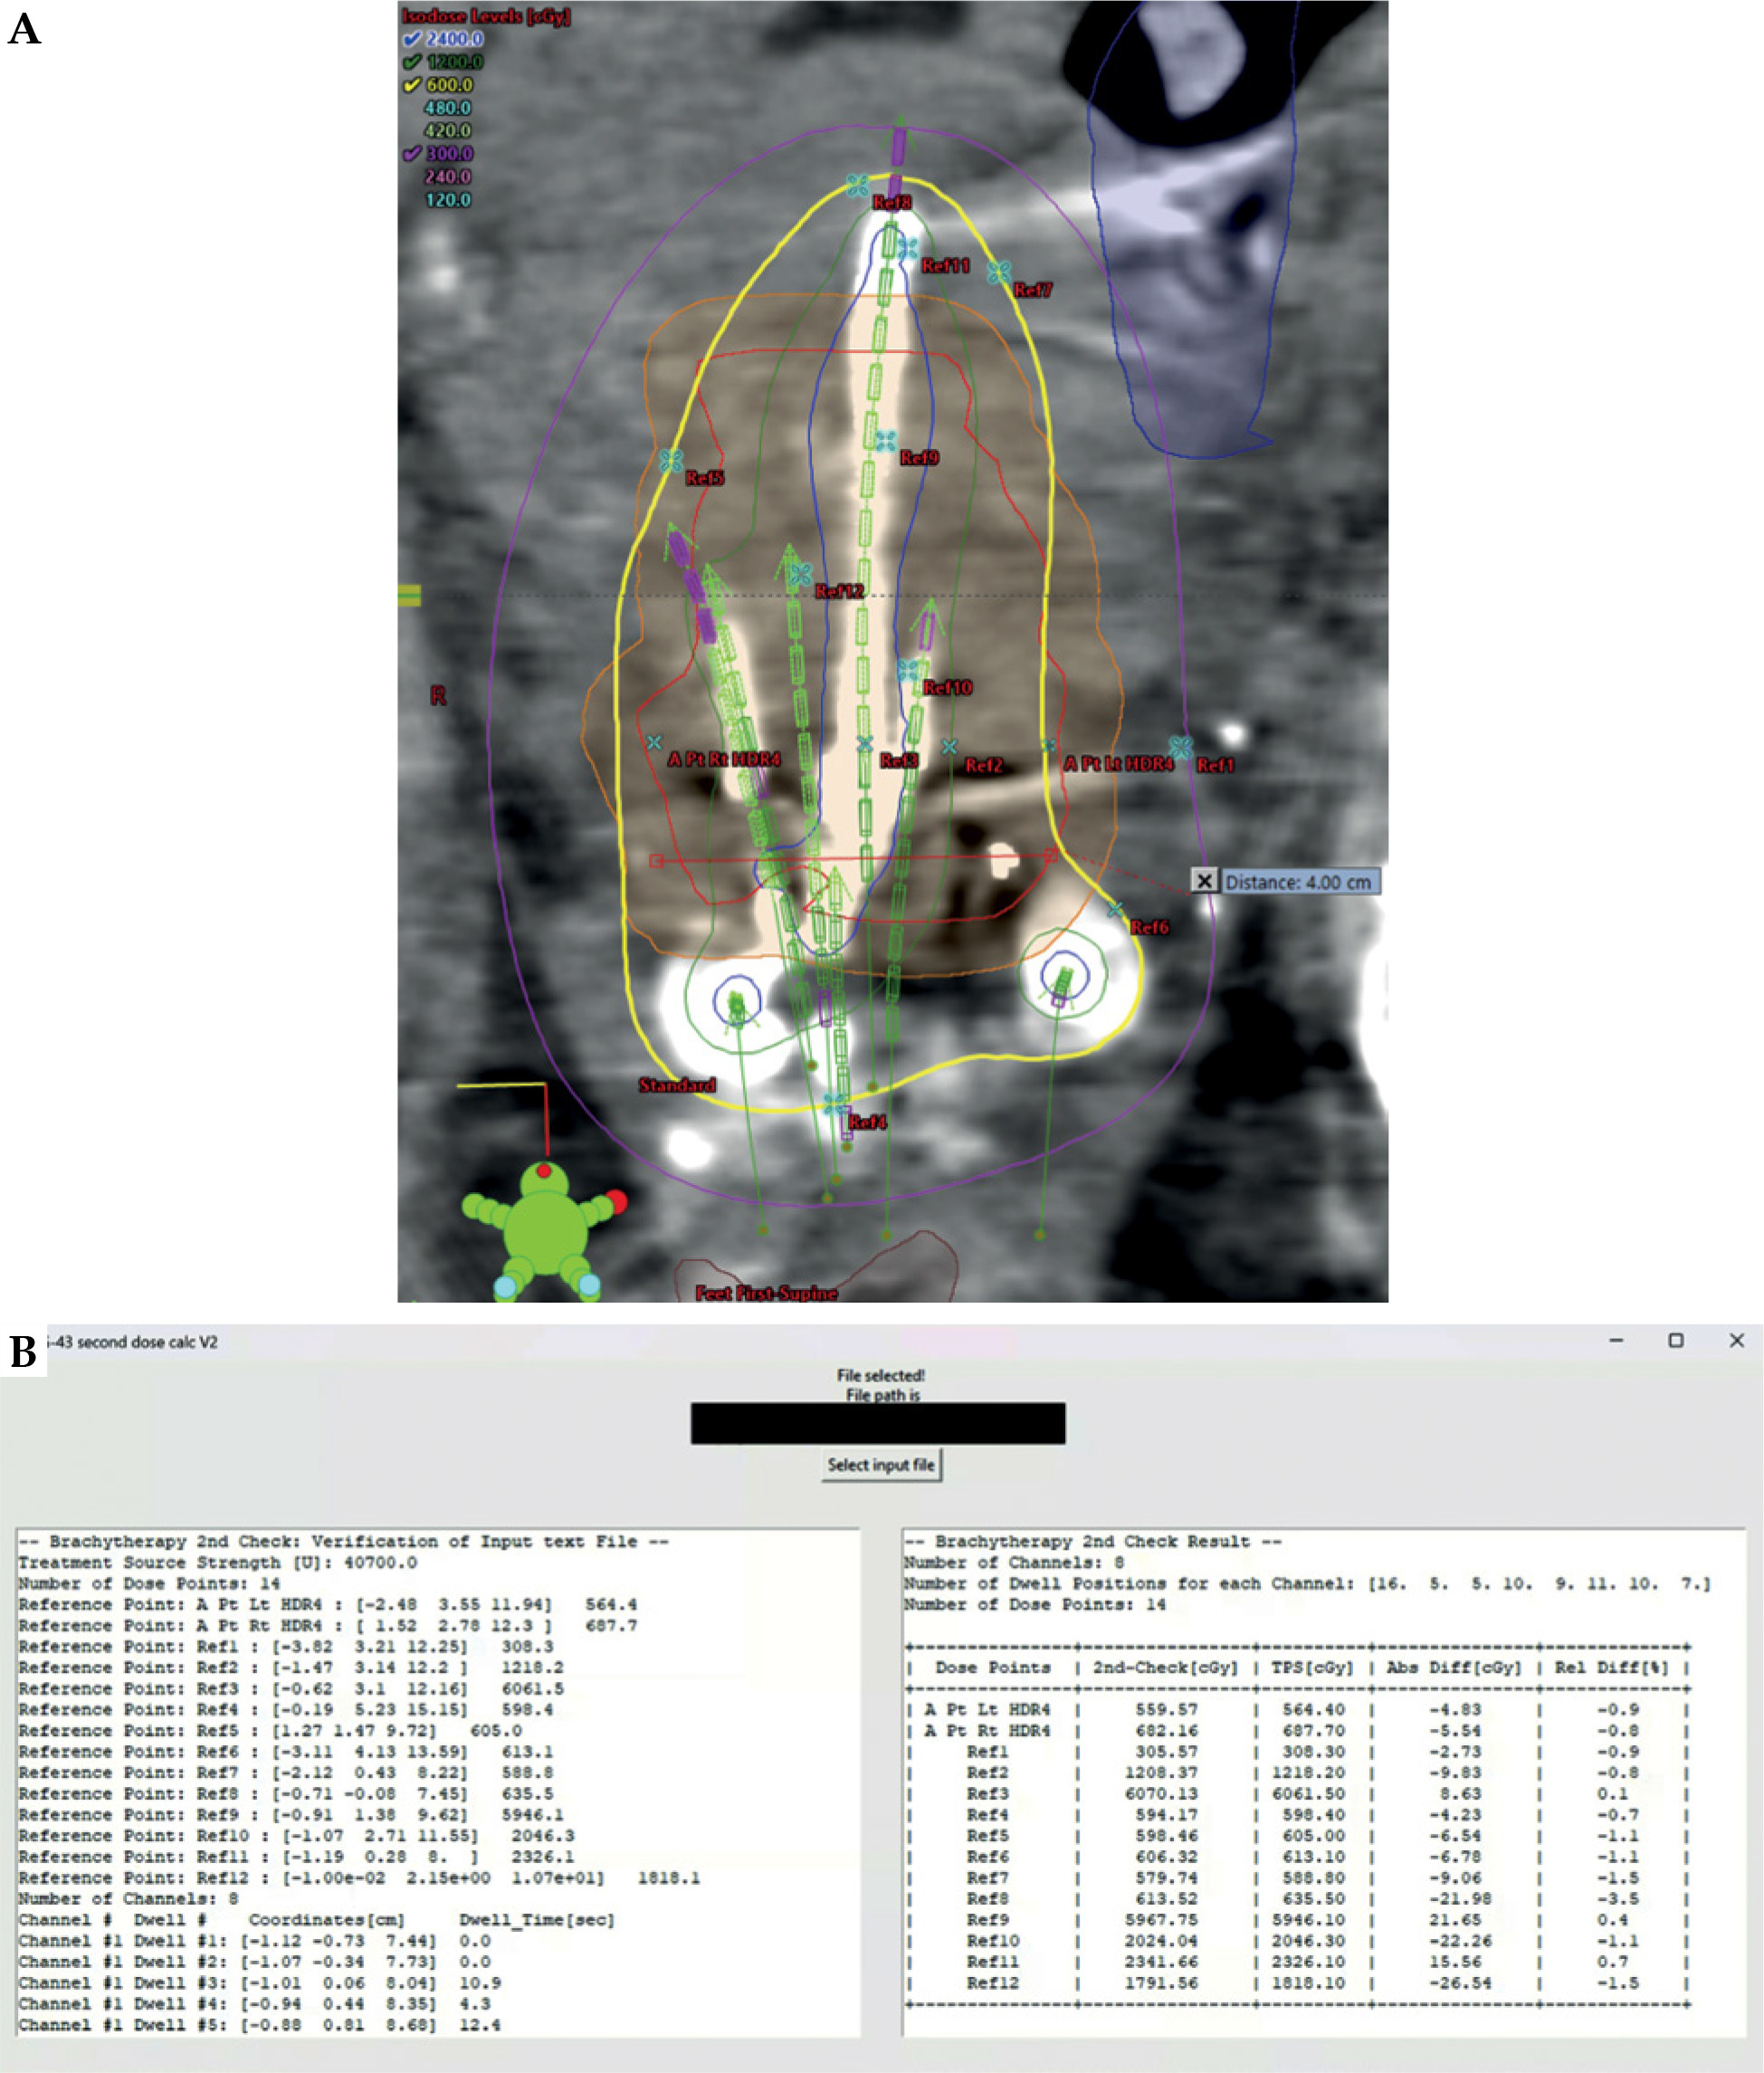
The accuracy of dose calculation using TG-43 formalism deteriorates at the dose calculation point very close to the source positions with polar angle towards 0 or 180 degrees, because the anisotropy function changes drastically in the range of distance and polar angle [10]. Consequently, slight difference in interpolation of tabular values can result in a large dose difference (> 3%) between TG-43 dose calculations. In order to evaluate the sensitivity of the independent second check software on various dose points (different distances and polar angles from source positions), 14 dose points were selected for a gynecological treatment plan using T&O applicator with 5 titanium needles (Figure 4): 2 points for typical dose calculation points in a clinical case (around the prescription points), and 12 points for evaluation purpose. In Figure 4, the red contour is HR-CTV, to which 6 Gy is prescribed. Dose difference of the second check software from the TPS was < 3% for all the dose points, except for one dose point (Ref8 point in Figure 4), which was located close to the distal dwell position of a single channel (tandem), with polar angle towards 0 degree. The dose difference was 3.5% from the TPS because of two combined effects (close to source positions of a single channel and polar angle close to 0 degree). For the other 6 dose points close to source positions (i.e., which doses were higher than the prescribed dose), the dose difference of the second check software was < 2%. Although the Ref3 was very close to the source position (i.e., the dose of Ref3 point was 10 times higher than the prescribed dose), the relative dose difference from the TPS dose was 0.1%.
Fig. 4
A) Coronal view of planning CT image for a treatment plan using T&O applicator with 5 titanium needles. B) Printing verification of input data (left-side text box), and second check dose calculation result of the plan for 14 various dose points. Note that dwell position coordinates and dwell times not displayed in the left-side text box can be navigated by scrolling the left-side text box down
Discussion
In this study, an independent second check software was developed using conventional TG-43 formalism, which has been used in brachytherapy clinics for more than two decades. This formalism assumes dose calculation in homogeneous water phantom. In clinical cases, medium is heterogeneous, and material of most applicators is not water-equivalent. Accurate dose calculation of brachytherapy in clinical cases can be achievable using model-based dose calculations (MBDC), such as collapsed-cone superposition/convolution algorithm, deterministic solutions to linear Boltzmann transport equation, and Monte Carlo (MC) simulation [15]. All these MBDC algorithms describe radiation transport (photon interaction and electron dose deposition) in a heterogeneous medium (i.e., patient body) and radioactive material itself using dose deposition model, particle diffusion equation within the patient, and stochastic approach for MC simulation, respectively [15]. However, computation time of these MBDC algorithms is not instant (at least a few minutes). In clinical practice of HDR brachytherapy, AAPM TG-43 formalism has been used as a standard dose calculation. Dose discrepancy between MBDC algorithms and TG-43 formalism was reported to be < 5% for the target in HDR gynecological brachytherapy applications, and up to 10% for OARs in gynecological applications and other clinical applications [16]. It is recommended that MBDC algorithms are employed to retrospectively compute the dose difference in comparison with the conventional TG-43 formalism [17].
Other in-house second check software programs [4, 5, 7, 8] in the literature using TG-43 formalism are summarized in Table 2. Among the five parameters of TG-43U1, air-kerma strength and dose-rate constant are fixed values for a certain 192Ir HDR source and treatment plan. The determination of radial dose function is relatively straightforward due to the simplicity to calculate distance r and a single interpolation in gL(r) table. There are more variations in calculating the angle θ among studies, and thus geometry function and anisotropy function can differ from that of TPS. The current study describes in detail how to determine the angle β, which is essential for the geometry function in the line-source approximation.
Table 2
Summary of independent second check in-house software programs in the literature using TG-43 formalism
| Author(s), ref. No. (year of publication) | Input data | Dose calculation | Programming language | Reported dose discrepancy |
|---|---|---|---|---|
| Lachaine et al. [4] (2003) | Two files from TPS and manual entry of one dataset | Original TG-43 formalism (different geometry function and old parameters used) | Visual Basic | Point dose: 1-2%, with maximum 4% |
| Carmona et al. [7] (2010) | Treatment plan and manual entry of source strength and reference dates | TG-43U1 formalism with old parameters; no details for angles θ and β | Workbook spreadsheets | Point dose (250 clinical cases): < 2% |
| Wang et al. [5] (2018) | DICOM files from TPS (CT images, RT structures, RT dose, and RT plan) | TG-43U1 formalism (different approach for geometry function) | Visual C++ | 15 cervical cancer plans: DVH comparison (< 1%) and γ analysis, with 1 mm and 5% (> 98.3%) |
| Kang et al. [8] (2020) | Not specified | TG-43U1 formalism (no details for parameters) | Not specified | 4 cervical cancer plans: DVH comparison (up to 7%) and point dose (2.3%) |
The software in this study has several distinctive features for clinical practice. First, the input file is a plan report, eliminating the requirement of TPS connection and any DICOM data transfer. In contrast, all other in-house software and commercially available second check programs require manual data entry, and/or TPS connectivity and DICOM data transfer. For example, in our clinic, we use a cloud-based commercial second check software, which exports treatment plan in DICOM format from TPS to a network drive, and from the network drive to the second check software. Note that the software calculates only point dose at reference points and cannot provide DVH-based results, since there is no volumetric contour information, which are only available in DICOM files from TPS. Second, the use of a commercial second check dose calculation always needs a software license. The license should be purchased and renewed, and the number of licenses is limited depending on purchase agreement. Third, the GUI software can operate on any computer system without any additional software. Also, the computing speed of the software is instantaneous, and the average accuracy of dose calculation is 1% from a commercial TPS. There is no specific tolerance limit of the independent dose calculation accuracy for brachytherapy, and the limit can be adapted from the dose calculation in external beam radiation therapy (EBRT). The AAPM provides 5% tolerance limit (action level) for a point dose in EBRT [13, 14]. Therefore, the simplicity, fast computational speed, and accuracy of the software make it clinically applicable to any clinical workflow. For example, our clinic has many complex gynecological implant cases (up to 4 cases) together with several vaginal cylinder cases in a single day. This software allows for saving time and effort when performing independent second checks for many treatment plans. In particular, IORT procedure is performed in the operating room, and requires immediate planning and second check to deliver radiation dose in the operating room. Currently, our clinic has utilized a simple lookup table in Excel format to expedite independent dose calculations for IORT planning. This Excel file was developed based on the second order polynomial curve fitting between implant area and total dwell times from previous IORT plans. However, this approach requires manual input of various parameters, such as total number of channels, dwell positions per channel, prescription dose, spacing of dwell positions, and total planned dwell times from the TPS. The accuracy of this Excel file approach is about 5% from the TPS. The potential use of the software developed in this study totally eliminates the need for manual data entry, and can reduce the time required for dose verification.
The dose discrepancy of the software from the TPS might originate from two possible reasons. One may be different interpolation methods for radial dose function and anisotropy function in the tables of AAPM Report 229, particularly at the dose points, which are located very close to source positions with polar angle towards 0 or 180 degrees. The dose points (Ref point 2, 3, 9, 10, 11, and 12, Figure 4) are close to source positions with polar angle between 60 and 120 degrees, the dose difference is < 2% because radial dose function and anisotropy function vary < 2% within 1 cm from the source positions in the range of polar angles. In particular, Ref11 point is very close to the distal active dwell position, thereby resulting in the dose to Ref11 point of 390% of the prescribed dose. However, the polar angle is close to 90 degrees and the dose discrepancy is 0.7% (< 1%). In contrast, Ref8 point is relatively farther away from the proximal active source position than Ref11 point (0.6 cm vs. 0.2 cm), and the dose to Ref8 point is 102% of the prescribed dose. Because the polar angle of Ref11 point is 35 degrees, the dose discrepancy is 3.5% (> 3%). The other could be a difference in the definition of axis of line source that affects the determination of angles θ and β. The geometry function depends on distance r, and angles θ and β, and the anisotropy function depends on distance r and angle θ.
The developed software can run on computers as an executable program without installation, allowing it to be easily disseminated. The software will be publicly available and free of charge on GitHub, with a template treatment plan report for users’ reference and a full detailed operating manual, including alerting users of potential errors when operating the software. Also, the software will be developed into a web-based application that can be easily adopted by institution users via intranet, without sharing any PHI with outside of institution.
In the future, the software will be upgraded based on feedback from users. First, the current version of the software is a simple second check dose calculation, without visualization of any geometry of applicators and calculation points. The software will be upgraded to include some visualization features, for example, display of applicators and dose points. Second, the current version allows for an input file only a particular format of treatment plan report, such as Varian BrachyVision (version 16.1.5). After the software is publicly disseminated, other formats of treatment plan reports for different brachytherapy TPSs will be provided by other users. The updated software will have options for different formats of treatment plan reports. Third, the current software has a set of TG-43 parameters of 192Ir HDR source model only for Varian GammaMedplus iX afterloader. The future version will have options for different 192Ir HDR source models of different afterloaders, possibly including cobalt-60 (60Co) HDR source models, if the parameters of these 60Co HDR sources for TG-43 formalism are available. If the software program is used among many centers, we will work together to evaluate data of extensive plans.
Conclusions
A simple independent dose calculation software using AAPM TG-43 formalism was developed using Python 3 programming language and converted into GUI environment to verify commercial TPS dose calculations for HDR brachytherapy. The software demonstrated an accuracy of –1% ±0.36% (mean ± standard deviation), with a maximum discrepancy of 3%, which falls within acceptable tolerance limit (5% deviation). Its simplicity, requiring minimal input and delivering rapid results, makes it well-suited for clinical use in busy HDR brachytherapy clinics and IORT procedures.


