
Purpose
Brachytherapy (BT) is a highly established modality in the management of locally advanced cervical cancer [1]. The commissioning and quality assurance (QA) program for high-dose-rate (HDR) BT has been recommended as a requirement before initiating a patient treatment program, to assure treatment delivery accuracy and avoid possible failures [2-4]. In particular, the transition to 3D image-based treatment planning and incorporation of dose-volume histogram (DVH)-based concepts in gynecological (GYN) BT further necessitates a robust commissioning and QA program [5]. Several QA items should be investigated before starting a clinical HDR GYN-BT [3, 4, 6] schedule. Many of QA tests require appropriate phantom(s) to improve the accuracy, and/or ease and speed in performing the tests, which will be described in the following.
The first challenge for magnetic resonance imaging (MRI)-based GYN-BT is the geometric accuracy of MR images, which affects the correctness of organ delineation and source positioning during applicator reconstruction [7]. Similar to MRI-based external beam radiation therapy (EBRT), geometric distortions in MRI-based BT can be system-related or patient/applicator-related [8].
System-related distortions are due to gradient non-linearity (GNL) and main field (B0) inhomogeneity [9]. In MRI for GYN-BT planning, B0 homogeneity is high because the anatomy of interest is close to the center of the field of view [10]. Although vendor-supplied correction algorithms can reduce the GNL effect, effectiveness of the correction algorithms depends on the sequence and acquisition parameters [11]. Furthermore, these methods do not completely eliminate GNL effects [12].
Patient/applicator-related distortions are due to susceptibility variations, and MRI-compatible applicators in GYN-BT still induce some artifacts and distortions in MR images [8]. B0 strength, position, and orientation of the applicator to B0, implemented sequence, and acquisition parameters can all affect the magnitudes of artifacts and distortions [13]. Consequently, assessing any artifact and distortion induced by MRI scanner and applicators is critical before starting MRI-based GYN-BT [3, 11].
Another important quality control (QC) test is verification of delivered dose by HDR equipment prior to the first treatment. This dosimetric QC item is required for commissioning/QA a new treatment planning system (TPS) or new HDR-BT equipment as well as for audit purposes [4, 14-18].
Volume calculation accuracy should be assessed during TPS commissioning, QA, or any updates [4, 19]. Moreover, using DVH-based metrics has been recommended in current guidelines for 3D image-based BT [5, 20].
A few commercial [21] and in-house [14, 22] phantoms have been introduced for BT QA in recent years. The majority of phantoms have been dedicated to dosimetric verification [14, 15, 22-25]. Phantom studies have also investigated MRI geometric distortions and their dosimetric impact in MRI-based treatment planning for EBRT workflow [26-28]. Fewer studies have been conducted on the effects of geometric distortions of MRI scanners on MRI-based planning in the context of brachytherapy [29], also those that have quantified artifacts and distortions induced by GYN applicators [29, 30].
Currently, before starting an MRI-based GYN-BT program, the physicists require different phantoms to carry out the above-mentioned QC checks. A single, multi-purpose ‘all-in-one’ phantom to address these tasks in a correct, simple, and robust way would be highly advantageous. To our knowledge, no paper has been published on presenting a complete phantom to cover all of the dosimetric and non-dosimetric QA challenges in MRI-based GYN-BT. The aim of this study was, therefore, to present the methodology for developing a QA phantom for robust commissioning of 3D image-based planning (particularly MRI-based planning) in GYN-BT, while accounting for some conflicting requirements in the design and development process to meet all of the dosimetric and non-dosimetric tests. Similarly, we provided some examples to demonstrate the capability of the phantom for performing the afore-mentioned QA tasks.
It should be emphasized that the intended main purpose and focus of this paper was on the phantom itself, and its’ characteristics and capabilities. The examples of its’ use for different applications presented here were intended to demonstrate its’ use in practice rather than a full investigation of the parameters in question.
Material and methods
Design criteria
First, the main criteria for developing a single-BT QA phantom according to dosimetric and non-dosimetric challenges of MRI-based GYN-BT were established as follows: 1) Adequacy for assessing challenges of MRI-based planning for HDR GYN-BT in commissioning and QA processes; 2) Capability of examining distortions caused by MRI scanners for sequences employed in GYN-BT; 3) Ability to assess artifacts and distortions caused by commercial MRI-compatible applicators used in GYN-BT according to the American Association of Medical Physicists (AAPM) TG-303 report [11]; 4) Accurate construction of the designed markers and organ structures; 5) Adequate size for dosimetry according to the AAPM TG-43 formalism [31]; 6) Ability to register a simple ionization chamber for validating the dose calculation algorithm(s) of a BT TPS; 7) Reasonably realistic organ structures in terms of shape and size to verify accuracy of volume calculation in a BT TPS; 8) Construction from non-degradable materials with electron densities close to soft tissues in GYN treatments; 9) Easily assembled and disassembled; 10) Reasonable overall weight.
Phantom components
The in-house phantom constructed based on the above-mentioned design criteria was called the ‘all-in-one quality assurance phantom for brachytherapy’ (in short, AQuA-BT phantom). The phantom included five main components: a waterproof box (component P0) and an insert for validating the delivered dose from HDR afterloaders (component P1), an insert for validating the accuracy of volume calculation in TPSs (component P2), component P3 for quantifying distortions induced by MRI scanners and image sequences in HDR GYN-BT, and an insert for the quantification of image distortions and artifacts caused by MRI-compatible applicators (component P4).
Main body: Component P0
A waterproof box with external dimensions of 360 mm × 360 mm × 270 mm (left-right [LR] × superior-inferior [SI] × anterior-posterior [AP]) was designed and constructed. Each dimension of the constructed P0 component was within ±1 mm of designed value. The walls were 10 ±0.1 mm thick, and made of acrylic polymethylmethacrylate (PMMA).
The dimensions were selected to meet the following criteria: (A) We should be able to easily register other phantom components and applicators inside the phantom; (B) The box should be large enough to measure MRI-based distortions on a scale comparable to the size of a typical female pelvis, while being sufficiently large for BT dosimetry based on the AAPM TG-43 formalism [32]; (C) For image registration purposes, each face of the box should be differentiable from the other faces on computed tomography (CT) and MR images using specific markers that could be visualized in both CT and MR images (e.g., vitamin E markers [11]).
Validation of delivered dose: Component P1
Component P1, constructed from PMMA, was designed to assess HDR-BT equipment delivered dose accuracy. It consisted of several elements that could be mounted within component P0. This allowed the physicist to place and fix a small-volume ionization chamber in AP direction with the corresponding holder. The source coming from the afterloader could travel inside a specific catheter in a perpendicular direction, with respect to the chamber axis in a circular trajectory (Figure 1). The trajectory was supported by four rods to maintain a fixed 3.0 cm distance between the source center and effective point of measurement of the ionization chamber (Figure 1A, B).
Fig. 1
Component P1 for dosimetric validation. A) Without ionization chamber, with circular trajectory of the source and the ruler indicated; B) A schematic of circular hole used to build the source trajectory; C) A generated treatment plan for finding the sweet spot; D) The setup of component P1 placed inside P0, with a PinPoint 3D ionization chamber in place; E) A generated treatment plan using a CT scan of the phantom
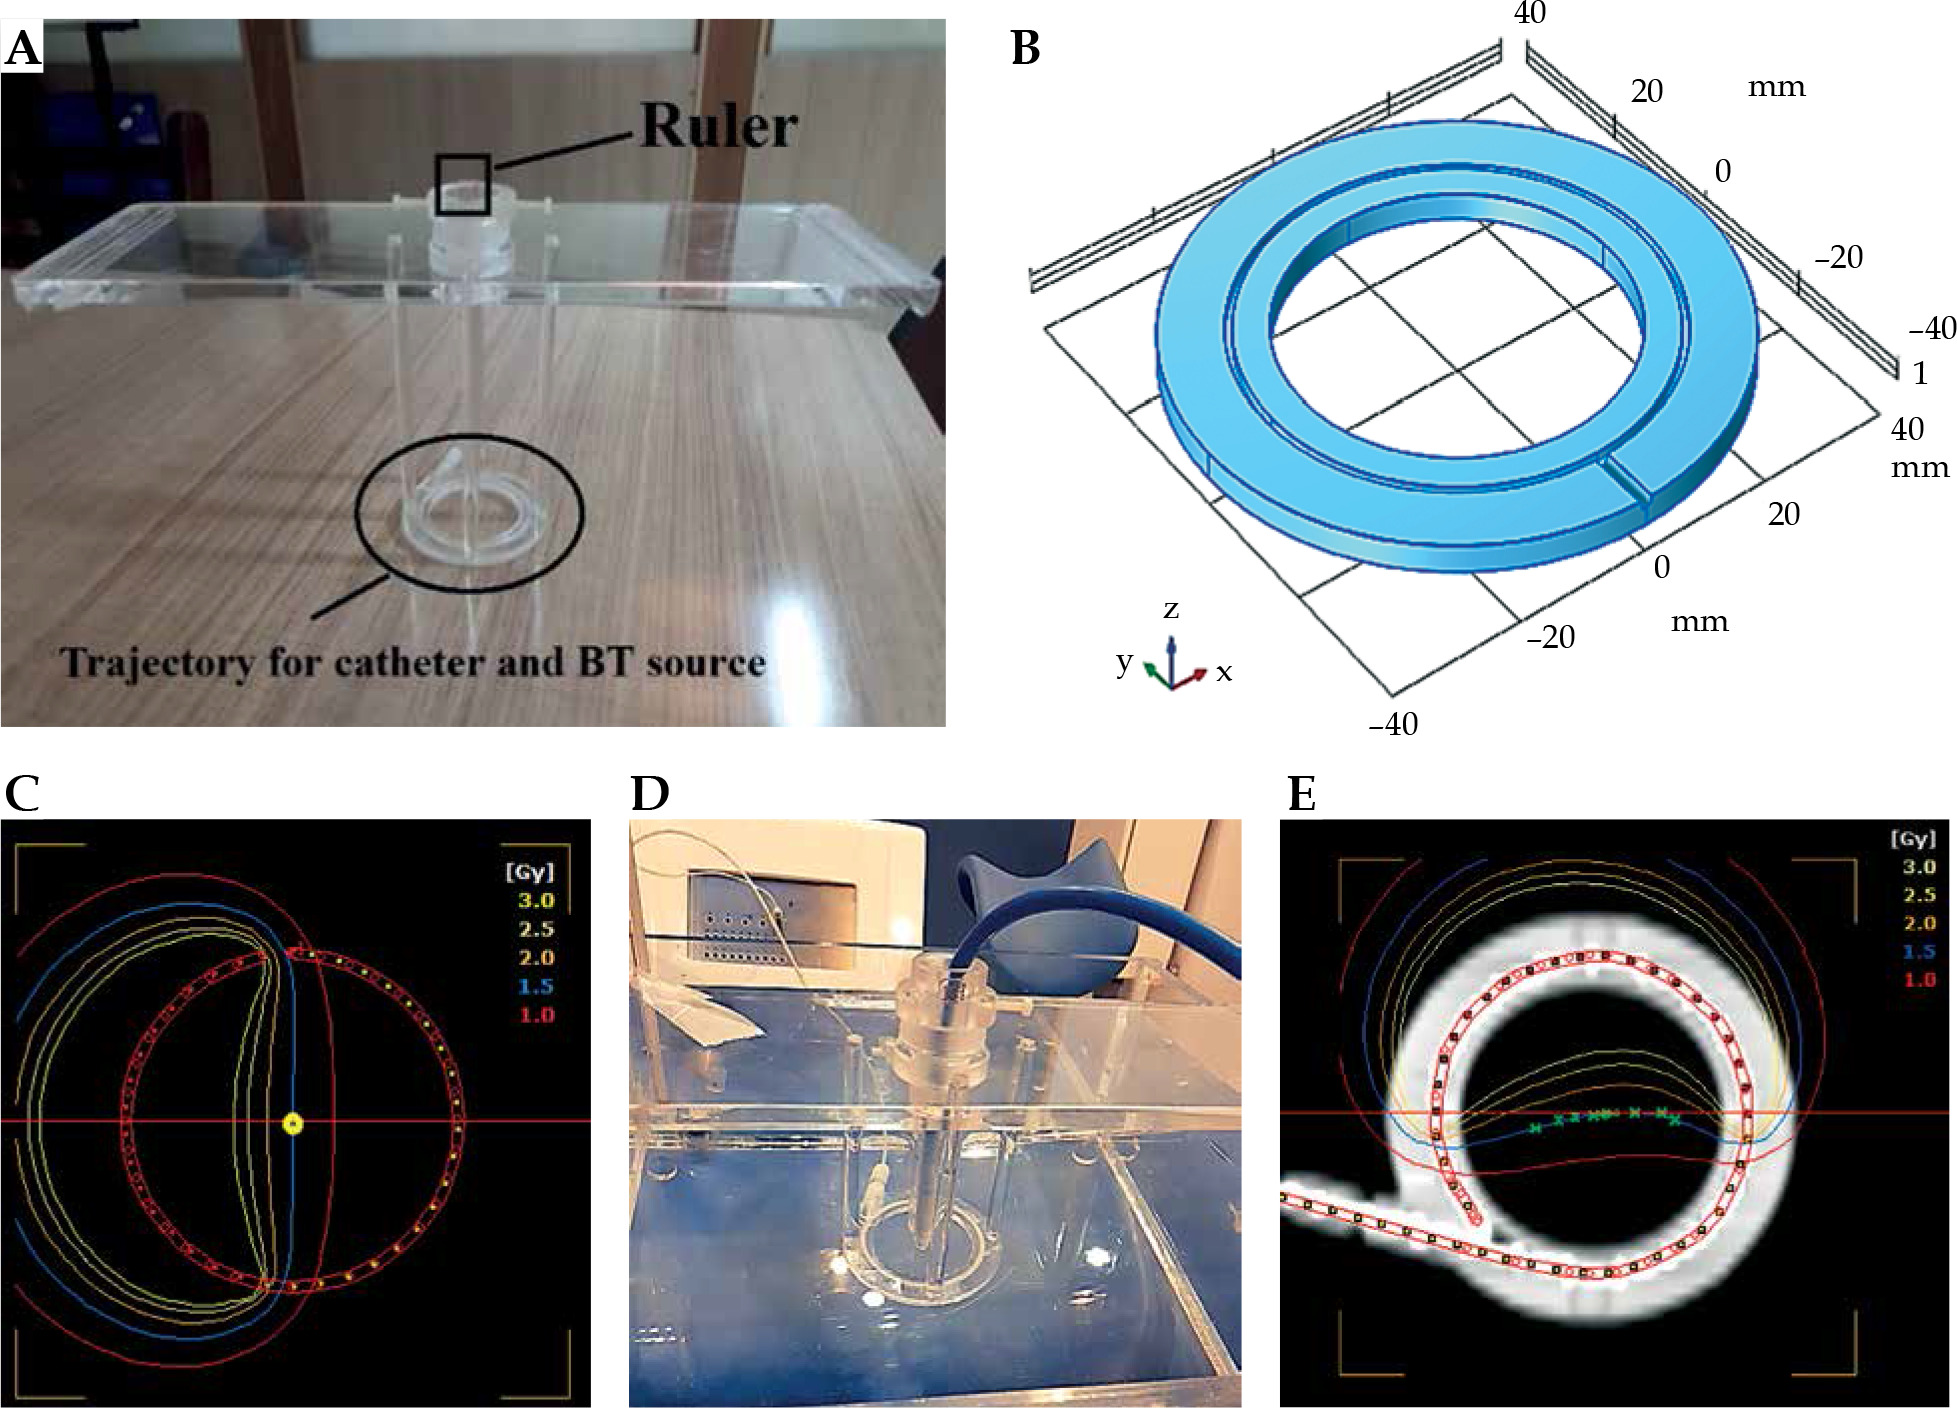
With the help of a ruler, this holder enabled the movement of the chamber in vertical direction to find the ‘sweet spot’ position of the ionization chamber (a position that gives the highest reading) (Figure 1A, D). This position was identified by placing a detector in multiple different positions along the length of the holder in vertical direction, and performing a series of measurements based on the plan with a fairly homogenous dose distribution (Figure 1C) to deliver 150 cGy dose to the center of the circular trajectory (yellow central point in Figure 1C).
This procedure was carried out for cobalt-60 (60Co) source of a SagiNova afterloader (Eckert & Ziegler BEBIG GmbH) using a PinPoint 3D 31016 ionization chamber (PTW, Germany). P0 was filled with water, and P1 was placed inside it to determine the delivered absorbed dose to water (Figure 1D). For each position, three measurements were performed, and a position with the highest reading was identified. To test calculation accuracy of TPS for different dose distributions regarding this geometry, three different plans were generated to deliver 150 cGy to the center of the circle: two plans were made using a CT scan of the phantom (one shown in Figure 1E) producing a dose gradient of about 1 cGy/cm at the center, and another with a higher dose gradient of about 4 cGy/cm), plus a third one using known dimensions of component P1 (measured dimensions of the constructed phantom) producing a lower dose gradient (Figure 1C). In this way, the phantom was used to demonstrate the effect of different levels of dose homogeneity at the measurement point (produced by the three above-mentioned plans) on the dose measured with a PTW PinPoint 3D chamber. Subsequently, the delivered dose was validated by comparing the measured and planned doses.
Equation (1) was applied to determine the delivered dose [33]:
where
Finally, we carried out an uncertainty analysis for dose measurement using component P1.
Validation of volume calculation accuracy: Component P2
Component P2 was designed to assess the accuracy of volume calculation in BT TPSs. Organs at risk in GYN HDR-BT were constructed to provide more relevant validation of the volumes calculated in a TPS [5, 35]. OARs, including the bladder, rectum, and sigmoid colon were developed based on CT images of an anonymized typical female patient treated using HDR-BT with a tandem and ovoids (T&O) applicator set. Detailed descriptions of the construction process will be described in the following.
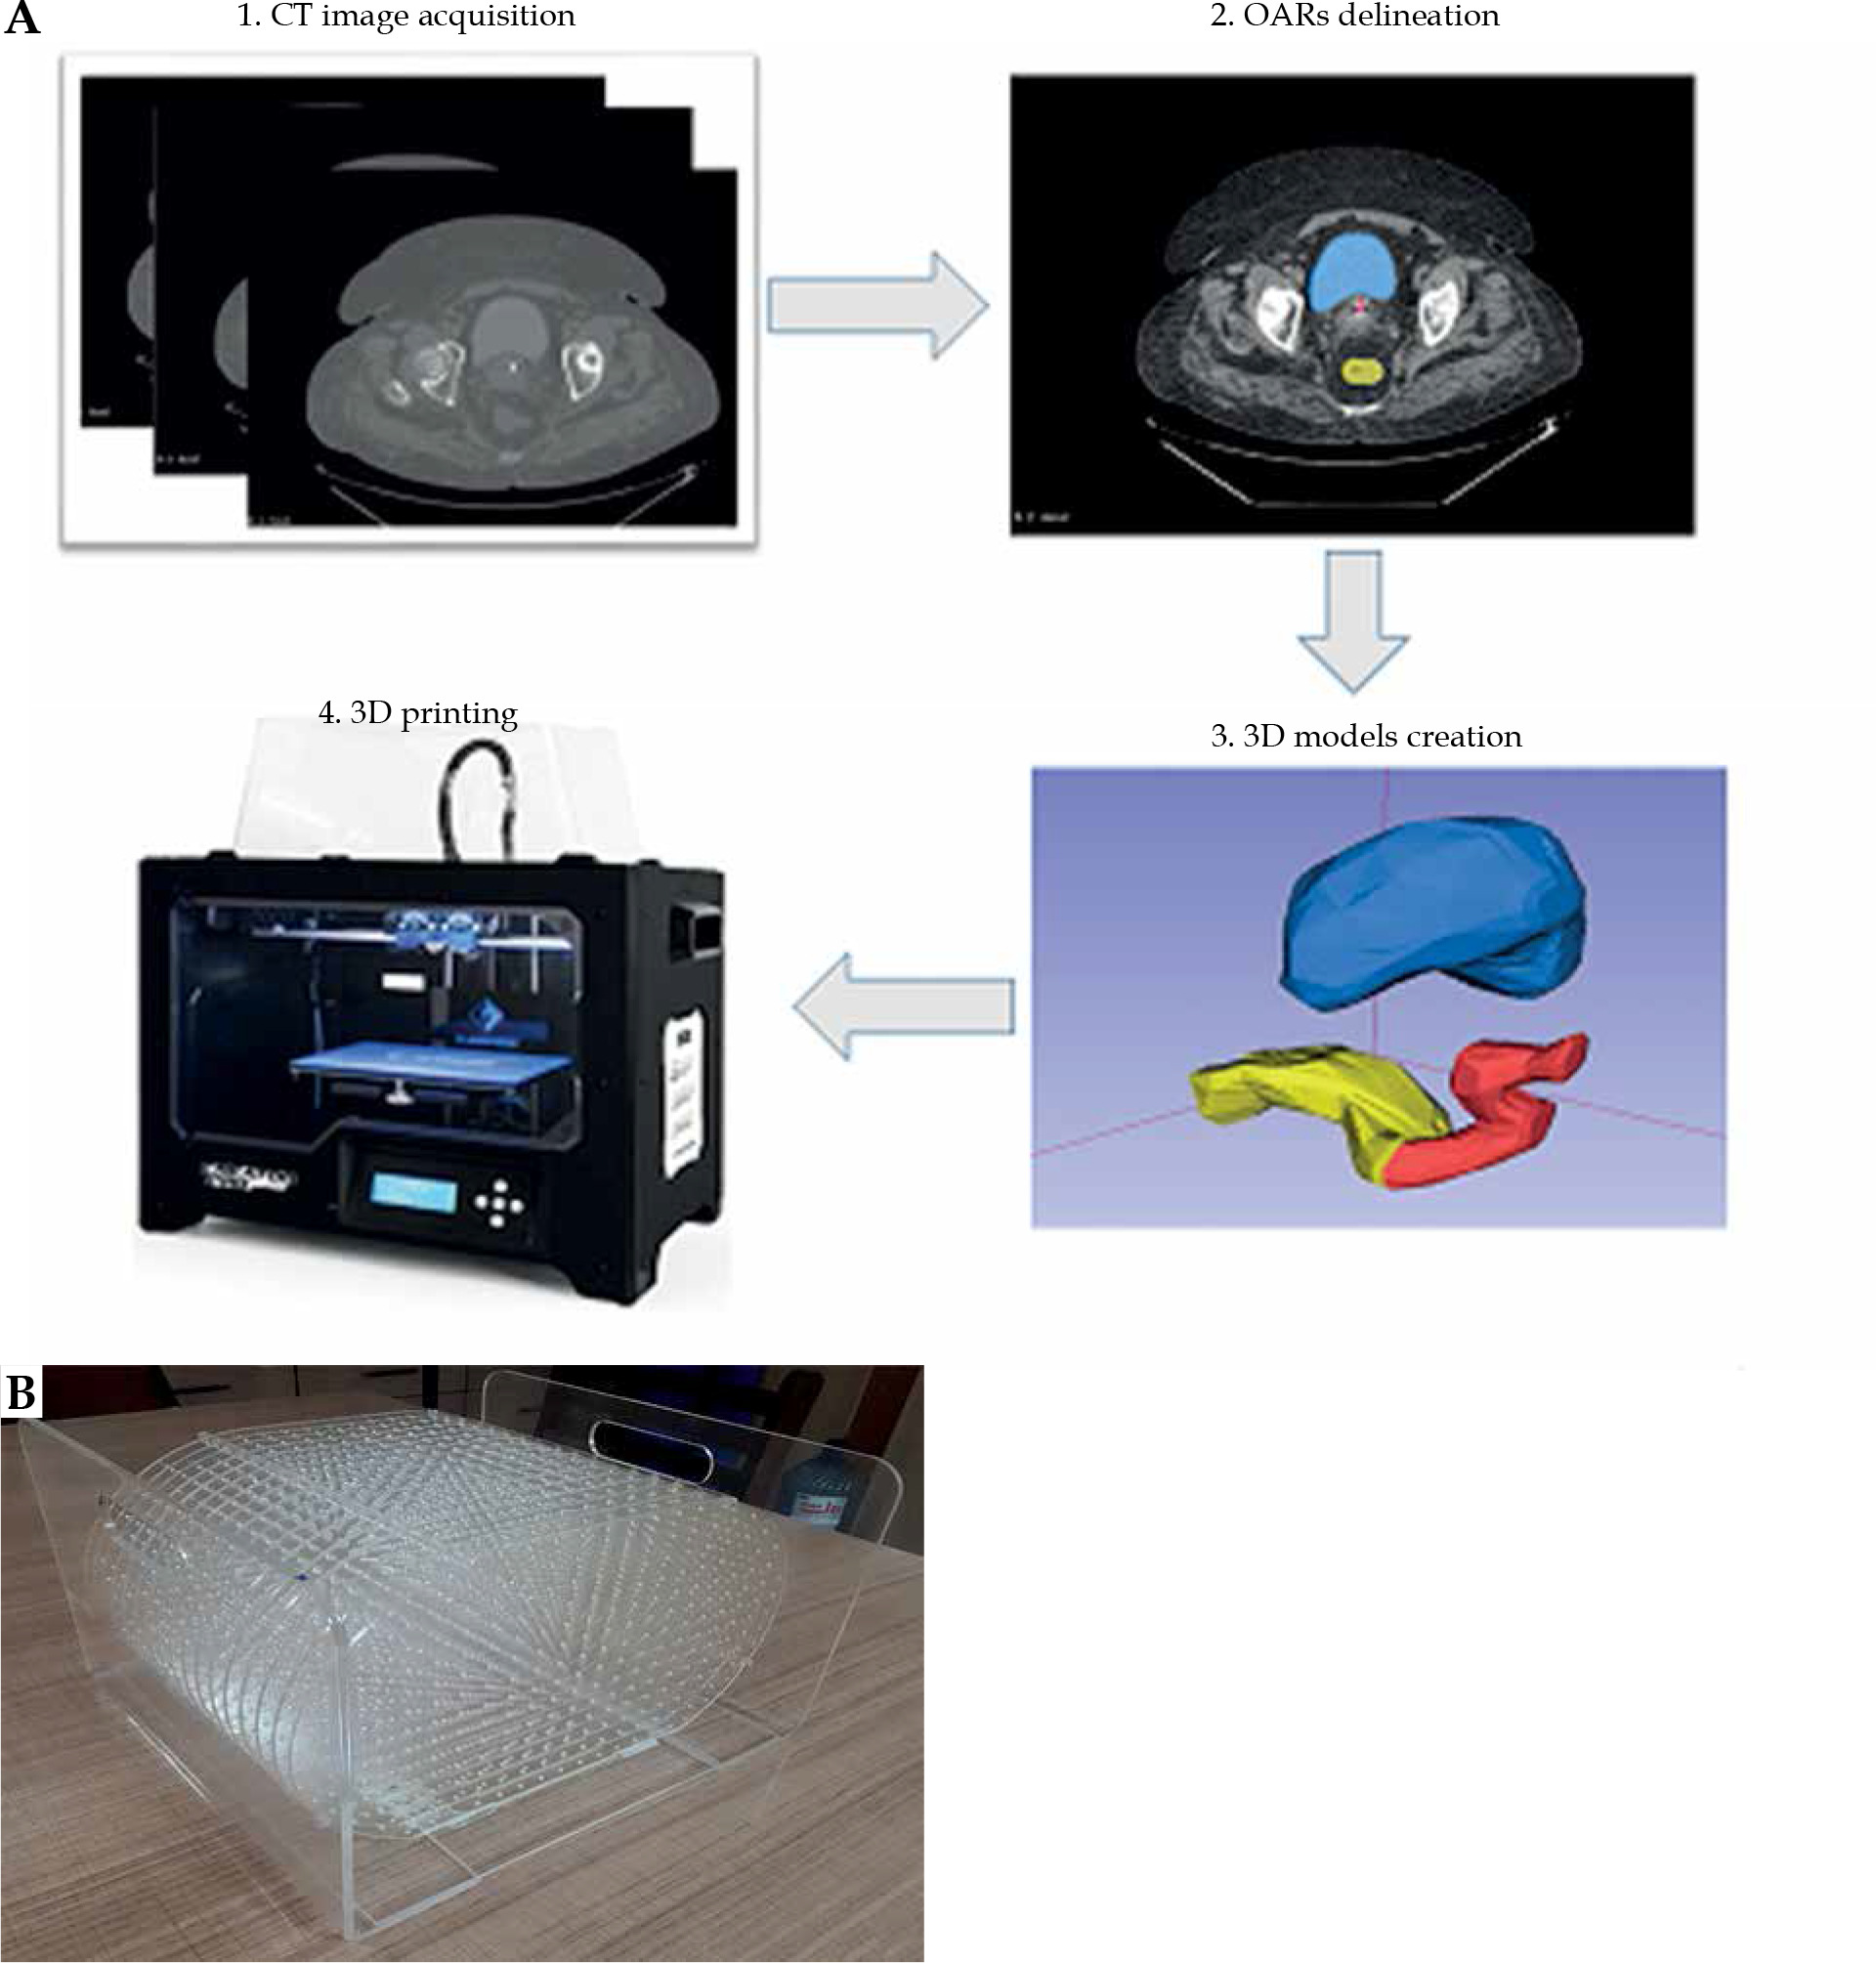
First, CT image was imported into SagiPlan TPS (Eckert and Ziegler BEBIG, GmbH, Germany), and an experienced physician delineated OARs in the TPS. CT images and RT structures were transferred from the TPS to 3D Slicer software [36, 37]. A 3D model of each organ was created by a segment editor module in 3D Slicer and saved in a stereo-lithography (STL) format. Each model was scaled to adjust the structure dimensions according to volumes reported in the literature [35, 38]. It enabled to replace a phantom size based on a single patient with a phantom, whose sizes were representative of a patient population. To determine the exact designed volume of each organ in STL files, 3D Slicer, COMSOL MultiPhysics version 4.4. [39], and STL Viewer [40] software were applied. We compared the obtained volumes from three software to determine the exact volume of a 3D-printed object with lower uncertainty. Finally, the exact volumes were used as the reference values for volume validation.
3D printing of the structures with an acrylonitrile butadiene styrene (ABS) filament was performed using a commercial S-Diaco 3D printer (Nama Gostar Diaco, Isfahan, Iran), which is a fused deposition modeling-based 3D printer (summarized in Figure 2A). Before constructing structures, a test object (a 1 cm3 cube) was printed, and the exact volume of the tested object was compared with the constructed object.
Fig. 2
A) The construction overview of component P2 for validating volume calculation accuracy; B) The component P3 with 17 parallel plates, each including 254 holes as control points for quantification of MRI distortion induced by MRI scanner
Furthermore, two simple PMMA structures were constructed to assess volume calculation accuracy for small objects. The structures were a cylinder of 2 cm diameter and 4 cm height, and an 8 cm3 cube. A single source 20-slice Siemens SOMATOM Definition AS CT scanner (Siemens Healthcare, Forchheim, Germany) was applied to scan the phantom. The structures were contoured on CT/MR images. Then, TPS-calculated volumes were compared with the exact values to validate the volume calculation accuracy of TPS. Because the scope of component P2 was verification of volume calculation accuracy, only CT images would be presented. The volume calculation accuracy was tested in SagiPlan BT TPS (Eckert and Ziegler BEBIG GmbH, Germany).
Quantification of MRI scanner-induced distortions: Component P3
Component P3 was designed to check for geometric distortion caused by MRI scanner for the selected sequences in GYN HDR-BT. P3 had a simple structure for defining point-shaped objects in 3D directions in space. It consisted of 17 layers of custom-built pelvis-shaped plates, made of PMMA, and positioned parallel to each other with an identical center-to-center spacing of 15 mm. Each approximately-elliptical plate had a 320.0 ±0.1 mm major axis, 205.0 ±0.1 mm minor axis, and 4.0 ±0.1 mm thickness, with a flat base for stability. External dimensions of this component were 320 mm × 259 mm × 215 mm (LR × SI × AP), so that its’ size imitated a typical pelvis [41]. Each plate was drilled with a regular pattern of 3 mm diameter holes with 15 mm center-to-center spacing (Figure 2B). Therefore, each plate consisted of 254 holes that could be considered as control points. As an exception, the central hole of the central (9th) plate was eliminated to facilitate the detection of central plate in acquired images. There were 4,317, i.e., (17 × 254) – 1 control points in total. The mass center of each control point could then be used to assess geometric distortion in the images for the implemented sequence(s). Due to their minimal geometric distortion, CT images can be used as the gold standard [28]. Also, CT images of the phantom can be deemed as a reasonably accurate representation of the actual phantom that was MR imaged (having neither the possible differences between the designed and actual versions, nor the uncertainties associated with measuring distances between points on the constructed phantom. Any manufacturing imperfections in the PMMA sheets, positional uncertainties in drilling process of the sheets to generate control points, and/or slight changes in the shape of the phantom over time can all cause small deviations from the originally intended phantom design. The one-to-one correspondence of the control points between MRI dataset and those derived from CT images, determined image distortions. To acquire CT images, component P3 was placed into P0, while being filled with water. CT scans were performed using a 20-slice Siemens SOMATOM Definition AS (Siemens Healthcare, Forchheim, Germany), reconstructed with a 2 mm slice thickness. For MRI acquisition, P0 was filled with water and MnCl2 solution to mimic T1 and T2 of a female pelvis [42]. The MRI unit investigated was a standard-bore 1.5 T Ingenia scanner (Philips Medical Systems, Cleveland, OH, USA). To show the application of AQuA-BT phantom, a 2D T2-weighted sequence was acquired as a typical sequence using the following parameters: repetition time (TR) = 4,500 ms; echo time (TE) = 100 ms; echo-train length (ETL) = 18; voxel dimensions = 0.5 × 0.5 × 2 mm3 with no slice gaps; NEX = 2.
Quantification of applicator-induced distortions/artifacts: Component P4
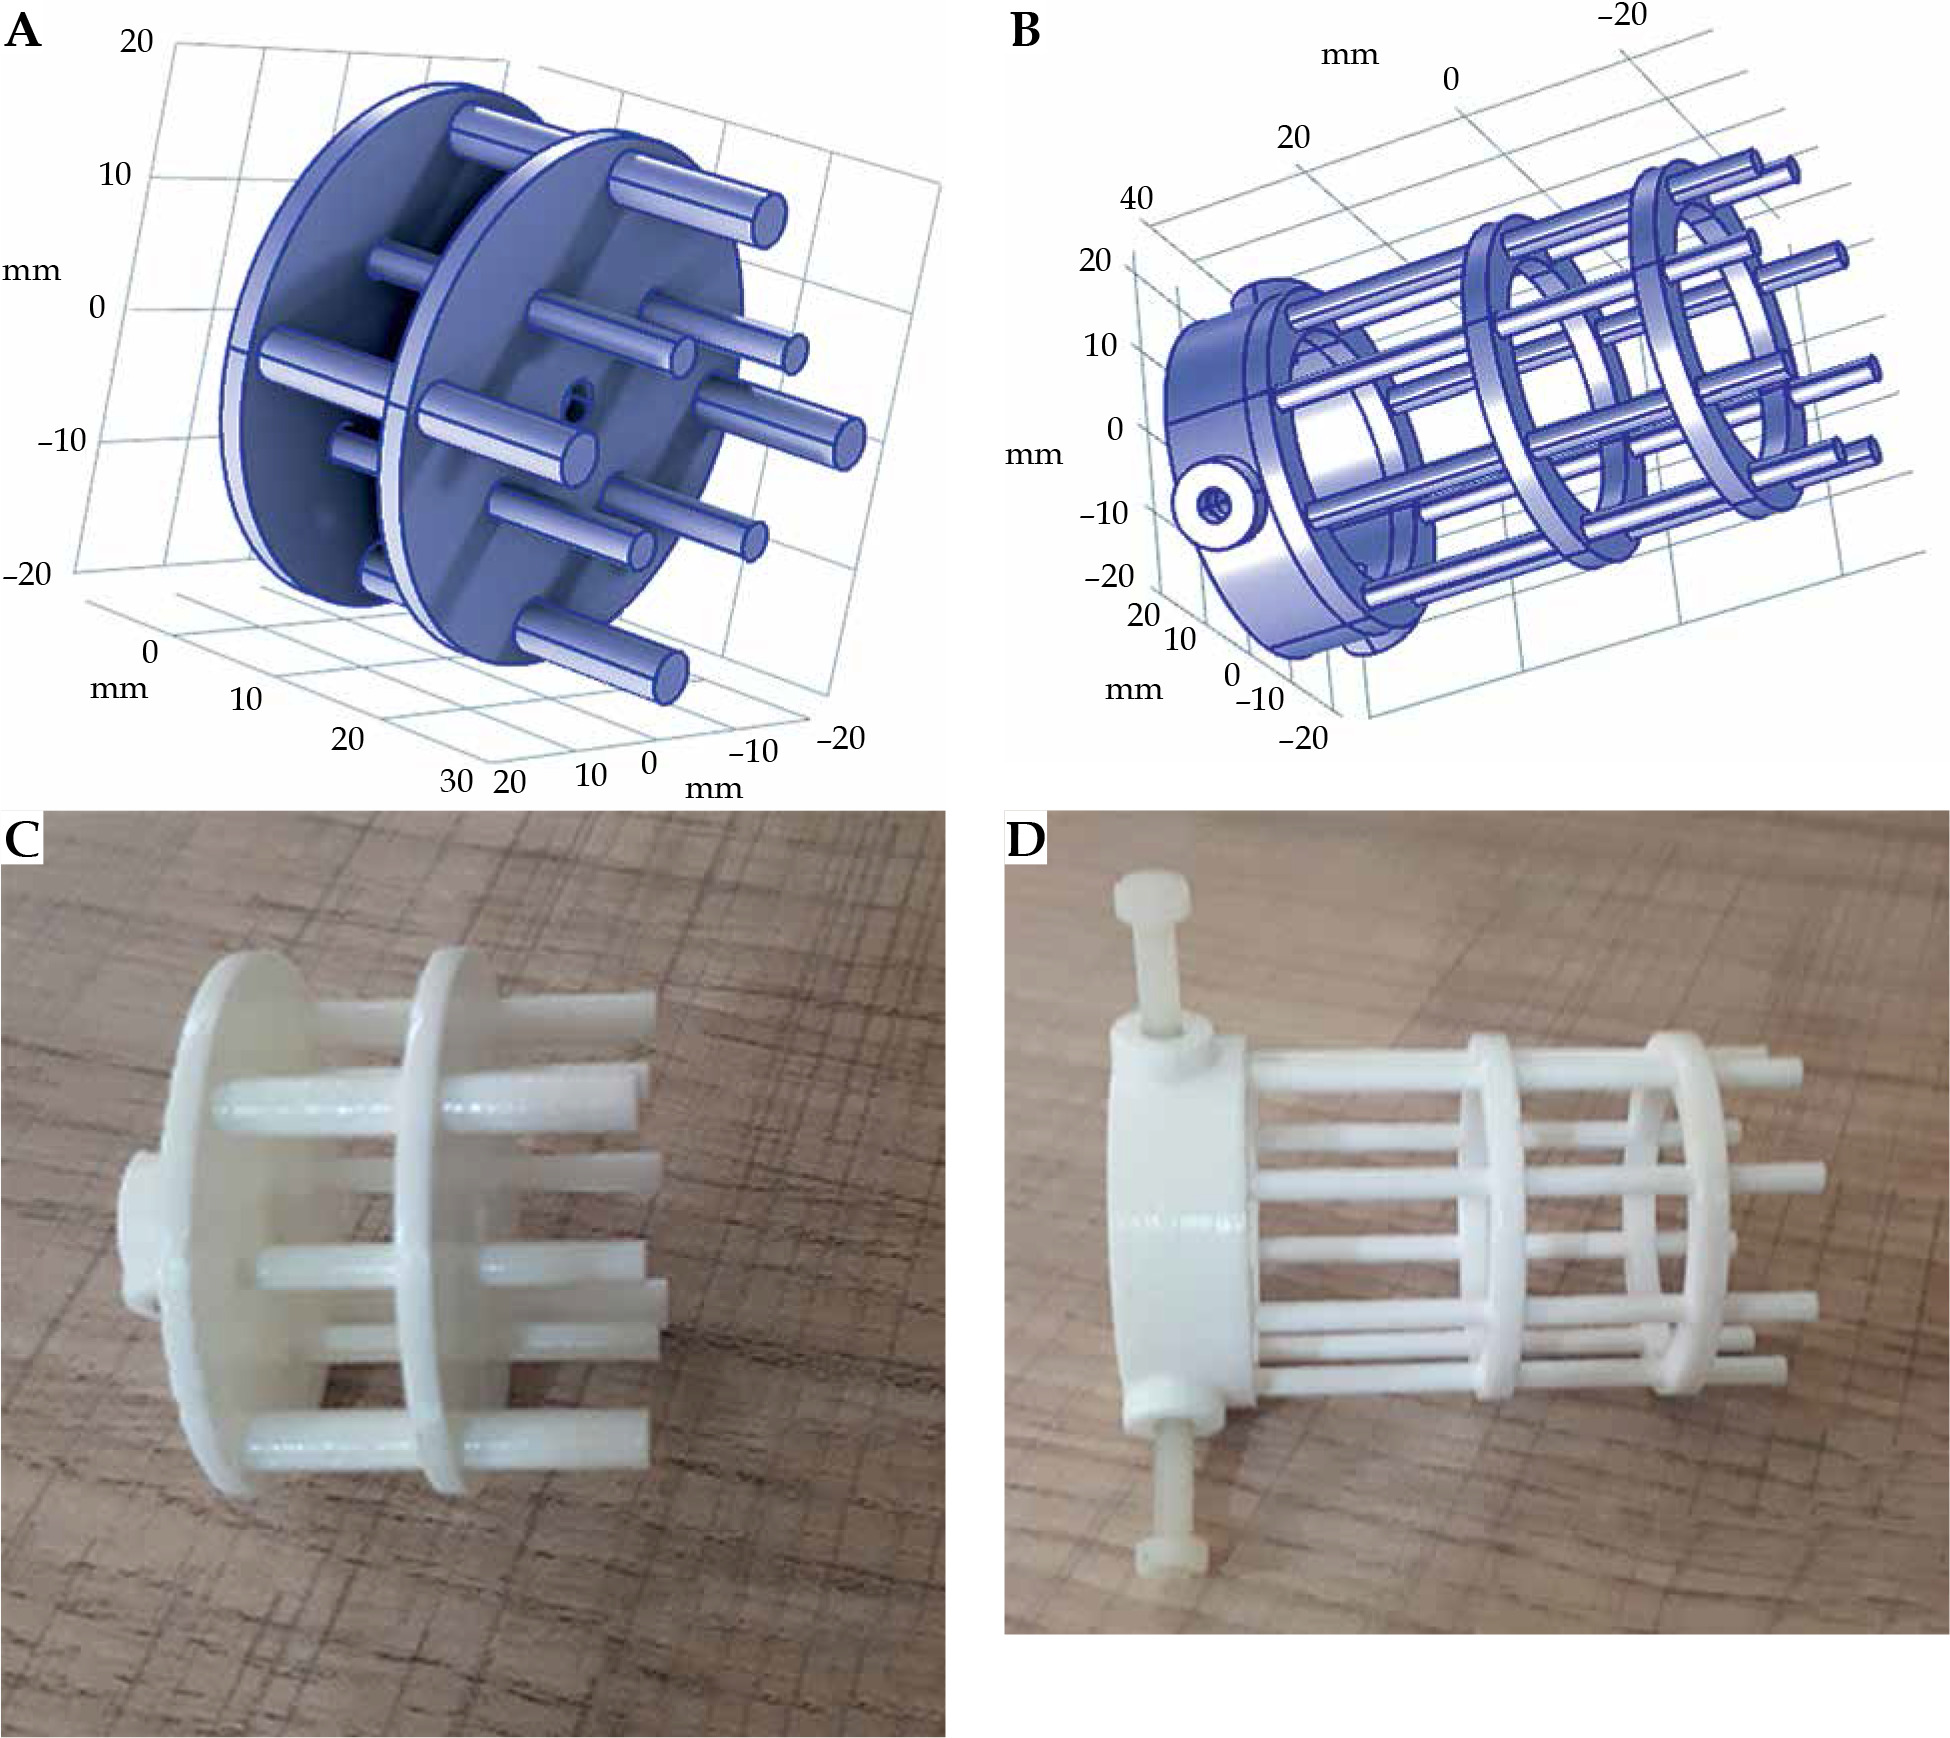
Component P4 (Figure 3A, B) was designed to quantify the artifacts and distortions of titanium T&O applicators and a more recent commercially available Portio applicator (Eckert and Ziegler BEBIG GmbH, Germany). A customized marker was designed for each applicator to quantify image distortions and artifacts in MR images. ABS was chosen as the material for marker construction for MRI compatibility and a close mass density to water (1.05 g/cm3) [43]. The markers for T&O applicators consisted of eight rods, all of which were mounted on two circular plates. A 3.6 mm (5.1 mm) central hole in each circular plate allowed placement of a tandem applicator with a 3.6 (5.1 mm) diameter. Four ABS rods with a 3 mm diameter and 10 mm center-to-center distance from the central hole (tandem) were mounted at 0°, 90°, 180°, and 270°. Four rods with a 4 mm diameter and a 17 mm center-to-center distance from the central hole were mounted at 45°, 135°, 225°, and 315°. The markers were attached to the applicators through three ABS screws and fixed in a clinically relevant orientation into component P0. The distortion was measured using the known distances between the tandem applicator and eight fiducial markers [42]. Customized marker for Portio applicator was comparable with T&O markers. It consisted of a central hole of 25.1 mm diameter and eight ABS rods of 3 mm diameter, which were separated radially by 45°. Figure 3C and D shows the constructed markers for quantifying image distortions and artifacts induced by T&O and Portio applicators, respectively. These markers were mounted to the applicator with an MRI-compatible screw.
Results
Component P0
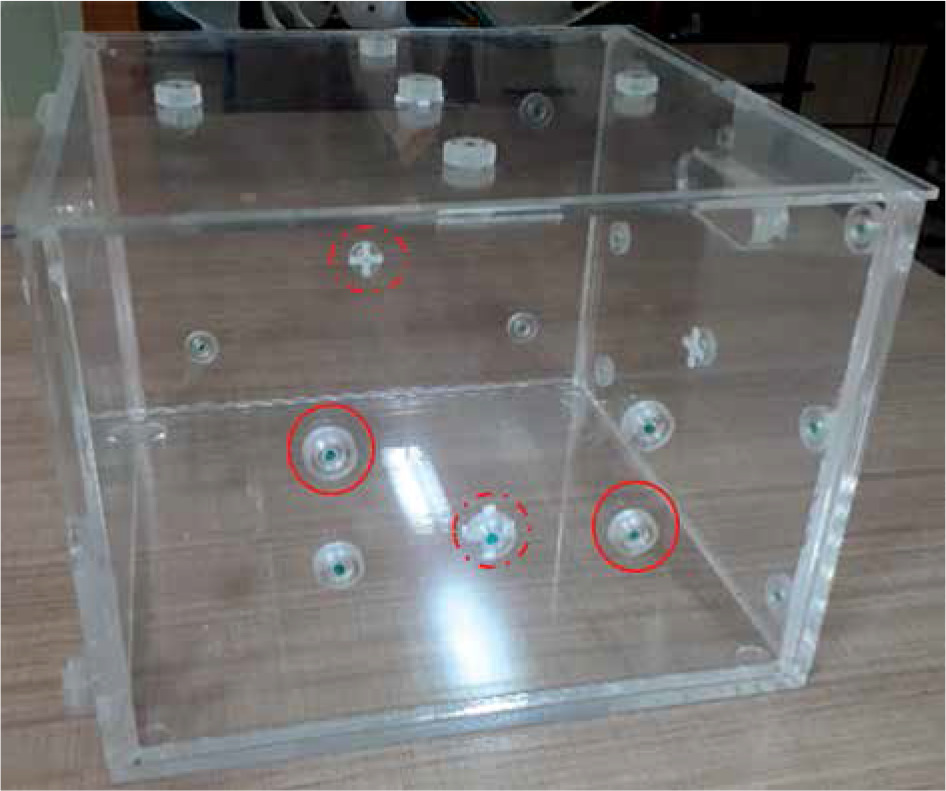
Figure 4 shows a picture of component P0. It also shows how the vitamin E markers (solid circles in the figure) were configured for each wall, which aided image registration. The positions and numbers of markers on each wall of the box were unique to help differentiating LR, SI, and AP directions from each other in the acquired CT or MR images. The vitamin E markers were replaced after they were degraded. When P3 was placed inside P0 for quantification of MRI distortion, five added cross hairs on five faces of P0 aided the alignment of P3 center with the center of the CT and MRI scanners.
Component P1
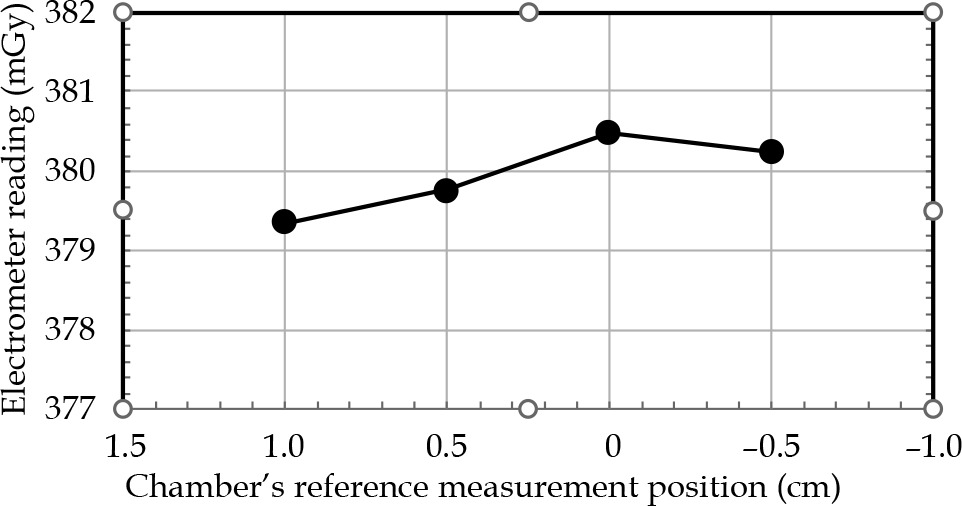
Figure 5 demonstrates the electrometer readings in four positions of the PinPoint 3D ionization chamber in the AP direction for constant dwell time and dwell position. The ‘zero’ position on the horizontal axis represented the coincidence of the reference measurement of the chamber (according to the detector user’s guide), with the center of circular trajectory. This confirmed that the ‘sweet spot’ position corresponded to the reference measuring the point of the chamber. The positive and negative position values indicated the shift of the chamber up and down, respectively. It could be seen that shifting the chamber within –1.0 cm and 0.5 cm positions resulted in a maximum deviation of 0.3% to the reading of the absorbed dose. Therefore, the chamber was set to ‘zero’ position, which provided the maximum dose reading.
Fig. 5
Electrometer reading (proportional to dose) vs. Pin- Point 3D ionization chamber position in vertical (anterior- posterior) direction for constant dwell time and dwell position
The measured correction parameters in Eq. (1) for absolute dosimetry were Pion = 1.001, Pelec = 1.000, Ptp = 1.211, and Ppol = 1.005. The
Table 1 shows the uncertainty analysis for the absorbed dose determination with the PinPoint 3D chamber measurements used in component P1. The uncertainties in the calibration factors for the chamber and electrometer were given from the calibration certificates provided by national secondary-standard laboratory. The charge measurement uncertainty was calculated based on the standard deviation measured during short measurement periods. The leakage uncertainty was calculated with the leakage current recorded during dose assessment. The uncertainties in the source-to-chamber distances were based on an assumption that there was a gap of 0.35 mm between the BT source and catheter hole, and another 0.05 mm gap between the catheter and source trajectory. The measured doses using the chamber were 147.5 cGy, 148.4 cGy, and 147.8 cGy for the plans generated without CT, and with CT images having relatively low- and high-dose gradients, respectively. The corresponding relative differences from the expected 150 cGy were 1.7%, 1.1%, and 1.5%, respectively.
Table 1
Uncertainty analysis for the absorbed dose measured using a PinPoint 3D chamber positioned inside component P1
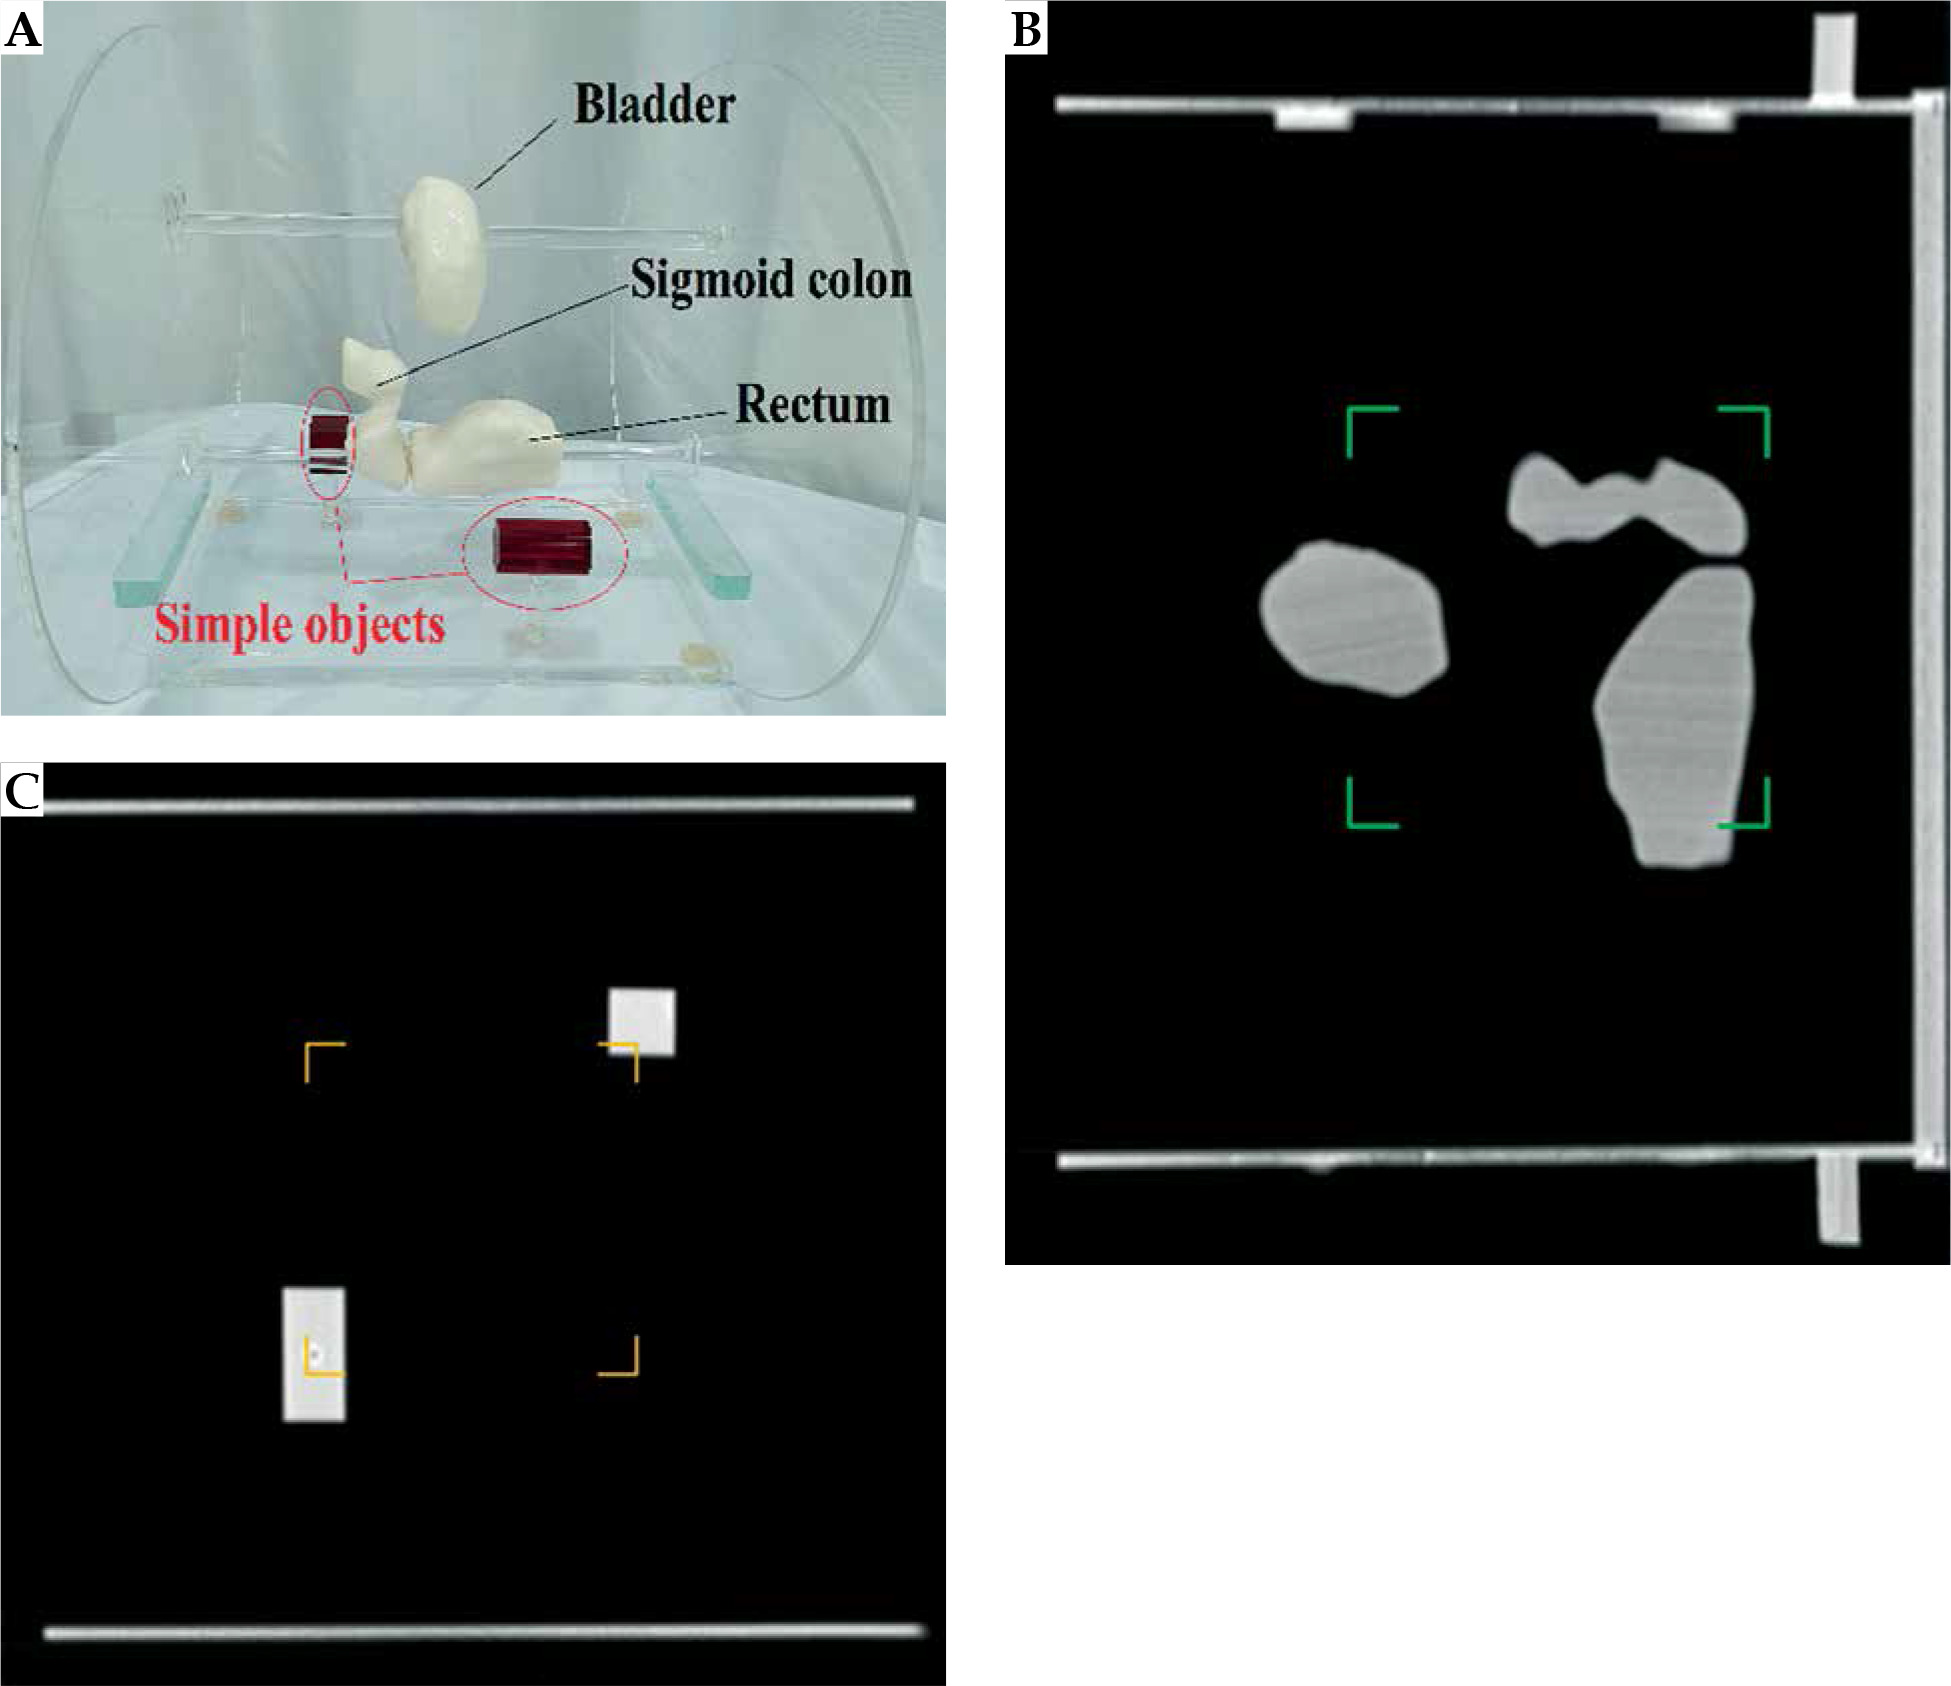
Component P2
Figure 6A shows component P2 with the constructed OARs structures (bladder, rectum, and sigmoid colon) as well as two simple volumes. Figures 6B and C presents the corresponding sagittal and coronal CT images at two different planes, respectively. The maximum relative discrepancy between the exact volumes obtained from the three independent software (3D Slicer, COMSOL MultiPhysics, and STL Viewer) was 0.25%. Therefore, the impact of the software on obtaining the exact volume was negligible. Additionally, the exact volume of the test object was 1.0 cm3, which confirmed the accuracy of a 3D printer for generating the objects with high accuracy. Table 2 compares nominal volumes of each organ and those obtained from the SagiPlan TPS.
Component P3
CT and T2-weighted MR images (without any pre-processing) of component P3 are shown in Figure 7A and B. Table 3 demonstrates the mean ± one standard deviation of the differences in the distance between neighboring control points compared with those on CT images in five axial planes. Each distance was measured using the ruler tool on the SagiPlan TPS. The findings indicate that the discrepancy was less than 1.0 mm over the whole measurement range.
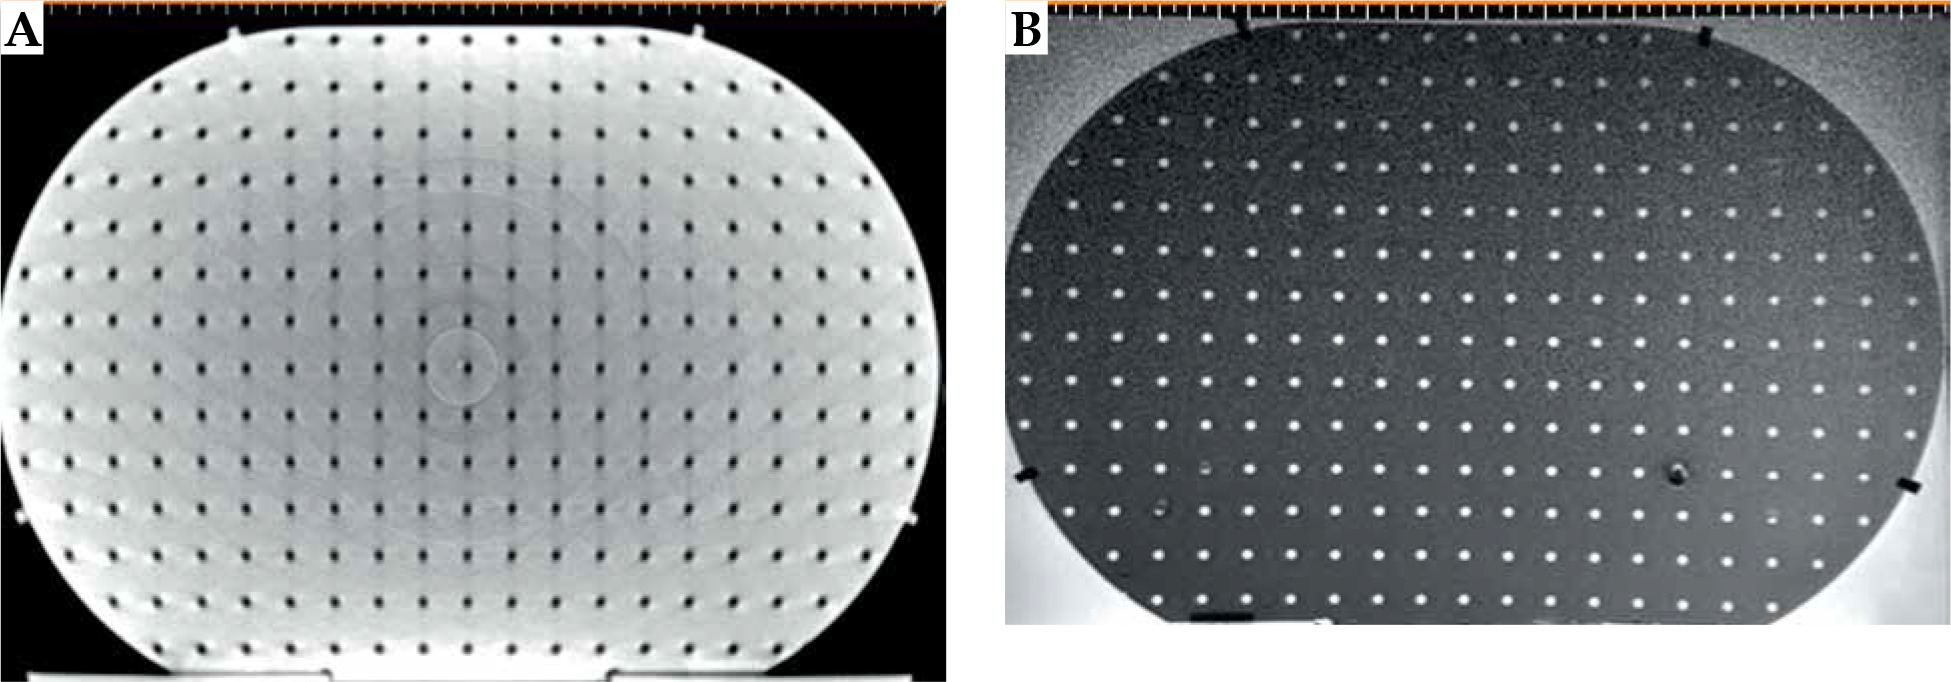
Table 3
Differences* in the distance between neighboring control points in each dimension on each z-plane between T2W MR and CT imaging
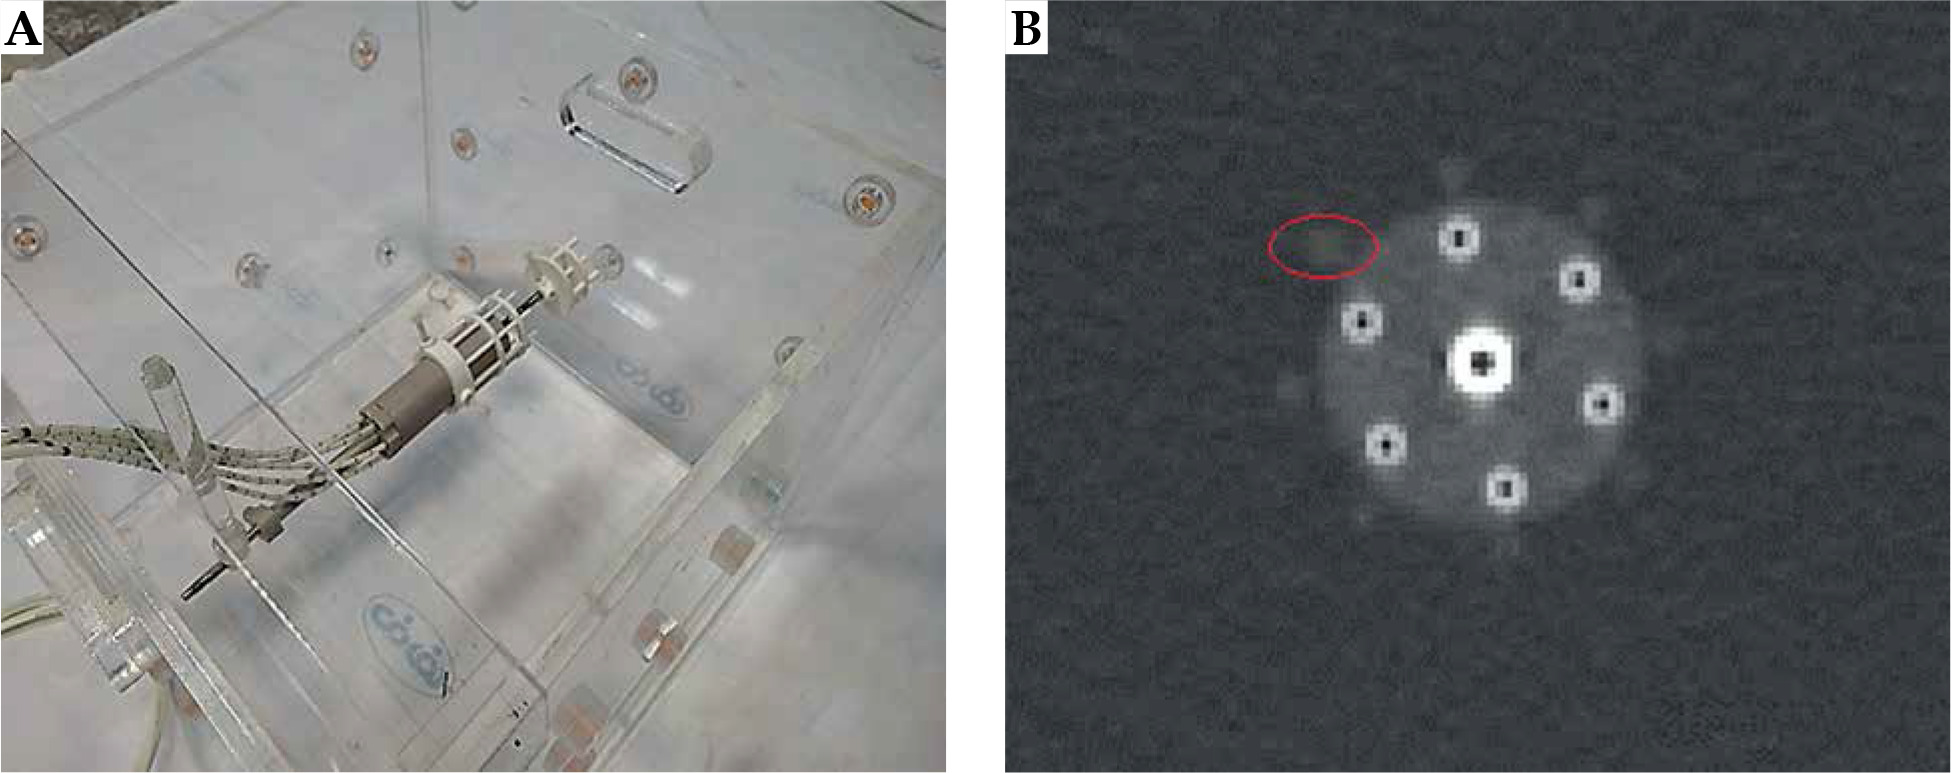
Component P4
The setup configuration for the Portio applicator as an example is presented in Figure 8A. The image distortions can be estimated by comparing the distances from the tandem applicator to each fiducial marker (rod) from MR images to known distances from nominal values or CT images. Moreover, the full-width at half-maximum (FWHM) could be used as a surrogate for image artifacts [42]. A typical axial scan of the Portio applicator with its’ marker is displayed in Figure 8B. Detailed results for this component will be obtained and presented in a further study.
Discussion
Because of the diversity and differences in QA procedures, a BT center often requires various dosimetric and non-dosimetric phantoms and tools for implementation of a robust QA program in the modern BT era. This study aimed to design and develop a multi-purpose phantom for covering the essential requirements of QA procedures for MRI-based GYN-BT. In this paper, the constructed AQuA-BT phantom was introduced, presenting its’ design criteria and construction techniques as well as giving examples of its’ application to the required QA tasks.
Component P0, as a uniform medium for dosimetry, should approximate an unbounded (‘infinite’) phantom for BT dosimetric purposes [32]. The AAPM TG-43 report, which pre-dates the era of MRI-based BT treatment planning, suggests dimensions of about 400 mm × 400 mm × 400 mm [32]. While it ensures the steady-state, full-scatter conditions that underpin some of the basic assumptions made in the TG-43 formalism by avoiding proximity to media interfaces, this large size is impractical for a phantom with several tasks, especially given the difficulties and limitations regarding its’ placement on the table and within the bore of an MRI scanner. The constructed phantom height is 270 mm to reduce the overall weight and dimensions of the phantom. The 360 mm × 360 mm × 270 mm dimensions are, nevertheless, expected to be sufficiently large and have negligible effects on BT dosimetric measurements [33, 44]. If deemed necessary for the application of interest, some extra water-equivalent plastic slabs (usually available in radiotherapy departments) can be added to surround P0 component during dosimetric measurements to fulfill the TG-43 requirements completely.
Component P1 of the phantom provides an appropriate tool for verifying TPS dose calculation algorithms in water with an uncertainty of 1.8%. Although some phantom studies have been published for TPS dosimetric verification, they measured absolute dose in water-equivalent plastic [33] or PMMA [14]. Especially in the latter case, correction to absorbed dose to water is required. Additionally, the AQuA-BT phantom can employ a waterproof ionization chamber that does not require post-processing, unlike thermo-luminescence dosimeters [14] or radiographic films [15]. Therefore, incorporating this phantom into a commissioning and QA workflow as well as audits would be relatively straightforward. We used a small-volume (0.016 cm3) ionization chamber to reduce volume-averaging effects [45]. The small differen-ce of 0.2% between the measurements in the two different dose gradients also indicate the suitability of PinPoint 3D chamber for this phantom in two dose gradients that may be encountered in HDR-BT.
Component P2 of the phantom helps physicists to achieve a better understanding of TPS behavior for volume calculation and DVH-based concepts. Kirisits et al. previously developed a simple phantom to investigate the accuracy of volume and DVH parameters [35] for different TPSs. We used a 3D printing technique to mimic a more realistic size and shape of organs treated in GYN-BT. This phantom, therefore, can provide more relevant knowledge of TPS behavior for this application. Additionally, the contouring accuracy, slice thickness, and intra-observer variation affect the volume calculation accuracy. Component P2 also allows investigation of the effects of these factors on volume calculation accuracy [35]. Such investigations, however, are outside the scope of the present paper. The extent and dosimetric impact of MR image distortions in EBRT treatment planning have been investigated for various treatment sites [26-28]. The use of an appropriate phantom for end-to-end testing to ensure an accurate MRI-based planning and delivery process has been recommended in EBRT [41]. Because of the steep dose gradients in BT, the geometric accuracy of MR images is more crucial for ensuring dose delivery accuracy. In the context of BT, Wills et al. investigated the magnitude of MR image distortion induced by a 0.35 T MRI scanner using a phantom that presented 2D measurements of image distortions. To obtain data in another plane, they had to rotate the phantom and acquire an additional scan [29]. Component P3 of our phantom, with its’ more realistic size and shape regarding female pelvis, provides the means for direct 3D measurement of the image distortions without any additional images. Also, well-known distances between points in P3 as well as its’ CT images can be used as the gold standard for investigating MRI distortions [28, 46]. Component P3 can also be applied in investigating image fusion capabilities of TPSs used in GYN HDR-BT.
Quantification of the artifacts and distortions induced by metal applicators has become increasingly important [8, 47]. BT centers need a specific phantom for their applicators to select imaging protocols according to their own results. Component P4 enables physicists to understand the extent of artifacts and distortions of T&O and Portio applicators. Although phantoms have been applied to quantify the magnitude of artifacts/distortions induced by T&O applicators [13, 30, 48], they have been dedicated to quantifying the artifacts and distortions. Our phantom, in contrast, can be used to address a variety of dosimetric and non-dosimetric challenges. Moreover, to the best of our knowledge, no phantom or tool has been utilized to investigate the effects of the Portio applicator. Furthermore, the use of our phantom can reduce some related potential failure modes in GYN HDR-BT, including selecting a wrong MRI sequence and generating MR images with severe artifacts [11].
The described phantom has a number of uncertainties in the development process. The first is related to the chamber to source distance in component P1. The gap between radioactive source and catheter hole is about 0.04 mm, which can result in an approximately 0.5% difference between the measured and expected doses. Moreover, the current P1 geometry cannot allow assessment of dosimetric accuracy in the presence of various applicators with different materials and geometries. The second uncertainty is related to the thickness layering in 3D printing technique for component P2. It is 50 μm for the applied 3D printer in this study, which is negligible. Another uncertainty is a ±0.1 mm difference between the nominal and exact thickness of PMMA plates applied for component P3. However, the utilization of CT images as the gold standard and comparison of them with MR images for the quantification of distortions may help; this method is also limited by the precision of manually-applied TPS ruler.
Furthermore, the weight of our phantom can be deemed as a limitation. The dosimetric experiments and MRI acquisition require water medium and MnCl2 solution, respectively. It increases the overall weight of the phantom to 30 kg, although it is comparable to similar phantoms that have been previously implemented for dosimetric purposes [14, 15].
In this paper, the capabilities of the phantom to perform QA tests were briefly presented. A more detailed set of investigations for each QA test using this phantom is underway.
Conclusions
Our findings show that this phantom allows the main necessary dosimetric and non-dosimetric verifications for commissioning and QA of MRI-based GYN-BT. The phantom would enable physicists to perform QA procedures that require a phantom, including quantification and optimization of MRI acquisition techniques according to a BT department, quantification of distortions and artifacts induced by the intended MRI-compatible applicators, validation of volume calculation accuracy of TPSs, and verification of dose calculation algorithms of TPSs.


