
Purpose
Inverse planning algorithms have been routinely used in external beam therapy for intensity and volume modulated radiotherapy for several years, but in brachytherapy (BT), it cannot be considered as a standard planning method yet. In BT, the classical dosimetry systems played an important role in standardizing the treatments and were developed for low-dose-rate (LDR) sources. However, the introduction of high-dose-rate (HDR) stepping source technique opened new possibilities in clinical dosimetry. Furthermore, the introduction of cross-sectional imaging and 3D target volume definition in BT required new planning approaches. Forward optimization is now regularly used for BT planning, and the most accepted methods are the geometrical (GO) and graphical optimizations (GRO), which can provide clinically acceptable dose distributions for breast implants [1,2,3,4]. During GO, there is no need for defining dose points, because dwell positions themselves serve as reference dose points for optimization. After GO, the dwell time at any dwell position is inversely proportional to the dose delivered by other dwell positions, resulting in homogeneous dose distribution. If the catheters geometrically cover the target volume properly, the planning target volume (PTV) is encompassed by the reference isodose surface. In case of possible geometrical miss of the catheters, an underdosed region can develop in the PTV, which can be decreased using the GRO. With the drag-and-drop method, an isodose line can be shifted into a desired position on the CT image with the cursor on the screen. However, it must be remembered that with improving target coverage, the dose homogeneity deteriorates. In BT, the coverage is generally characterized by the V100 (percentage of PTV receiving at least 100% of the prescribed dose [PD]), while the dose homogeneity is considered as the DNR (dose non-uniformity ratio). The latter is the ratio of volumes irradiated by 1.5 times the PD and the PD. To make an optimal plan, many steps must be occasionally repeated during the planning process, with continuous evaluation of the dose-volume histogram (DVH) parameters. Since the target coverage and dose homogeneity always change in the opposite direction, there is a big challenge for the planner to meet both conditions with a compromise. This requires repetitive dose calculations, which can be time-consuming. On the contrary, during inverse optimization, all dosimetric requirements (dose coverage, dose homogeneity, organs at risk [OARs] protection) are simultaneously and automatically considered. Inverse optimization always requires cross-sectional imaging, since it is anatomy-based, and the 3D volume definitions are its preconditions. The two most frequently used algorithms in BT are the HIPO (hybrid inverse planning optimization) [5] and IPSA (inverse planning simulated annealing) [6].
In BT, apart from prostate cancer, the integration of inverse planning into clinical routine has not been accomplished so far. In the literature, there are reports on the use of inverse planning for cervix cancer [7,8,9,10,11,12,13], vaginal irradiation [14,15], and head and neck brachytherapy [16,17]. For breast cancer, the available information is scarce. Among partial breast irradiation techniques, interstitial brachytherapy has the longest patients’ follow-up and the highest level of evidence as an alternative treatment option to whole breast irradiation [18,19,20]. Based on our experience with forward planning in breast BT, in this work, we performed a detailed investigation about the feasibility of inverse planning in interstitial HDR breast implants and compared its efficacy with conventional forward planning regarding target dosimetry and protection of OARs.
Material and methods
First, a representative case was selected to investigate the effect of optimization parameters on target dosimetry during inverse optimization. The Oncentra Brachy v.4.5.3 planning system (Elekta Brachytherapy, Veenendaal, The Netherlands) was used for both forward and inverse optimizations. The HIPO implemented in Oncentra Brachy is based on dose-volume parameters defined as minimum (MinValue) and maximum (MaxValue) dose limits for targets [5,21], and for OARs, only maximum dose limits are considered. Based on these dose limits, HIPO calculates a corresponding objective function, and with an importance factor or penalty (MinWeight, MaxWeight) defined by the user, HIPO calculates the total objective function, which is then considered for the optimization. The total objective function is subsequently calculated as the weighted sum (aggregation) of all individual objective functions. The results of optimization are the source dwell times.
Using HIPO, the effects of different weight factors and dwell time modulation on target dosimetry were investigated in detail and subsequently, their optimal values were defined. As a first step, the minimum weight (MinWeight) was changed between 0 and 100 in steps of 10, and its effect on V100 and DNR was calculated at various dose homogeneity. Then, the maximum weight (MaxWeight) was changed between 0 and 100 in steps of 10, and V100 and DNR were calculated at different target coverage. Afterwards, the optimization on normal tissue and OARs was studied. For normal tissue, the role of maximum dose value and its weight were examined. The objectives used for an OAR situated close to and far from the PTV (skin and rib, respectively) were also changed, and subsequent target dosimetry was assessed. The target volume was adjacent to skin and a few cm away from the rib.
HIPO includes an option for modulating dwell times in neighboring dwell positions, which is called dwell time gradient restriction (DTGR). The DTGR parameter takes value between 0.0 and 1.0. At value of 0.0, there is no restriction, and large fluctuations between neighboring dwell times can develop. When maximal value is applied (DTGR = 1.0), the resulting distribution of dwell times in catheters will be smooth, similar to GO. The effect of modulation of neighboring dwell times on target coverage and dose homogeneity in HIPO was also investigated. The parameter of DTGR was changed between 0.0 to 1.0 in steps of 0.1, and V100 and DNR were calculated.
In the second part of the study, treatment plans of forty-two patients with early stage breast cancer who were treated with accelerated partial breast irradiation using multicatheter interstitial brachytherapy were selected. The patient selection and target volume definition were based on the GEC-ESTRO recommendations [22,23]. Using the optimal input parameters determined in the first part of our study, competing treatment plans were made with HIPO, and they were compared with the original forward plans.
Implantation and forward planning
Our implantation technique was based on two CT imaging. The first one was used for planning the position of catheters, and then the treatment planning was completed by a second imaging performed after the implantation. First, lumpectomy cavity, PTV, and organs at risk were delineated and then, the catheters were reconstructed using the CT information. After that, the source dwell positions were activated inside the PTV with 0 margin, and geometrical optimization was performed. Basal dose points were created in the central plane and after normalization, an isodose line was selected for dose prescription, so that the target coverage be at least 90%. The f-factor used for dose prescription ranged between 0.75 and 0.90, corresponding to isodose level of 75% and 90%. At the same time, a proper dose homogeneity had to be maintained with the DNR ≤ 0.35. At conflicting values, the target volume coverage was prioritized. In case when the target coverage was not sufficient, graphical optimization was applied to improve the dose distribution locally in the underdosed regions. The prescribed dose (PD) was 7 × 4.3 Gy. This method is called conventional or forward planning, and referred as GO + GRO. The catheters were implanted into the breast in a triangular pattern, with a separation of 1.3 cm. The source step size was 2.5 mm, the first/last source position in the catheters was always at least 5 mm from the skin surface. The resolution of calculation matrix was 1 mm.
Inverse planning
Retrospectively, for each patient, a plan with inverse optimization (HIPO) was made using the same CT images and contours used in forward planning. The input parameters in HIPO that were used included: for PTV – MinWeight = 75, MinValue = 100, MaxWeight = 25, and MaxValue = 150, and for normal tissue – MaxWeight = 5 and MaxValue = 120. Normal tissue, which is always mandatory for the optimization, is considered as all tissues surrounding the PTV, excluding any other OARs. For other OARs, no objectives were applied here. The MinValue and MaxValue were related to the PD as percentages. The value for DTGR parameter was selected to be 0.2. The active source positions were inside the PTV, similarly to GO + GRO.
Competing plans were assessed and compared with dose-volume parameters, such as relative volumes receiving a percentage of PD (e.g., V100, V90, V50) and relative doses in percentage of the PD to small absolute volumes (e.g., D0.1cm3, D1cm3). Since the skin and ribs were not delineated as whole organs, the V5 for skin and the V50 for ribs were given as absolute value in cm3. The dose homogeneity was described by the DNR (dose non-uniformity ratio) and the conformality with COIN (conformity index). The COIN simultaneously considers the coverage of PTV and irradiation of normal tissues outside the PTV by the PD [24]. Descriptive statistics were used to characterize the two groups of treatment plans, and the distribution of parameters was tested with Shapiro-Wilk’s W test regarding normality. Since most of the parameters were not normally distributed, non-parametric Wilcoxon matched-pairs test was used for all comparisons with Statistica 7.0 software (StatSoft, Inc., Tulsa, OK, USA), and p < 0.05 was considered statistically significant.
Results
A representative patient with a PTV of 34 cm3 and implanted with 12 catheters was selected to study the effect of optimization parameters in HIPO.
Target coverage and dose homogeneity
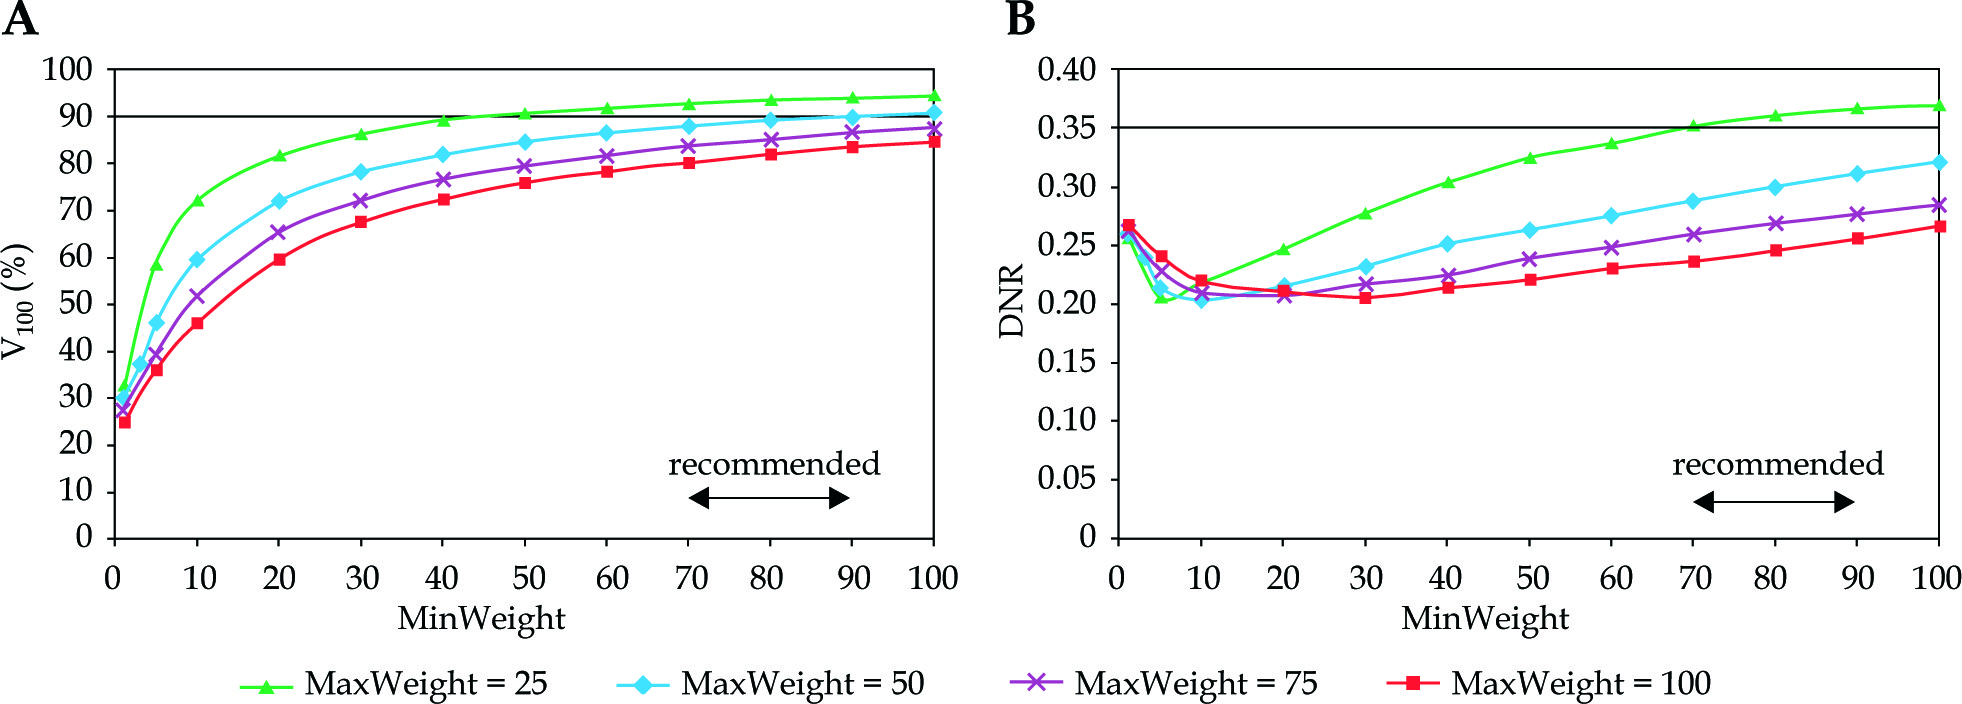
In Figure 1, the target coverage and dose homogeneity are presented in the function of minimum weight at different homogeneity parameters. As the minimum weight increased, the V100 continuously improved. The larger the MinWeight, the higher the V100 (Figure 1A). Furthermore, the maximal coverage developed when the constraint for dose homogeneity was weak (MaxWeight = 25). When the homogeneity was the greatest (MaxWeight = 100), the coverage was less than 80%. The dependence of DNR on MinWeight was not monotonous (Figure 1B). As the MinWeight increased, the DNR decreased first and then slowly increased. The lowest DNR was around 0.20 but developed at different MinWeight depending on the MaxWeight. Based on the graphs in Figure 1A, the value for minimum weight in the range of 70-90 seemed to be an acceptable compromise between the target coverage and the dose homogeneity.
Fig. 1
Dependence of target coverage (A) and dose homogeneity (B) on the weight factor for minimum dose (MinWeight) at the periphery of PTV. The horizontal line shows the planning aim and the double-headed arrow indicates the range of recommended values. V100 is the percentage of PTV receiving the prescribed dose, DNR is the dose non-uniformity ratio. MaxWeight is a weight factor controlling the dose homogeneity in the PTV
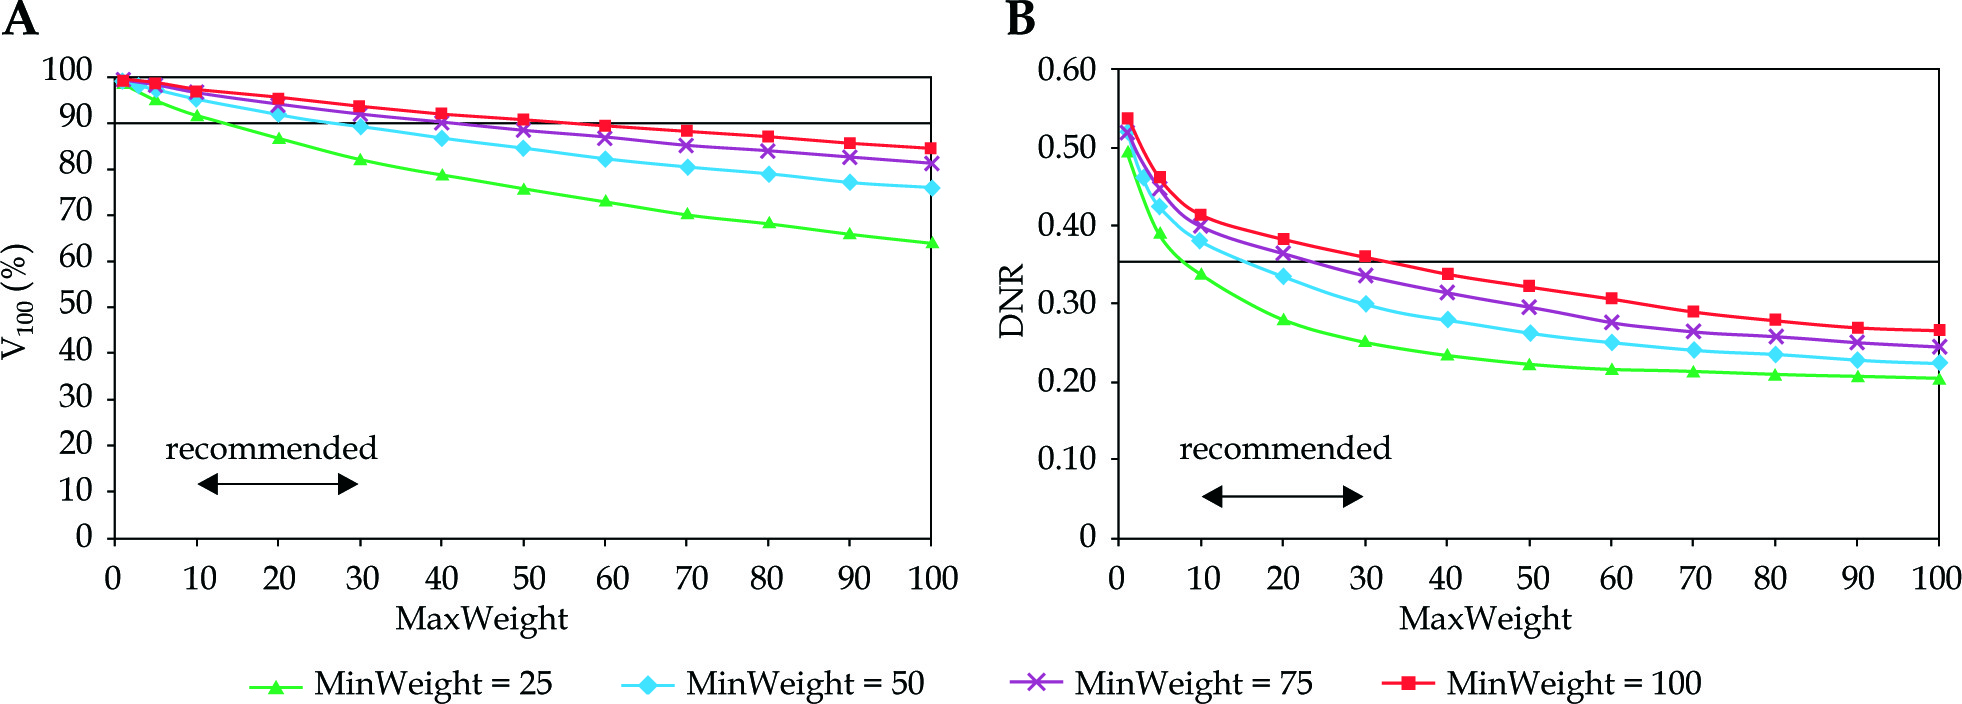
Looking at the changes of V100 and DNR in the function of dose homogeneity parameter (MaxWeight), an explicit dependence was observed. Putting emphasis on the importance of dose homogeneity both the V100 and the DNR decreased (Figure 2). The DNR was the lowest at MinWeight = 25 (Figure 2B), but the coverage was not acceptable at MaxWeight higher than 10. The V100 was greatly influenced by the MinWeight and the MaxWeight, which is shown in Figure 2A. Only low values of MaxWeight resulted in adequate coverage (V100 ≥ 90%), but the DNR was high at MaxWeight below 10. A range between 10-30 was a compromise again between the target coverage and the dose homogeneity.
Fig. 2
Dependence of target coverage (A) and dose homogeneity (B) on the weight factor for maximum dose (MaxWeight) in the PTV. The horizontal line shows the planning aim and the double-headed arrow indicates the range of recommended values. V100 is the percentage of the PTV receiving the prescribed dose, DNR is the dose non-uniformity ratio. MinWeight is a weight factor controlling the target coverage through minimum dose at the periphery of the PTV
Normal tissue
The normal tissue surrounded the PTV and it was always obligatory to use objectives for it. Table 1 shows how the two input parameters (MaxValue, MaxWeight) affect the target coverage characterized by the V100. The shaded area included the coverage higher than 90%. At low weight factor (MaxWeight = 5), the V100 was always larger than 90% independently on the maximal dose value (MaxValue). If the allowed dose maximum was 120%, the weight factor did not influence the coverage, since the V100 was between 91.7% and 92.7%. The dose homogeneity also depended on MaxValue and MaxWeight of normal tissue (Table 2). In the shaded area, the DNR was less than 0.35. If the MaxValue was relatively low (≤ 60%) homogeneous dose distribution developed at any weight factor (DNR < 0.35). When using a low weight factor for maximum dose (MaxWeight = 5), the DNR was always low (0.30-0.31) and it did not depend on the maximum dose value. Summarizing the results shown in Tables 1 and 2, the MaxValue = 120 with MaxWeight = 5 as an objective for normal tissue seemed to be the right selection for input parameters in inverse planning.
Organs at risk
With proper normal tissue dosimetry, the dose to OARs can be kept low. If an OAR was not used directly during dose optimization, it would be a part of normal tissue and the dose objectives to normal tissue would implicitly apply to that as well. For example, if the target is superficially located and the PTV touches the skin defined as a 5 mm layer from body surface, the dose objective set up for normal tissue will govern the skin dosimetry. This is demonstrated in Table 3, since the coverage was nearly identical at all weight factors and change of the DNR was also very small. When the maximum dose to skin was in-creased from 40% to 120% at maximum weight factor (MaxWeigh = 100), the coverage improved slightly and the homogeneity marginally deteriorated, but the change of V100 and DNR was less than 1% (Table 4). In this analysis, we used MaxValue = 120 and MaxWeight = 5 for normal tissue.
Dwell time gradient restriction (DTGR)
Table 5 shows the effects of DTGR on target coverage and dose homogeneity. When no constraint was used for neighboring dwell times (DTGR = 0.0), the DNR was the lowest (0.341) and the V100 the highest (93.7). From the data, it can be observed that in the function of DTGR, the variation of both parameters was small, less than 1% for the V100 and less than 5% for the DNR.
Patient dosimetry
The mean volume of lumpectomy cavity and PTV was 10.7 cm3 (range, 3.5-37.0 cm3) and 56.7 cm3 (range, 26.6-173.6 cm3), respectively. Twenty-seven patients (64%) had left-sided and fifteen (36%) right-sided lesion. In seven cases (17%), the PTV was close to and in eight cases (19%) far from the skin. Median 13 catheters were implanted into the breast, with a range between 7 and 28. Table 6 includes dosimetric parameters for treatment plans made by forward (GO + GRO) and inverse (HIPO) planning for forty-two patients. The basis of comparison was the same target coverage. Both, the mean V100 and D90 were nearly identical for the two groups. But the conformality and the homogeneity was also better with the inverse planning. The mean COIN increased from 0.69 to 0.75 (p < 0.0001) and the DNR decreased from 0.39 to 0.35 (p < 0.0027). The volume irradiated by the PD was significantly smaller in the inverse plans (63.6 cm3 vs. 67.5 cm3, p < 0.0001). The non-target breast (ipsilateral breast excluding the PTV) received significantly less dose in the HIPO plans, and the same applied for the ipsilateral lung. The mean lung dose (MLD) was 8% less in HIPO and in the other three parameters (D0.1cm3, D1cm3, V5), there was a 5% decrease as well. Although, the doses to the most exposed 0.1 cm3 and 1 cm3 of skin were less with inverse planning, the difference was not significant. But the absolute volume irradiated by low-dose (5%) was 5.8 cm3 less with HIPO (p < 0.0001). Regarding the dose to ribs, the HIPO was superior with significant less doses (D0.1cm3, D1cm3), and the volume irradiated by half of the PD (V50) was also less compared to forward planning (1.7% vs. 1.8%, p = 0.0247). We noted that the reference isodose line never reached the ribs in any HIPO plan meaning that the maximum dose was always less than the PD, and in forward plans, we observed only one case out of forty-two patients where volume of 0.1 cm3 received the PD. Twenty-seven patients had left-sided cancer, and looking at the heart dosimetry, the superiority of inverse over forward planning could be seen. The mean heart dose was 8% less, and in HIPO plans, we observed not only lower doses to most exposed small volumes (0.1 cm3, 1 cm3), but also smaller volumes irradiated by low-dose (5%). The amount of decrease in heart parameters ranged between 8-12%, with always statistical significance. The dose to contralateral breast and lung was always small, with no significant differences between the two planning techniques.
Table 6
Comparison of patient dosimetry between treatment plans made by forward (GO + GRO) and inverse (HIPO) optimization techniques for 42 patients with mean ± standard deviation
Discussion
Inverse planning has been intensively used in external beam radiotherapy at least for a decade to optimize the dose distribution for state-of-the-art dose delivery techniques, such as intensity modulated radiation therapy and volume modulated arc therapy. However, in brachytherapy, it is still not routinely used for various treatment sites, except for the prostate. In clinical practice in both LDR and HDR prostate BT, optimal positions of radioactive sources are determined with inverse planning for no less than two decades, considering surface and volumetric dose constraints in addition to dose limits to urethra and rectum [6,21,25,26,27,28,29,30,31]. The role of inverse planning in gynecological BT is also studied in the literature. Trnková et al. [7] analyzed the feasibility of inverse planning algorithm (HIPO) for image-guided cervical cancer brachytherapy. Ten patients treated with intracavitary and another ten with combined intracavitary/interstitial techniques were planned with manual and inverse optimization. They found that HIPO was feasible for improving the therapeutic ratio and limiting the substantial high-dose regions around the needles; therefore, it was introduced into their clinical practice. The same group made a comparison between manual and inverse plans in HDR intracavitary/interstitial cervical cancer brachytherapy using data of 20 patients [8]. They found that HIPO produced clinically acceptable treatment plans and enabled the reduction of high-dose regions in the immediate vicinity of the target volume. Compared to IPSA, HIPO considered the current clinical experience gained from manual treatment planning. Other authors also found inverse planning feasible for cervical cancer BT [9,10,11,12,31]. Inverse planning can offer good sparing of critical structures without compromising the target coverage [9]. Moreover, IPSA significantly reduces overall treatment planning time with improved reduction of doses to the OARs, as compared with a volume-based optimization treatment planning method [12]. Matias et al. [11] provided a fine class solution of HIPO, demonstrating comparable results in relation to graphical optimization regarding both dosimetric and radiobiological endpoints. Kannan et al. [10] found that IPSA significantly improved the target volume coverage compared with manual planning. Inverse planning in vaginal BT performed with multichannel applicator was also studied, and its dosimetric advantages were demonstrated using planning data in two studies with twelve patients in both investigations [14,15]. For other sites, information about inverse planning in BT is sparsely available. In a case study with two patients, Jameson et al. [16] presented the usefulness of IPSA for head and neck BT, and Choi et al. [17] compared two inverse algorithms (IPSA, HIPO) in interstitial tongue HDR-BT of 20 patients. Regarding breast cancer, two inverse planning algorithms (IPSA, HIPO) were compared for 20 patients treated with BT boost using rigid needles [32]. With IPSA algorithm, the dose to OARs was less, but the target coverage and conformality was better with HIPO. In a recent paper, simulated annealing optimization was demonstrated for permanent breast implant treatment planning [33]. Treatment plans produced manually and with inverse planning of a 10-patient cohort were dosimetrically compared. Although in target coverage and dose to skin, no difference was found, a statistical difference was observed in reduction of volume irradiated by the 1.5 times the PD and in increase of conformity index in favor of inverse planning.
To the best of our knowledge, in interstitial HDR breast BT, detailed investigation of the input parameters of inverse optimization algorithms on dosimetry has not been performed. In our study, using HIPO, we firstly analyzed the effect of weight factors on target dose parameters accountable for target coverage (MinWeight), and dose homogeneity (MaxWeight) on quality of dose distributions in a breast implant. We clearly showed that these two factors played against each other. In order to find an acceptable compromise between the coverage and the homogeneity, we changed those weight factors step-by-step and subsequently determined a recommended range of their values. Dosimetric constraints for normal tissues surrounding the PTV had an influence on both the coverage and the homogeneity. To investigate this phenomenon, we changed the maximum dose (MaxValue between 20-120%) and its weight (MaxWeight between 5-100) to normal tissue and calculated the V100 and the DNR. According to data in Table 1, the weight factor has a role only when the prescribed maximum dose in normal tissue is low (≤ 100%). If the MaxValue is 120, the V100 is always larger than 90%, independently on the weight factor. At low maximum doses (MaxValue ≤ 60%), the dose distribution is always homogeneous with low DNR, and the weight factor does not have a big effect (Table 2). But, at low weight factor (MaxWeight = 5), the DNR is practically the same (0.30-0.31) at any maximum dose value.
The skin is considered as one of the most important OARs in breast BT. Similarly, to normal tissue, a maximum dose and its weight factor are the input parameters for skin dosimetry in inverse planning. Logically, with these two parameters, the dose to skin can be simply controlled. But, at the same time, the target coverage and the dose homogeneity are changing as well. If the skin is far from the PTV, there is no reason to use dose constraints, since it always receives relatively low dose. However, when the PTV is in close proximity to the skin, dose objectives in order to decrease the maximum dose can be applied. It is evident that the smaller the distance between the skin and PTV, the higher the maximum dose to skin. We investigated the role of input parameters of optimization for skin when the PTV is in contact with skin. Tables 3 and 4 demonstrate how the V100 and DNR are affected by the values of MaxWeight and MaxValue. Summarizing the results obtained with optimization of dose to skin, we can state that, basically, there is no effect of dose objectives for skin on the target coverage and the dose homogeneity. The explanation can be that the optimization objectives for normal tissue are strong enough to control the dose distribution outside the PTV. In fact, if it is not outlined separately, the skin is a part of normal tissue and if similar dose constraints are used as for the normal tissue, their effects will be minimal. Considering that the positions of the ribs related to the PTV can be very similar to the skin (far from or close to it), the conclusions drawn for skin dosimetry are valid for the ribs as well. We recommend using optimization parameters for any OAR only in a special case, when the maximum dose has to be kept below a certain level. Nevertheless, it must not be forgotten that dose to any OAR cannot be reduced unless the dose delivered to the PTV is decreased.
The classical dosimetry systems are based on LDR sources. With the stepping source technique, those systems can be simulated using uniform source dwell times [2,3,34]. However, after any optimization technique, the dwell times will be non-uniform, occasionally with large fluctuation. The dwell time gradient restriction in HDR stepping source dosimetry was introduced to avoid large dwell time differences in adjacent source dwell positions [35]. The role of controlling neighboring dwell times in quality of treatment plan is controversial. In a recent study, a negative correlation was found between modulation restriction, and both HR-CTV D90 and V100 in cervix BT as well as an increasing restriction, negatively affected the conformity index [36]. According to the results of Mavroidis et al. [37], dwell time regularization technique in HIPO introduced a minor improvement in the effectiveness of the optimized prostate HDR dose distributions. Balvert et al. [38] also investigated the role of dwell time modulation restrictions for HDR prostate BT and found that the use of restriction did not necessarily improve the treatment plan quality. In another study, an increase of dwell time deviation constraint yielded a few percent decrease in target coverage and a slight increase in V150 in HDR prostate implants using IPSA [39]. The latter is in agreement with our results shown in Table 5. The most homogeneous dose distribution develops when no restriction is used for the gradient, and the DNR is continuously increasing with stronger restriction. However, the difference between the extreme DNR values is only 5%, while the value of V100 practically does not change.
Although our detailed investigation about the role of input parameters on plan quality in inverse planning was performed only in one selected case, the results were validated in a relatively large patient cohort of forty-two cases. Our data showed that inverse planning performs better than forward planning regarding dosimetric parameters of target and OARs. In interstitial breast implants, a large number of dwell positions are in the target volume, which probably contributes to the efficacy of optimization algorithm. In other treatment sites such as cervix or head and neck, much less dwell positions are used, and the advantages of inverse planning may not be so evident. Though quantitative data about planning time was not given here, we noted that inverse planning requires considerably less amount of time than forward planning. This is another point for implementing inverse planning in clinical practice.
Conclusions
Prerequisite for effective use of inverse planning algorithm in interstitial breast BT is the determination of proper input parameters for optimization. Having found those presets, the optimization procedure is fast and practically always resulting in more superior dose distribution, when compared with forward planning. This statement was verified by comparing the data of patients’ dosimetry obtained by the two optimization methods. Our results clearly show that inverse planning is superior to forward planning, since at the same target coverage, all dosimetric parameters for any OAR, except only for contralateral lung, were more favorable with inverse planning, and in most cases, the differences were statistical significant. Furthermore, more homogeneous and more conformal dose distributions developed after inverse planning. Based on our results, the introduction of inverse planning into routine clinical practice is recommended in interstitial HDR breast brachytherapy.


