
Purpose
Cervical cancer is a major cancer burden and public health concern in developing countries, such as India. India alone accounts for one-quarter of the worldwide burden of cervical cancers [1, 2]. The standard treatment modality and integral part of local control for cervical cancer is external beam radiotherapy (EBRT), followed by brachytherapy.
GEC ESTRO (the Groupe Européen de Curietherapie and the European Society for Radiotherapy and Oncology) has introduced a novel target concept to facilitate image-guided brachytherapy (IGBT) [3, 4]. This study was performed to report our institution’s experience with image-guided high-dose-rate (HDR) brachytherapy in the framework of the current guidelines of the American Brachytherapy Society (ABS) and in light of the recent EMBRACE collaborative results supporting more rigorous dose recommendations [5].
The modern treatment planning system (TPS) provides conformal dose distribution to the target and minimum possible dose to the surrounding normal tissues, with the help of remote control computerized HDR brachytherapy devices. The goal of HDR planning is to produce an acceptable optimized plan that meets the desired dose constraints. These devices have a high activity miniature stepping source, which offers advantages of varying source positions and time to obtain an appropriate dose distribution and isodose geometry. Improved planning strategies and optimization techniques can reduce normal tissue complications without compromising local control of the disease.
The purpose of the study was to consider and calculate the dosimetric parameters during treatment planning to improve radiobiological outcomes for cervical cancer patients treated with HDR intracavitary brachytherapy (ICBT). Outcomes of the study were clinically correlated with follow-up period of 12 months for all the patients. Scarce and heterogeneous information is available in the literature on correlation between dosimetric quality indices (QIs) [coverage index (CI), dose homogeneity index (DHI), overdose volume index (ODI), and dose non-uniformity ratio (DNR)], which were included in the present study and clinical outcomes of ICBT.
Material and methods
Patients and treatment
This study was performed with 30 patients treated for cervical cancer at the Department of Radiation Oncology, Guru Gobind Singh Medical College and Hospital, Faridkot, Punjab, India, and also approved by the research degree committee of the institute (Baba Farid University of Health Sciences, Faridkot, Punjab, India), with reference number of BFUHS/Ex/PHD/E15/725.
The staging of the disease was done according to the International Federation of Gynecology and Obstetrics (FIGO) staging system. Patients with stage IIB and IIIB were included, and patients with lymph node involvement were excluded from the study. All patients were treated with EBRT of 46 Gy in 23 fractions, followed by ICBT. ICBT was applied with remote afterloading MicroSelectron HDR v.3 (Elekta Medical Pvt. Ltd. System) machine, with iridium-192 radioactive source. The time between completion of EBRT and the first ICBT ranged from 5 to 7 days. The ICBT dose of 22.5 Gy in 3 fractions (7.5 Gy per fraction) was given to all patients. All doses were normalized to a total biological equivalent dose (BED) at 2 Gy per fraction (EQD2) using a linear quadratic (LQ) model, with α/β = 10 Gy for target and α/β = 3 Gy for organs at risk (OARs). Total EQD210 for EBRT and ICBT was obtained by summation of prescribed EBRT dose (EQD210) and fractional ICBT doses (EQD210) [6]. Dose constraints for OARs were specified in terms of dose to 2cc (D2cc) as recommended in the EMBRACE-II study [7]. Follow-up was performed up to a period of 12 months after the completion of ICBT, according to the institutional guidelines.
A computer tomography (CT)-compatible Fletcher suit applicator was used for ICBT application, which consists of uterine tandem with various angles (15o, 30o, and 45o), and a pair of ovoids with different diameters (25 mm, 30 mm, and 35 mm). Appropriate vaginal packing was done to fix the applicator’s position and to displace the bladder and rectum away from the applicator. To minimize patient’s movement during CT scan, every attempt was made to complete the entire process within the shortest time possible.
Treatment planning
Three dimensional (3D) images were acquired using a CT Simulator (GE 580W OPTIMA) machine, with a 2.5 mm slice thickness for ICBT procedure for all patients. All CT slices were transferred to the Oncentra Master Plan, version 4.3 TPS (Elekta Medical Pvt. Ltd. System). Target volume and OARs on each CT slice were contoured. Accurate delineation of high-risk clinical target volume (HR-CTV) requires documentation of gynecological examination at diagnosis and at ICBT. Due to lack of magnetic resonance imaging (MRI) modality and MRI-compatible applicators in the institute, CT-based planning was performed, in which HR-CTV was the main target volume instead of gross tumor volume (GTV); therefore, it was assumed that there was no gross tumor present at the time of brachytherapy. For target delineation, HR-CTV was contoured, including the whole cervix and presumed extra cervical tumor expansion area (if present) upon brachytherapy [8]. The presumed tumor extension was defined by means of clinical examination (visualization and palpation), along with CT findings. Safety margin was chosen according to the tumor size, tumor spread direction, tumor regression, and treatment strategy. The rectum, bladder, sigmoid, and bowel were delineated on each CT slice for the present study. 3D treatment plans were created in TPS. Dose prescription point was Manchester point A in each plan.
Dosimetric parameters
Dose volume histograms (DVH) was utilized for analyzing the plan dosimetrically. For dosimetric analysis, different QIs were calculated in each ICBT plan. All the plans were divided into different regions based on the pattern of dose distribution, to define different QIs. In each treatment plan, the isodose surface of 100%, 150%, and 200% of target volume was generated to find out the respective dose coverage volumes. The QIs analyzed in the present study were defined as:
Coverage index (CI): This was the fraction of the target volume that received a dose equal to or greater than the reference dose [9].
Relative dose homogeneity index (DHI): It was defined as the ratio of the target volume, which received a dose in the range of 1.0 to 1.5 times of the reference dose to the volume of the target that received a dose equal to or greater than the reference dose [9].
Overdose volume index (ODI): This was the ratio of the target volume, which received a dose equal to or more than 2 times of the reference dose to the volume of the target that received a dose equal to or greater than the reference dose [9].
Dose non-uniformity ratio (DNR): This was the ratio of the target volume, which received a dose equal to or greater than 1.5 times of the reference dose to the volume of the target that received a dose equal to or greater than the reference dose [10].
Radiobiological parameters
Radiobiological parameters were calculated using the following dosimetric parameters in this study.
Tumor control probability (TCP): In the case of brachytherapy, it was not possible to obtain a uniform dose distribution as very high radiation dose gradient in the vicinity of the radiation source. Hence, to calculate TCP, the target volume was divided into four different regions based on the pattern of dose distribution.
According to LQ model, TCP for uniform dose distribution within the target volume was given by the following formula [11]:
where ρ, V, α, and BEDt are the clonogenic cell density, target volume, coefficient of lethal damage (radio-sensitivity of lethal damage), and BED (biologically effective dose) for the target, respectively.
The BED in HDR-ICBT for a total dose of D (Gy) delivered with dose d (Gy) per fraction is given by Visser et al. [12]:
where α/β is the tissue specific parameter and is used as the coefficient in LQ formalism; G is the factor accounting for incomplete repair of sub-lethal damage during the inter-fraction interval between the fractions.
In this study, it was assumed that the time interval between the fractions was sufficient to allow the full repair of sub-lethal damage, therefore G was considered as 1. The values of ρ and α were assumed to be constant throughout the target volume (ρ = 107 cells/cc, and α = 0.35 Gy-1) in the present study, which was also assumed in previous studies in the literature [13, 20]. The assumption of constant ρ throughout HR-CTV could not be expressed due to lack of MRI-based planning. No gross tumor and lymph nodes were present at the time of brachytherapy. Also the influence of cell proliferation rate was assumed to be negligible. The value of α/β ratio was considered as 10 Gy for the target.
Dose distribution in the case of HDR-ICBT within the target was highly non-uniform, so equation (5) could not be applied directly to compute TCP. Hence, the target volume was divided into four regions as described below and shown in Figure 1:
Region receiving a dose less than the reference dose.
Region receiving a dose in the range of 1.0 to 1.5 times of the reference dose.
Region receiving a dose in the range of 1.5 to 2.0 times of the reference dose.
Region receiving a dose equal to or more than 2.0 times of the reference dose.
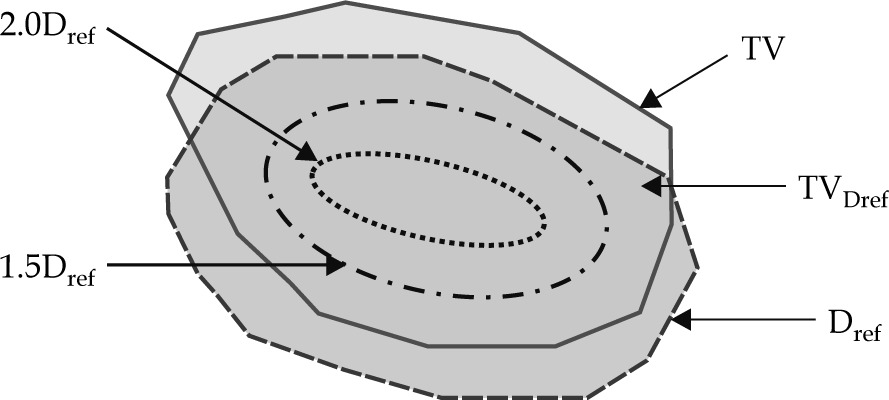
Each region had its’ own BED, but in the present study, BED was replaced by BEEUD (biologically effective equivalent uniform dose) as per the concept provided by Kehwar et al. [22]:
BEEUD and QIs were introduced into the equation of TCP, which is provided by equation (8).
All dosimetric QIs were used to calculate TCP, and the correlation between these QIs and TCP was observed in the present study.
Normal tissue complication probabilities (NTCP): NTCP of the bladder and rectum was calculated in this study using Niemierko model. In this model, raw data from TPS were converted into a biological equivalent uniform dose, i.e., EQD2 DVH (EBRT + ICBT). Then, this DVH was converted into DVH of the whole volume of organ (Vi) receiving EUD (equivalent uniform dose), using the DVH reduction method as proposed by Kutcher et al. [14]:
where EQD2i = EQD2 (EBRT) + EQD2 (ICBT), ‘a’ is a parameter describing the response of the structure or organ in relation to the irradiated volume, a < 0 for tumors where cold spots are unwanted, and a > 0 for healthy tissue where hotspots are undesirable.
NTCP is determined using the following logistic function:
where γ50 is the slope of sigmoid dose response curve of normal tissue at 50% complication probability.
Parameters used for OARs according to Niemierko model [15] are shown in Table 1.
Follow-up
All the patients underwent follow-up evaluations up to 12 months, according to our departmental protocol. The patients were followed-up with routine investigations, including complete blood counts, chest X-ray, CT, etc. OARs complications were recorded.
Statistical analysis
All parameters of the target and OARs were statistically examined using statistical package for social sciences (IBM SPSS Statistics for Windows, version 26.0; IBM Corp., Armonk, NY, USA). The results were calculated as mean ± standard deviation (SD). The least square fitting was used and the slope of the curve was noted. The value of the Pearson’s product moment correlation coefficient (r-value) was also calculated. The relationship between two variables was generally considered strong and statistically significant, when their r-value was greater than 0.7. The 2D scatter plot representing the correlation was generated.
Results
The median and range of HR-CTV volume at the time of ICBT were 34 cm2 and 15-62 cm3, respectively. The total EQD210 (EBRT + ICBT) at point A was 80 Gy on average, and was 83 Gy for D90 HR-CTV when prescription was done at point A. For OARs, the total EQD23 (EBRT + ICBT) on average were 71 Gy, 73 Gy, 76 Gy, and 73 Gy for D2cc of the bladder, rectum, bowel, and sigmoid, respectively.
Dosimetric analysis
The maximum, minimum, mean, and SD were calculated for all the dosimetric parameters and are presented in Table 2.
Radiobiological analysis
As shown in Table 3, maximum, minimum, mean, and SD were calculated for all the radiobiological parameters, including TCP for target and NTCP for the bladder and rectum.
Table 3
Radiobiological parameter data for intracavitary brachytherapy (ICBT)
| QI | Maximum value | Minimum value | Mean ±SD |
|---|---|---|---|
| TCP | 0.99 | 0.73 | 0.92 ±0.07 |
| NTCP_B | 0.94 | 0.00 | 0.08 ±0.25 |
| NTCP_R | 0.94 | 0.04 | 0.36 ±0.27 |
The 2D scatter curves were plotted between all QIs and TCP. The r-values (confidence interval: 95%) between CI, DHI, ODI, and DNR with respect to TCP are shown in Table 4.
Table 4
The r-values between quality indices (QIs) and tumor control probability (TCP)
| Variable parameters | Pearson’s product moment correlation coefficient |
|---|---|
| CI and TCP | +0.85 |
| DHI and TCP | –0.85 |
| ODI and TCP | +0.84 |
| DNR and TCP | +0.85 |
The relationship between CI and TCP is presented in Figure 2, and indicates that TCP increases in a linear trend as CI increases. The slope of the linear line was 0.94. The r-value between CI and TCP was +0.85, which was statistically significant (confidence interval: 95%). This r-value shows a strong positive relationship between CI and TCP.
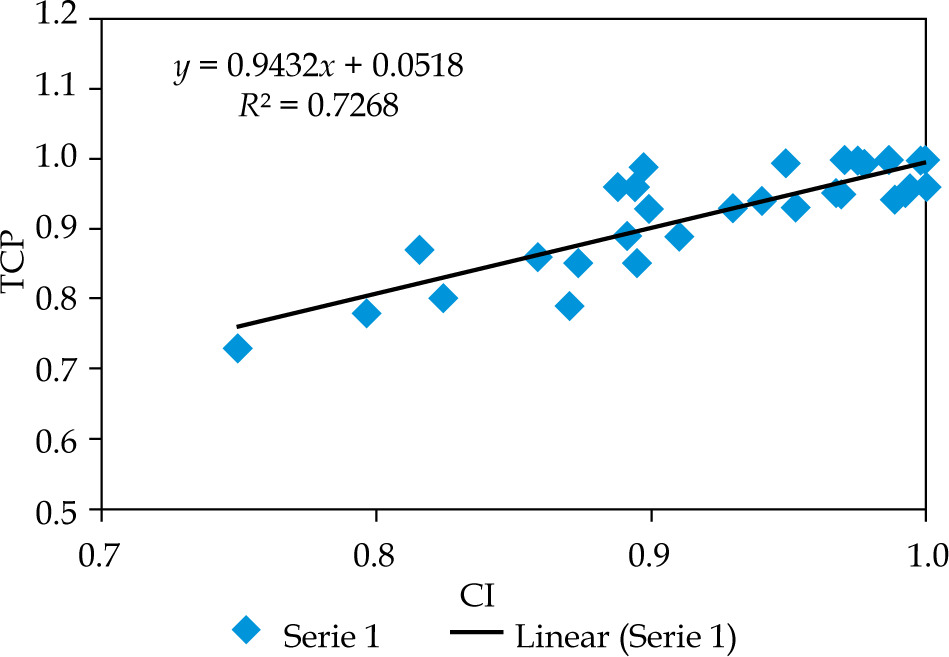
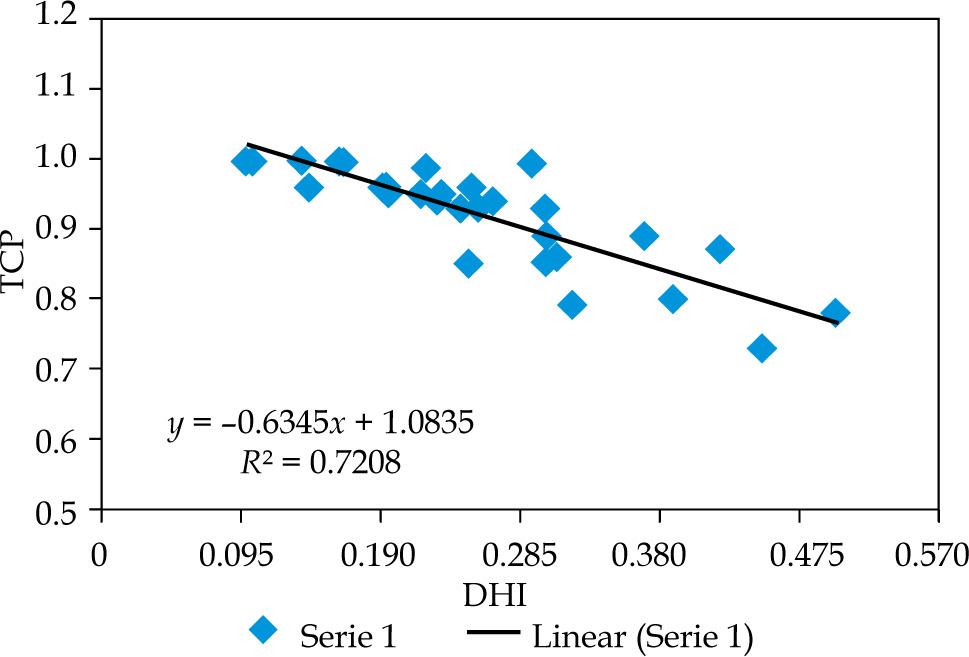
Figure 3 shows the relation between TCP and DHI. The curve indicates that TCP decreases linearly with DHI. The slope of the curve was –0.63, which shows the inverse correlation between TCP and DHI. The r-value between DHI and TCP was –0.85, which was statistically significant, and showing negative relationship between DHI and TCP (confidence interval: 95%).
Fig. 3
2D scatter graph correlating between dose homogeneity index (DHI) and tumor control probability (TCP)
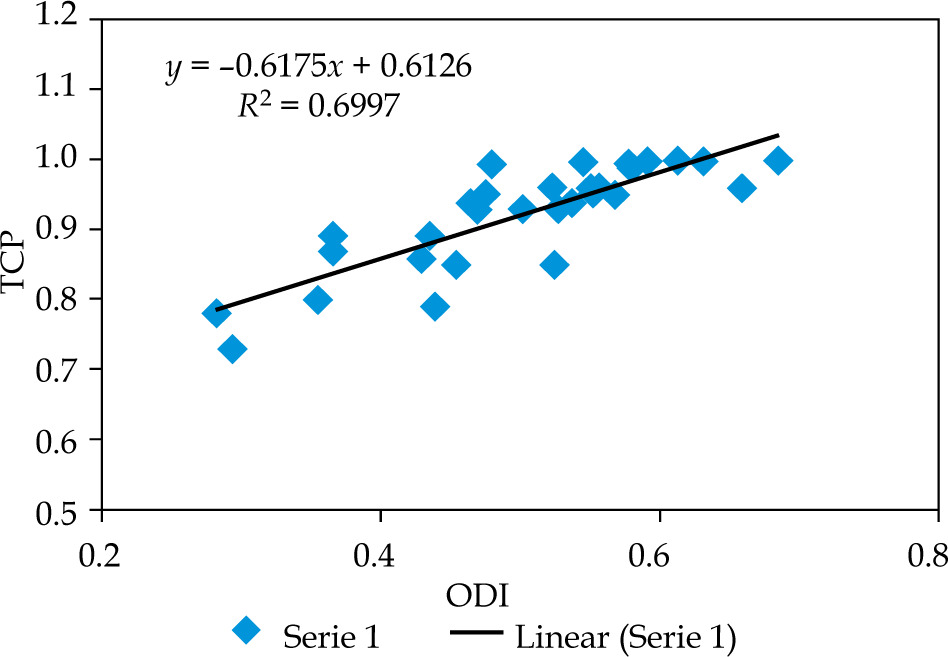
It is clear from Figure 4 that TCP also increases with an increase in ODI. The slope of the curve was 0.62. The r-value between ODI and TCP was +0.84, which was statistically significant (confidence interval: 95%). This r-value showed a strong positive relationship between ODI and TCP.
Fig. 4
2D scatter graph correlating between overdose volume index (ODI) and tumor control probability (TCP)
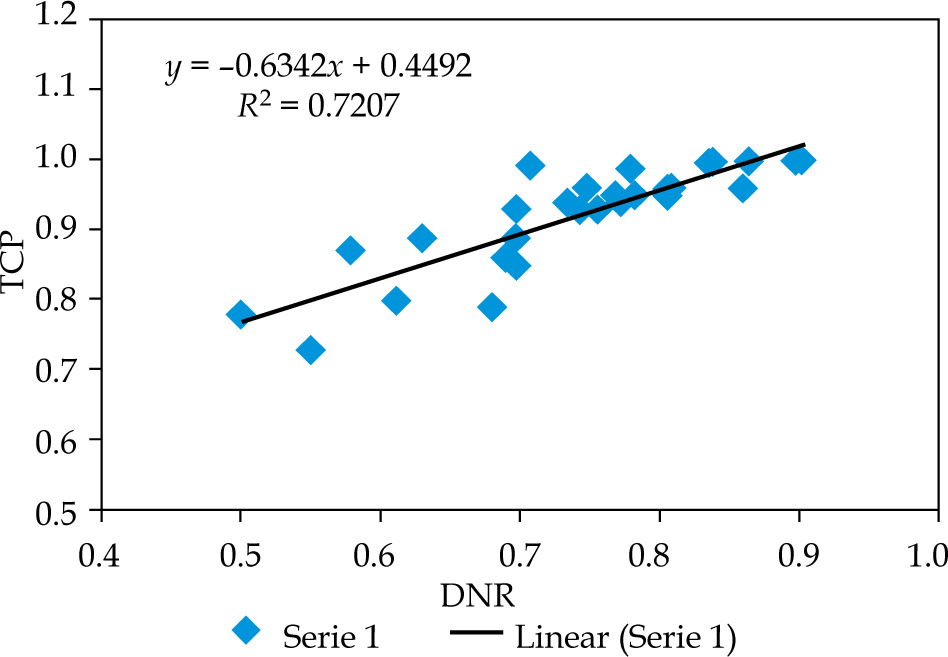
The curve between TCP and DNR is demonstrated in Figure 5. It was observed that TCP increases linearly with increase in DNR. The slope of the curve was 0.63. The r-value between DNR and TCP was +0.85, which was statistically significant (confidence interval: 95%). This r-value showed a strong relationship between DNR and TCP.
Clinical analysis
Toxicity assessment was evaluated using the Radiation Therapy Oncology Group (RTOG) toxicity assessment scales [16, 17]. There were no recurrences found in all the patients up to 12 months of follow-up. Most of the observed toxicities were grade 1 or 2 in the bladder and rectum. Only two out of thirty patients suffered from radiation proctitis and one from radiation cystitis, but the symptoms did not become apparent until 12 months after the completion of brachytherapy. Supportive medical treatment was applied to the required patients for the management of proctitis and cystitis, including hydration, anti-diarrheal, anti-inflammatory drugs, etc.
Discussion
Various QIs have been proposed to evaluate LDR and HDR interstitial implants; for example, DHI and DNR proposed by Saw and Suntharalingam [18, 19] and Saw et al., respectively [10]. Meertens et al. defined QIs (CI, DHI, ODI, and DNR for target) for the evaluation of HDR interstitial implants [9]. In this study, we used the QI as defined by Meertens et al. Target volume TV was divided into 4 parts to define target related QIs. BEEUD was calculated for these 4 parts of TV and then incorporated into the expression of TCP. The correlation between TCP and QIs was observed.
It was noted that TCP increases with an increase in CI values. This is because the target volume coverage with the prescribed dose was almost full in all the planned cases, which leads to higher TCP. Surega et al. in their study observed no correlation between TCP and CI because of statistically insignificant regression coefficient [20]. Their results are not similar to the present study, which may be because of the institutional dissimilarity from target delineation to treatment plan execution.
DHI is a good indicator of the pattern of dose distribution in a target volume, but it is still unclear what factors are influencing this index. Theoretically, improvement in dose homogeneity and conformity should enhance local control and decrease complications, but there are no studies till date suggesting plans with a better DHI being associated with a better clinical outcome, as compared to such plans with inferior DHI [21]. In the present study, it was found that as DHI increases, TCP decreases. It can happen, as in case of brachytherapy, the dose distribution is highly heterogeneous. Kataria et al. in their study reported that DHI increases as prescribed dose increases, and decreases as target volume increases [21].
The present study showed that with an increase in ODI and DNR values, TCP increases, but simultaneously, complications to OARs also increases, which may be manageable. Over-dose region cannot be avoided completely in the case of brachytherapy. Kehwar et al. in their study confirmed that higher values of ODI and DNR were related to higher normal tissue complications, which are in correlation with the present study [22].
In the present study, on follow-up of 12 months, no recurrence was noted within all the patients. Only 2 patients suffered with acute radiation proctitis and 1 with radiation cystitis after the completion of ICBT. On analyzing with dose constraints of DVH, it was found that these patients had higher total EQD23 (EBRT + ICBT) for the rectum as compared with GEC-ESTRO recommendations [6]. Also, these patients had higher target volumes. Our observations were similar to Tanderup et al. study, where they reported that local control depends upon the volume of the target [23].
Conclusions
The correlation between dosimetric and radiobiological parameters was found statistically significant, and shows the influence of dosimetric parameters on the radiobiological outcomes. Therefore, these parameters should be considered during the treatment planning to improve the radiobiological outcomes. This observation can be beneficial for plan evaluation in busy departments, as calculation of TCP and NTCP is not routine work in clinical departments. The radiobiological analysis should be used only for relative comparison between competing plans rather than for assessment of the absolute risk of biological impact. Additionally, this study was performed with a small number of patients and a short follow-up time period, which are the limitations of the study; further follow-up is required. The potential dosimetric results of the present study demonstrated better local control with acceptable toxicities, which are easily manageable.


