
Purpose
Conventional radiotherapy for cervical cancer combines external beam radiotherapy (EBRT) with a boost of high-dose-rate (HDR) brachytherapy. The efficacy of a brachytherapy boost has been well recognized [1,2,3,4,5], contributing significantly to local tumor control, with higher doses accumulated within the central lesion while sparing surrounding normal tissues.
During the optimization process in intracavitary brachytherapy (ICBT) planning, once the afterloading catheters are positioned in site (i.e., the Fletcher applicator), the dose delivered can be controlled by changing the source positions within the catheters and dwell times. There is a large number of combinations of dwell positions, dwell times, and corresponding weights that lead to different target dose coverage and dose to organs at risk (OARs). The identification of the best combination is one of the challenges of the treatment planning process. Graphical optimization (GO) and inverse planning simulated annealing (IPSA) are widely available treatment planning optimization techniques used in patients undergoing HDR 3D brachytherapy treatment.
In GO, the isodose lines on the transverse, sagittal, and coronal computed tomography (CT) images are adjusted manually. Then, the dwell positions and weights of the radioactive sources along the catheters are calculated to achieve the new dose distribution. GO is quite a fast method, and it is able to improve the coverage of the target while decreasing hot spots. Moreover, the optimization is not based on the anatomy.
The inverse planning approach [6] can be defined as a method of brachytherapy treatment planning, where the clinical objectives and treatment parameters are set up and adjusted along the optimization process to achieve the desired dose distribution. CT or magnetic resonance imaging (MRI) images are used not only to define the anatomy for visual assessment and dose calculation, but also to optimize the dose distribution [7]. Therefore, they provide to a physician additional flexibility and control to shape the dose distribution. In inverse planning, the anatomical features along with the dose constraints, constitute the starting point of the dose optimization process. In IPSA optimization, we have to define dose objectives for the target and dose constraints for OARs not only at the surface, but also inside the regions. A cost function with an increasing penalty for those failing to satisfy the predefined objectives and constraints is used. Then, the cost function is continuously decreased through an iterative process with an automatic adjustment of the sources and dwell weights [8], until an optimal solution is found. The main benefit of the inverse planning approach is that all clinical requirements (e.g., dose coverage and normal tissue protection) are simultaneously and automatically taken into account in the planning process.
In brachytherapy, the application of IPSA started in prostate cancer [9,10,11] and then extended to gynecological cancer [12,13,14]. However, several studies [15,16,17] have shown that IPSA gives promising results in target coverage, OARs sparing, and planning time in cervical cancer brachytherapy, either different applicators or the absence of interstitial implants might lead to different dosimetric results. This is the case in our study, which aims to compare the Fletcher applicator-based cervical brachytherapy plans optimized with GO and IPSA in terms of target and OARs dose-volume histogram (DVH) and irradiation times, when no interstitial implants are used.
Material and methods
Twenty-one cervical cancer patients treated in our center were included in this retrospective study. Patient median age was 51 (range, 42-71), and they all presented with cervical squamous cell carcinoma with FIGO stages IIB (10 patients) and IIIB (11 patients). The patients were treated with EBRT with a prescription dose of 45 Gy in 25 fractions, and were subsequently scheduled with 5/6 fractions (6 Gy/fraction) for ICBT, based on MRI scans and gynecological examination; no interstitial needles were used due to patients’ positive responses after EBRT.
For ICBT, the patients were arranged in a supine position on a vacuum bag with a thermoplastic mask modeled on their bodies. CT images with a slice thickness of 3 mm were acquired with the Philips Brilliance Big Bore (Philips, Eindhoven, The Netherlands), from L5 to 2 cm below the vulva with a CT/MRI Fletcher applicator (Elekta AB, Stockholm, Sweden) in situ. In the same configuration, T2-weighted MRI images of 3 mm thickness were acquired on a 1.5T Archivia MRI scanner (Philips Medical Systems B.V., Eindhoven, The Netherlands) at the same day. CT and MRI data sets were imported into the Oncentra Brachy treatment planning system, version 4.3 (Elekta AB, Stockholm, Sweden) and manually registered. Following the international study on MRI-guided brachytherapy in locally advanced cervical cancer (EMBRACE study), the radiation oncologist identified and delineated the clinical target volume (CTV) as well as the OARs (bladder and rectum) on the MRI T2 images; then, they were copied to CT, based on the registration between CT and MRI images. No margins were added to the CTV and OARs, since the setup uncertainties and internal motions were minimal. The CTV prescribed dose was 6 Gy, whereas for the rectum and bladder, we strove to reach a dose as low as achievable. Considering that the OARs were exposed to the full EBRT dose of 45 Gy, physical dose constraints per fraction of 5.4 Gy for the bladder and 4.2 Gy for the rectum were calculated with the EQD2 model. An experienced medical physicist dedicated to brachytherapy treatment plans (department workload 30 to 35 treatments per day) optimized the ICBT plan, and GO technique was used as first. During GO optimization, the global-local cursor was set to the middle, and 2.5 mm spacing of dwell points of a microSelectron HDR 192Ir v2r source was applied. A second plan was then obtained using IPSA optimization, using the same parameters (i.e., contours, catheters, or location of dwell points), while setting the dwell time deviation constraint to 0.4. In Table 1, the objectives and constraints for the CTV and OARs used in the clinical practice of our center are shown. For the target dose coverage comparison, the volume receiving 100%, 150%, and 200% of prescription dose (V100,V150, and V200, respectively); the conformity index (CI) and the homogeneity index (HI) were evaluated. CI and HI were defined as:
Table 1
Dose objectives set for inverse planning simulated annealing (IPSA) optimization
| ROI | Usage | Margin | Surface | Volume | |||
|---|---|---|---|---|---|---|---|
| Weight | Min | Max | Weight | ||||
| CTV | Ref. target | – | 100 | 6.0 | – | – | – |
| Bladder | Organ | – | – | – | 4.0 | 80 | – |
| Rectum | Organ | – | – | – | 4.0 | 80 | – |
| Sigmoid | Organ | – | – | – | 4.0 | 80 | – |
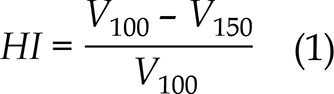

where VCTV,ref is the target volume covered by the prescription dose, VCTV is the target volume, and Vref is the total volume covered by the prescription dose. For the OARs, the maximum doses received by 1 and 2 cm3 (D1cc and D2cc, respectively) and the volume receiving 75% of the prescription dose (V75) for the bladder and rectum were extracted from the DVH and used for the comparison; α/β = 3 was used in the determination of EQD2 [18]. The paired t-test was performed using SPSS19.0 (SPSS Inc., Chicago, USA), and p < 0.05 was considered statistically significant.
Results
The DVH dosimetric results obtained for the CTV and OARs for both optimizations are reported in Table 2. The datasets of the 21 patients are shown as the mean ± standard deviation (x ±s); the mean volume of CTV is 35 (range, 23-60 cc).
Table 2
CTV and OARs DVH parameters of 21 patients, obtained with GO and IPSA optimizations techniques
| Parameter | GO | IPSA | t | p value | |
|---|---|---|---|---|---|
| CTV | V100 (%) | 87.46 ±3.97 | 86.81 ±4.52 | 0.640 | 0.529 |
| V150 (%) V200 (%) | 53.71 ±3.04 32.27 ±3.64 | 54.61 ±4.13 33.61 ±3.51 | 0.795 1.093 | 0.436 0.287 | |
| HI | 0.38 ±0.05 | 0.37 ±0.06 | 1.002 | 0.328 | |
| CI | 0.53 ±0.10 | 0.57 ±0.11 | 1.384 | 0.182 | |
| Bladder | D1cc (Gy) | 3.35 ±1.45 | 3.12 ±1.40 | 3.596 | 0.002* |
| D2cc (Gy) | 3.02 ±1.36 | 2.81 ±1.31 | 3.490 | 0.002* | |
| V75 (cc) | 1.04 ±1.46 | 1.56 ±3.05 | 0.824 | 0.420 | |
| Rectum | D1cc (Gy) | 3.38 ±0.90 | 3.02 ±0.94 | 3.682 | 0.002* |
| D2cc (Gy) | 2.98 ±0.84 | 2.61 ±0.86 | 3.751 | 0.002* | |
| V75 (cc) | 0.51 ±0.52 | 0.52 ±0.72 | 0.092 | 0.928 |
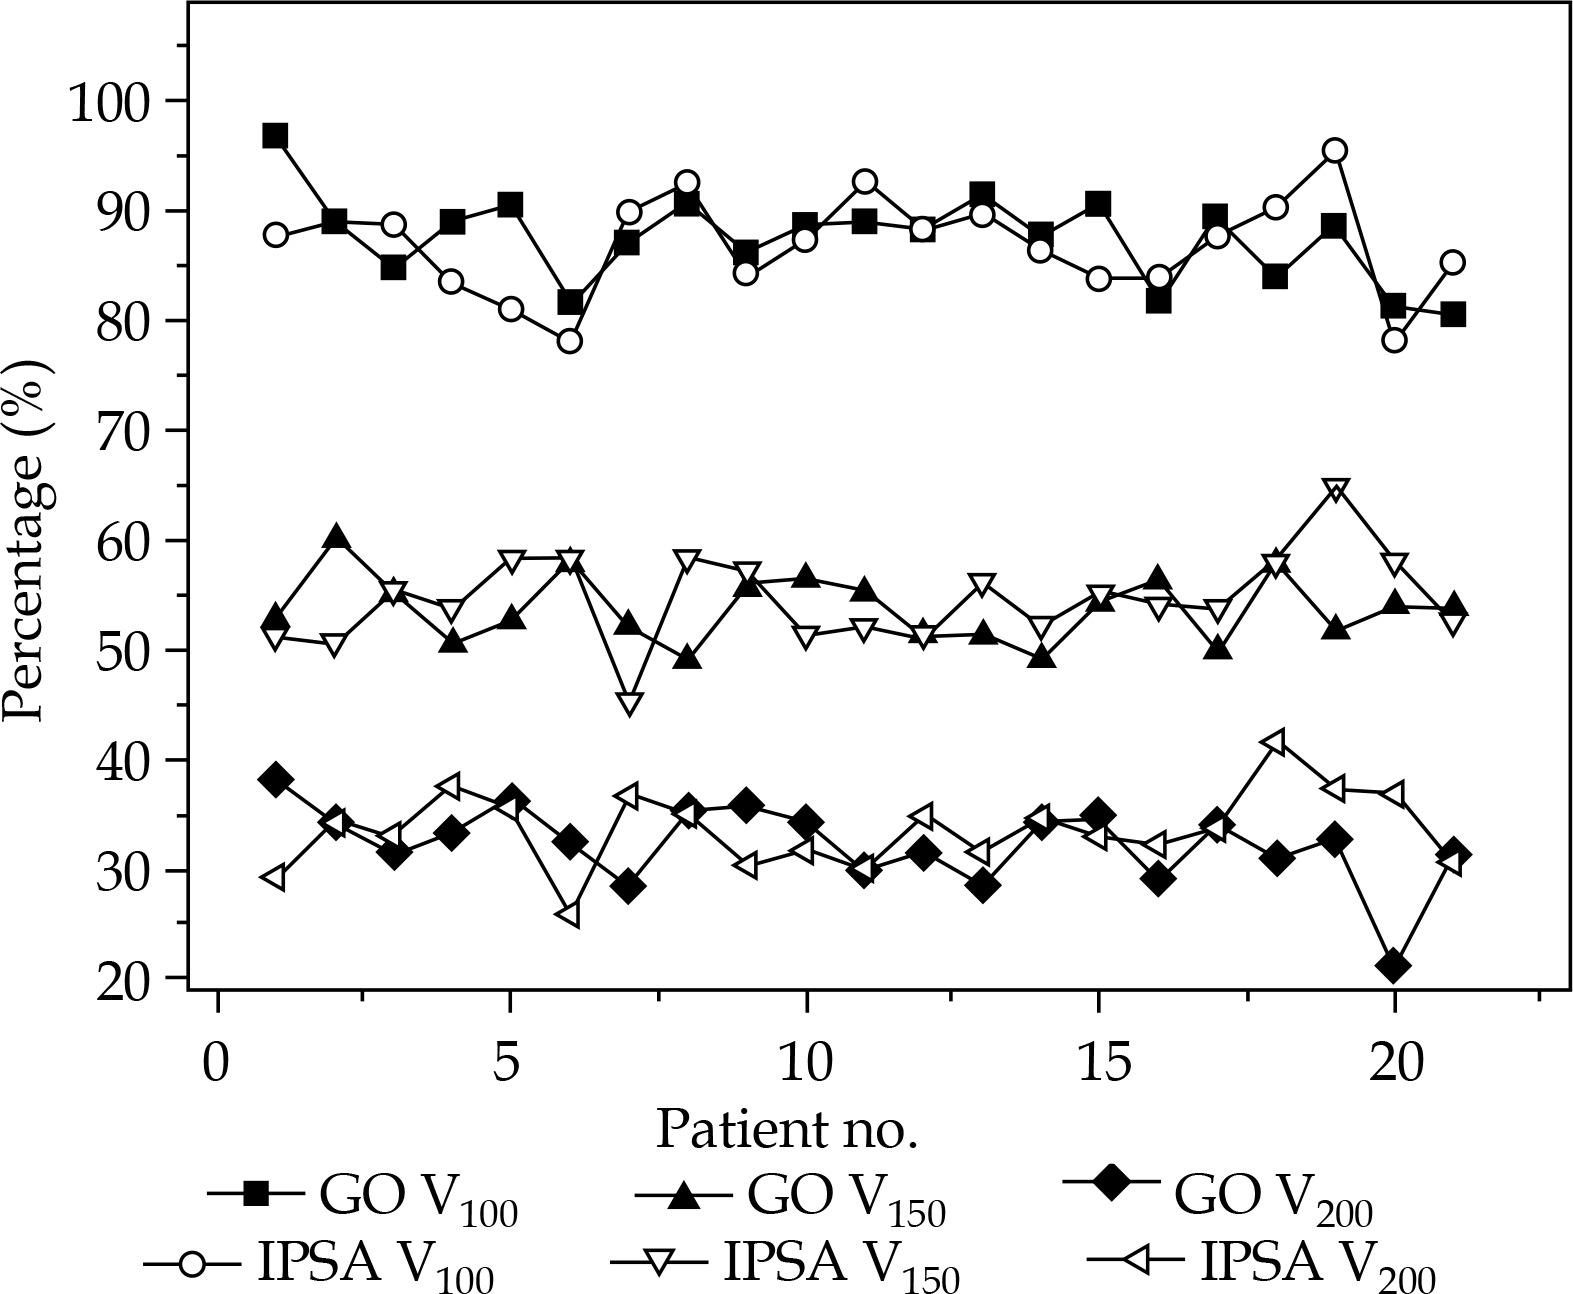
CTV V100, V150, and V200 for both optimization techniques gave similar mean values without a statistical difference (p > 0.05); the same behavior (p > 0.05) was registered for HI and CI. The comparison of CTV V100, V150, and V200 for each patient and optimization technique is shown in Figure 1.
Fig. 1
Clinical target volume (CTV) V100, V150, and V200 obtained with graphical optimization (GO) and inverse planning simulated annealing (IPSA) optimization techniques
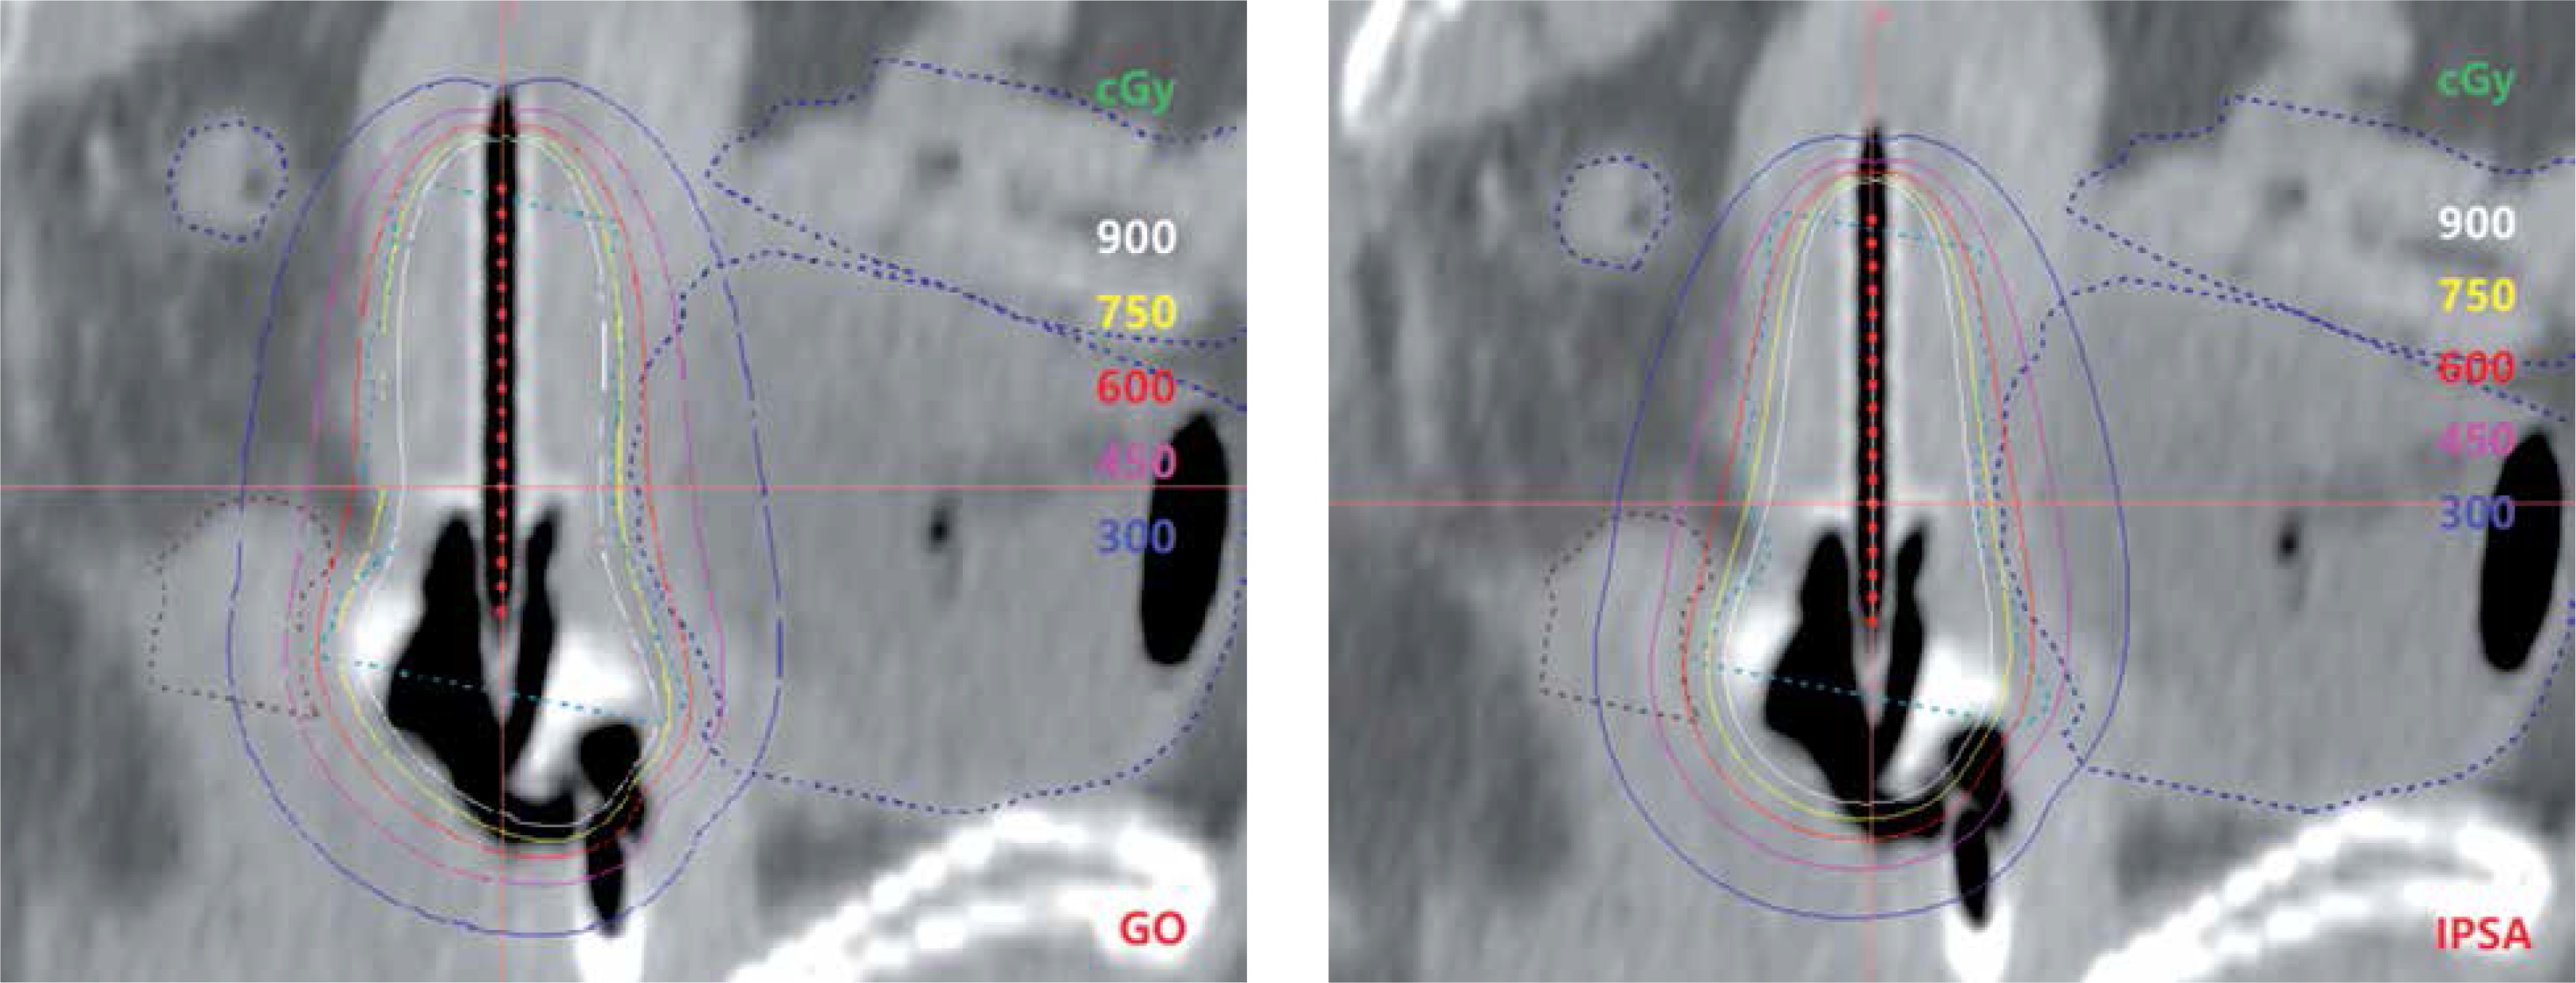
When considering the OARs, no statistical difference was observed for the bladder and rectum V75 for both optimizations, whereas IPSA plans registered the bladder and rectum D1cc and D2cc values significantly lower than those obtained with GO (p = 0.002), appearing to have a better ability to control high doses. Figure 2 shows the isodose distribution on sagittal view of both IPSA and GO plans.
Fig. 2
Isodose distribution on the sagittal view of plans optimized with graphical optimization (GO) and inverse planning simulated annealing (IPSA)
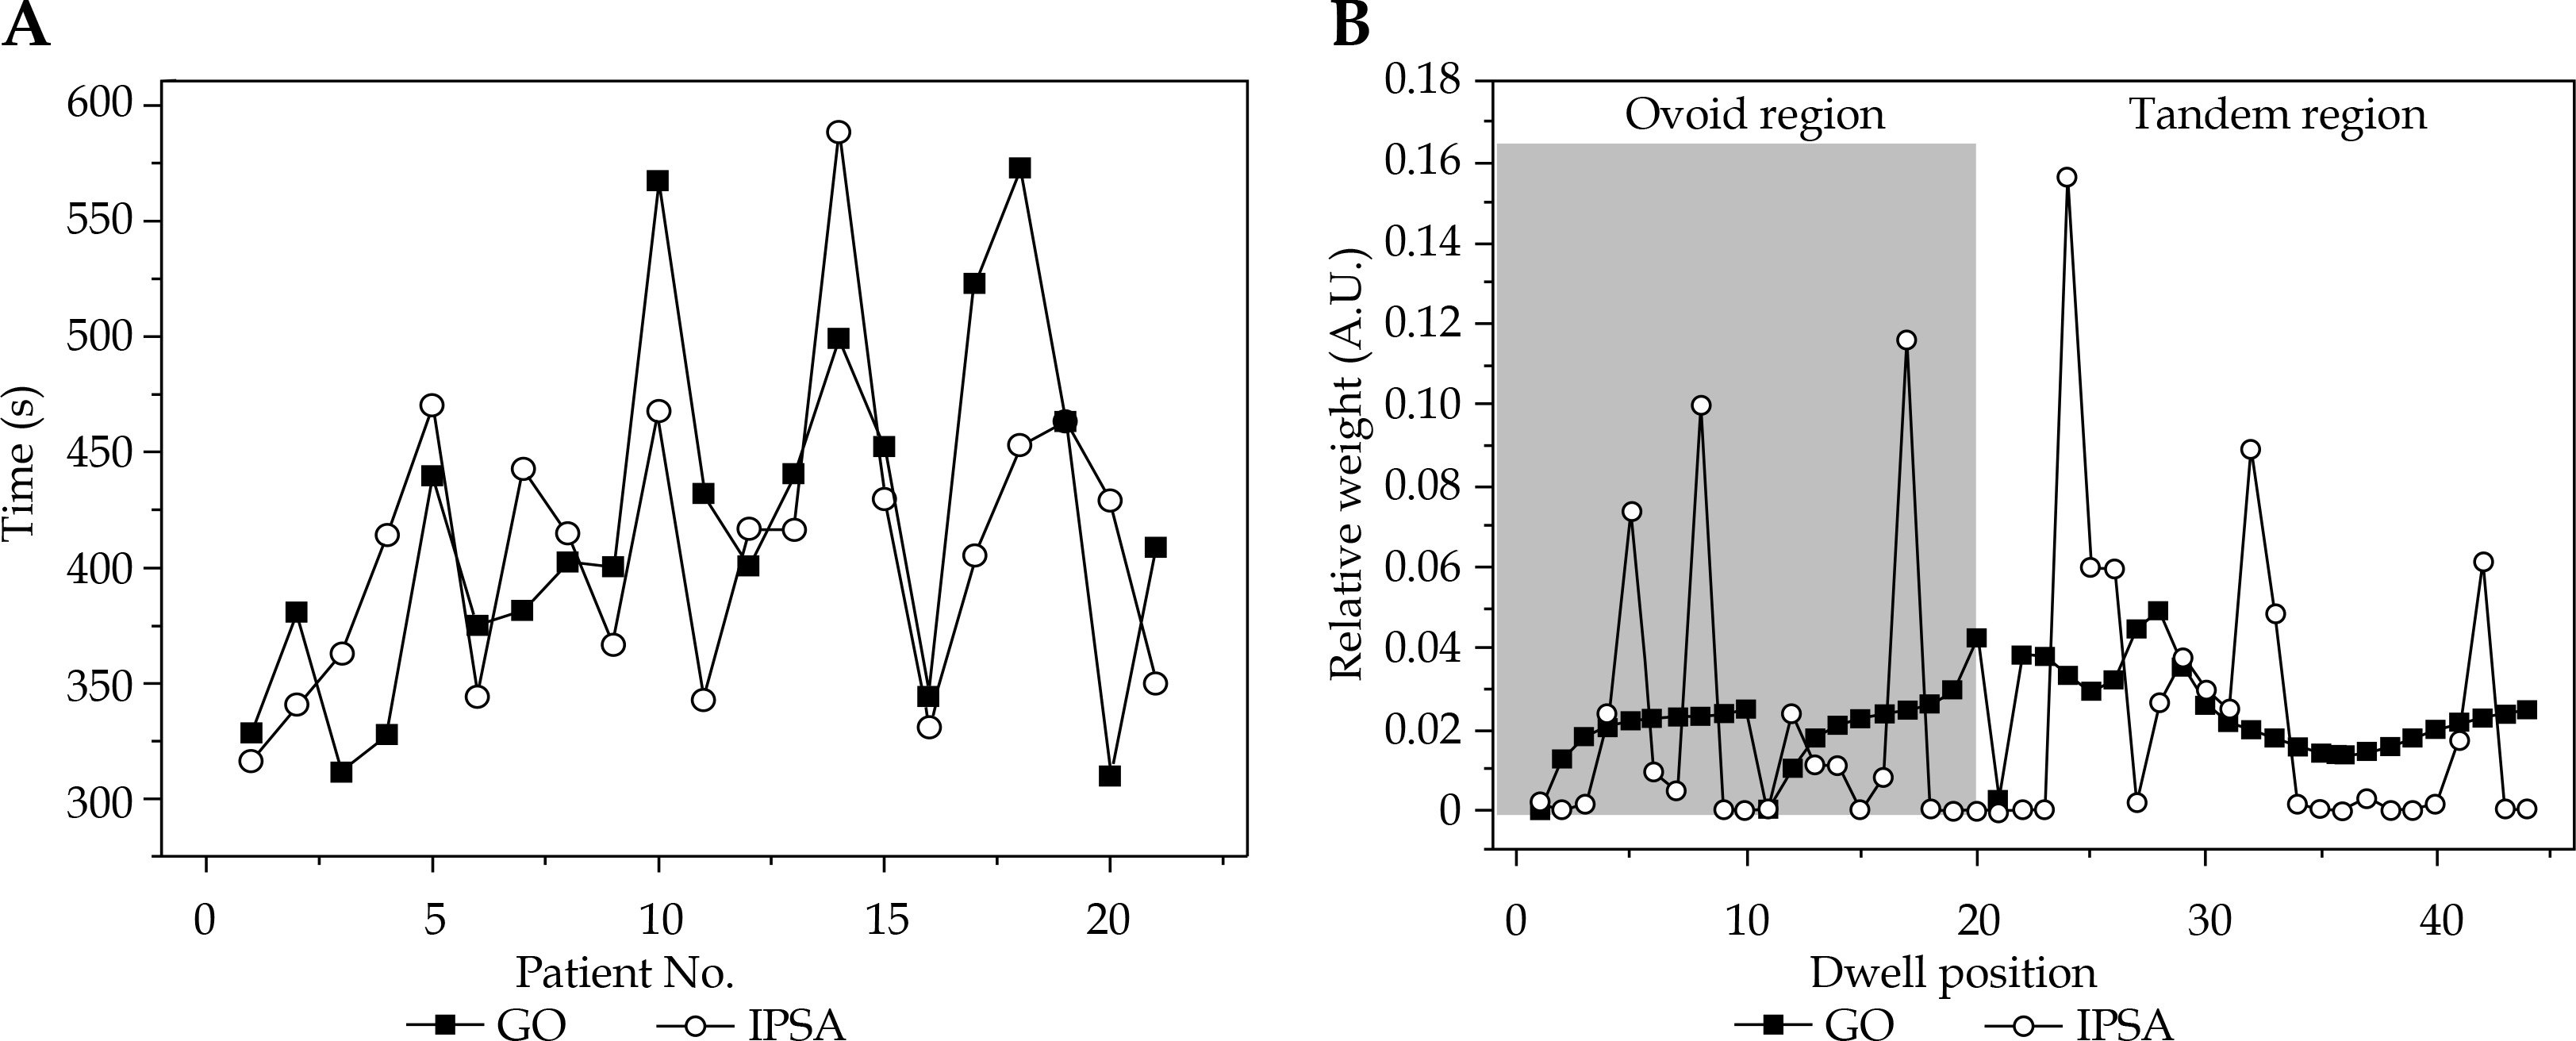
After normalization to a source strength of 38.830 cGy. cm2.h-1, the mean irradiation time over 21 patients for GO and IPSA was 417.2 ±75.1 s and 407.9 ±62.4 s, respectively, with no statistical difference (t = 0.632, p = 0.534); the results obtained for each patient are reported in Figure 3A. However, the dwell point weight (DPW) distribution varied for GO and IPSA, as shown in Figure 3B, for a particular patient. IPSA demonstrated a greater range of relative dwell weight than GO. In IPSA, only 17 out of 44 dwell positions were effectively used and some specific points had relatively large dwell times, whereas in GO, a smoother distribution of DPW was shown and none of the dwell points were completely turned off.
Discussion
To date, the Groupe Européen de Curiethérapie in the European Society for Therapeutic Radiology and Oncology (GEC-ESTRO) and the American Brachytherapy Society (ABS) have not recommended an optimization method for ICBT of cervical cancer. Two previous dosimetric studies [19,20] conducted in our center showed that ICBT optimized by GO and IPSA, respectively, can both provide good target coverage and maintain low-dose to OARs when combined with EBRT. Through further comparison, this study shows that GO and IPSA plans do not have a significant difference in target volume dose distribution, homogeneity, and conformity for ICBT of cervical cancer. Although Hsu et al. [21] compared plans of prostate cancer optimized by GO or IPSA and they found that IPSA plan was superior to GO plan in target (V100), HI, and CI, and the dose of bladder and rectum was lower in IPSA plan. The main reason for this discrepancy between Hsu’s study and ours is due to limited number of Fletcher applicator catheters used, resulting in a small optimization space of dwell position and weight. Therefore, the potential and flexibility of IPSA in our study was not as obvious as in multichannel implanting brachytherapy. Another limitation of this study is that only surface dose points were set as the objectives in IPSA optimization process, particularly Dmin for the CTV and Dmax for the OARs, and no DVH parameters were used. However, these results revealed that IPSA plans are still better at controlling the maximum dose points of the bladder and rectum.
GO and IPSA both depend on the experience and skill of planners. In GO optimization, the isodose line is manually dragged to improve dose coverage. Although GO is an intuitive and effective optimization tool, it obviously lacks reproducibility and is largely influenced by experience of a physician. The geometrical shape of the target varies with patients, and personalized adjustment is often necessary; thus, more planning time for GO may be required than for IPSA. In contrast, IPSA is not as visually intuitive as GO. However, it can provide an optimal solution that is derived by minimizing the cost function defined by given dose objectives through an iterative optimization process. Although target and surrounding normal tissues could differ between patients, because the delineations follow some guidelines (i.e., RTOG), there is a similarity in applying template sets of dose objectives as a class solution, which can increase the planning efficiency and is highly feasible in IPSA. As for irradiation time, IPSA and GO show no statistically significant difference, whereas DPW distribution indeed varies with optimization method for a particular case, which agrees with the conclusion from Hsu et al. [21]. The inhomogeneity of DPW, as shown in Figure 3B, is a IPSA problem [17], and those points with large dwell time might result in an overdose to normal tissue around targets where no explicit OARs have been contoured [16]. Setting a higher dwell time deviation constraint and drawing support structures around applicators might be helpful [15].
Conclusions
For ICBT of cervical cancer, plans optimized with GO and IPSA may result in no significant difference in target dose; however, IPSA may reduce the maximum dose to surrounding normal tissues. Nevertheless, in this study, no significant difference was found for V200 of the target between GO and IPSA. There were possibilities that IPSA optimization could result in inhomogeneous dwell time distribution, which would consequently lead to hot spots around the applicator.


