
Purpose
Standard radiation therapy for cervical cancer involves a combination of external beam radiation therapy (EBRT) and brachytherapy (BT) [1-10]. In the combined use of EBRT and BT, dose assessment requires the summation of doses received from both radiotherapies. In image-guided adaptive BT (IGABT), target and organ at risk (OAR) volumes are defined on three-dimensional images. Moreover, dose evaluation is based on the corresponding dose-volume histogram [7]. There are several methods for evaluating total dose received during EBRT and BT. Although a deformable image registration (DIR) technique may be used, without appropriate image processing and patient preparation, such as enemas, the accuracy of total dose evaluation is insufficient and complicated because of potential anatomical variations between EBRT and BT [11]. Therefore, a combination of representative dosimetry parameters (DPs) derived from BT and EBRT is generally employed to reasonably estimate the total dose [6, 9]. A minimum dose received by 90% (D90%) of high-risk clinical target volume (HR-CTV) and a minimum dose received by 2 cm3 (D2cc) of OARs are representative DPs used for parameter summation [6, 11, 12].
Previous reports have indicated that parameter summations correlate with local control and probability of late side effects [7, 13-18]. Furthermore, dose constraints recommended by guidelines are not physical doses, but doses considering biological matters. Therefore, biological effects of the difference in fractionated doses between EBRT and BT should be deemed for summation. In commercial radiation treatment planning systems (TPS), planning is based solely on physical dose distributions without considering biologically effective dose. Thus, a TPS-specified physical dose must be converted to a biologically effective dose to include biological effects in treatment planning. We developed a system to calculate the total dose from both BT and EBRT for targets and OARs using equivalent doses in 2 Gy fractions (EQD2) conversion. Even though GEC-ESTRO also provides a spreadsheet, where the total dose can be calculated considering EQD2 [19, 20], the sheet does not display the relationship with the dose constraint value, as it lacks areas for setting dose constraints for OARs. This means that the total dose must be estimated and compared with dose constraint values to determine whether the OAR dose constraint is ultimately met during treatment. Furthermore, the user is required to perform a detailed calculation to verify the physical dose value to be incorporated into BT plan. Conversely, our proposed system allows users to arbitrarily set OAR dose constraint values, explicitly indicating physical dose constraint values, which have to be met for each BT session, based on cumulative EQD2 dose of EBRT and BT sessions performed. In this study, we evaluated the system’s dosimetric impact by comparing dose distributions pre- and post-implementation.
Material and methods
Ethics consideration
This retrospective study was approved by the Institutional Review Board of the National Cancer Center Hospital (approval number: 2017-091), according to ethical standards encompassed in the Declaration of Helsinki.
System overview
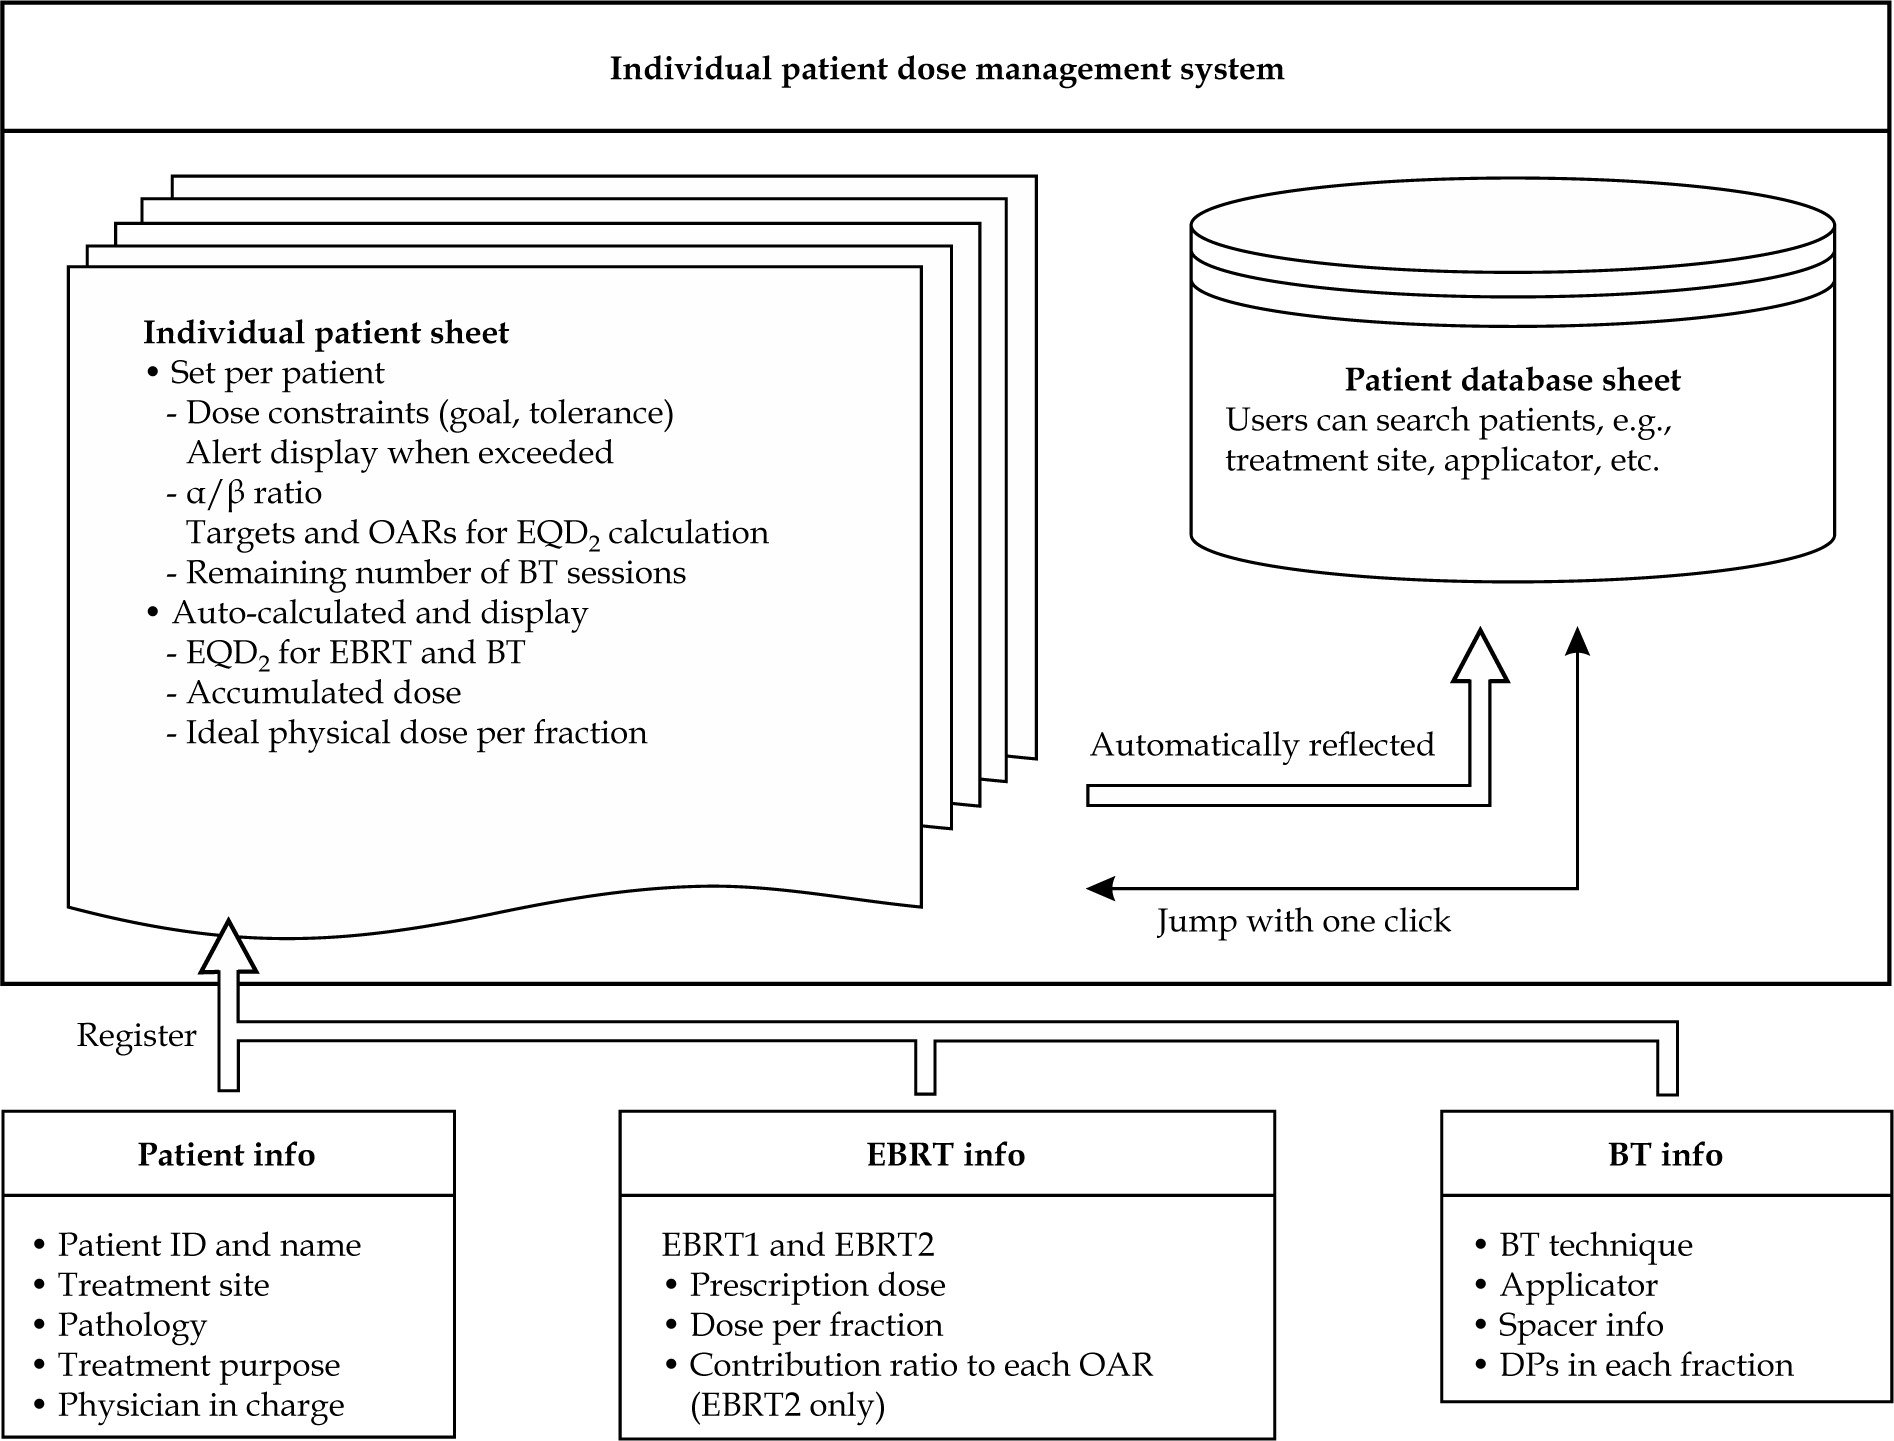
Figure 1 presents an overview of the system developed in this study, which uses Microsoft Excel spreadsheets (version 16.71; Microsoft, Redmond, WA, USA). The system consists of individual patient and database sheets. In the individual patient sheet, patient name, patient ID, BT technique, applicator, physician in charge’s name, treatment site, treatment purpose, pathology, and spacer information are registered. EBRT dose information can be entered separately for EBRT1 and EBRT2 in each patient sheet. EBRT1 is assumed to be the dose from whole pelvis (WP) irradiation, and is uniformly accumulated in targets and each OAR. Conversely, EBRT2 is supposed to be the dose from pelvis irradiation with central shielding (CS) technique or boost irradiation to pelvic lymph nodes, and some organs, such as the small bowel, are not exposed to high-dose. Furthermore, previous study reported that dose contributions to targets and each OAR were certain percentages in case of using the CS technique [21]. Therefore, the system can also specify the contribution (%) of EBRT2 dose to the target and each OAR, and accumulate the doses. After entering the EBRT prescription dose and dose per fraction, the EQD2 dose of EBRT is automatically calculated. Dose constraints can be set for the rectum, bladder, sigmoid colon, and small bowel; however, no dose constraints are applied to HR-CTV. The dose constraints of OARs determined by the user can be set at two levels in each patient sheet, i.e., goal and tolerance, and α/β ratio of targets and OARs in each patient sheet can also be changed. The delivered doses of BT for the targets and each OAR are entered at each fraction in each patient sheet as DPs. After entering the physical dose of BT session conducted, EQD2 doses for EBRT and BT are automatically accumulated, and the latest DPs are updated and displayed. The system calculates and displays the total EQD2 dose in two patterns: the first dose pattern adds EBRT1 and BT, and the second adds EBRT1, EBRT2, and BT. For both dose patterns, the system provides corresponding ideal dose values and alert indicators in each session. An alert is displayed when the total dose exceeds dose constraints. The remaining number of BT sessions is entered in each patient sheet, and the ideal physical dose per fraction (i.e., TPS-displayed dose) that satisfies each dose constraint for the number of remaining BT sessions is displayed for each OAR. Additionally, this system not only calculates the total dose for each patient, but also provides a simple database for managing individual patient doses, which can be used for clinical and research purposes. The details of the system and practical use performed at our hospital are shown in Supplementary Data A and B.
Fig. 1
Systematic overview of the study. The system consists of individual patient and database sheets. Patient information is registered on an individual patient sheet and automatically reflected in database sheet. In the individual patient sheet, the user can set the dose constraints for OARs and α/β ratio for targets and OARs. In addition, there are functions for EQD2 calculation, dose summations, overdose alerts, and ideal dose calculation
OAR – organ at risk, EBRT – external beam radiation therapy, BT – brachytherapy, EQD2 – equivalent doses in 2 Gy fractions, DP – dosimetry parameter
Total dose evaluation
To assess the total dose received from both BT and EBRT, EQD2 based on the linear-quadratic model was calculated for each treatment modality, and these were then accumulated to calculate the total dose. The total dose was assessed using following equations [22, 23]:
Total dose (EQD2) = EBRT dose (EQD2) + BT dose (EQD2) (1)
where d and N represent the fractionated dose and the number of fractions, respectively. To assess the dose to OARs and tumors in this study, α/β ratios for OARs and tumors were set to 3 and 10 Gy, respectively. These values can be set individually by the user.
At our institution, dose constraints for the total EQD2 dose of EBRT and BT are set based on previous reports [6-8, 13-18, 24, 25]. The dose constraint levels of goal and tolerance in this study are summarized in Table 1.
Patient and plan selection for evaluating dosimetric impact of the system
To examine dosimetric impact of the system, doses received by cervical cancer patients who were treated using EBRT and BT in four fractions were compared before and after implementation of the system, and were divided into two groups, i.e., with system and without system. The method for treatment planning in BT differed between these two groups, although dose constraints were the same. In the group without system, the ideal fractionated dose in BTs was calculated by the dose after subtracting EBRT dose from the dose constraint, and considering the number of BTs, resulting in equaling it among BTs. In the group with system, the ideal dose was calculated by the number of remaining BTs and the dose after subtracting EBRT and completed BTs dose from the dose constraint, resulting in variations among BTs. From January 2015 to July 2023, 214 patients with cervical cancer underwent computed tomography (CT)-based image-guided adaptive BT, including 114 patients who underwent BT in four fractions. Thirty-two patients were excluded due to following reasons: insufficient information (n = 3), history of BT (n = 3), dose optimization using incomplete contouring (n = 5), sub-standard BT technique (n = 3), bladder/rectal involvement (n = 5), or dose optimization using inappropriate dosimetric evaluation (n = 13). The details on patient exclusion criteria are presented in Supplementary Data A. Therefore, 82 patients’ data were analyzed retrospectively. Forty-one patients treated from January 2015 to July 2020 were assigned to the group without system, and 41 patients treated from August 2020 to July 2023 were assigned to the group with system. The patient characteristics are provided in Table 2.
Table 2
Patient characteristics
[i] EBRT – external beam radiation therapy, 3D-CRT – 3D conformal radiation therapy, IMRT – intensity-modulated radiation therapy, BT – brachytherapy, EQD2 – equivalent doses in 2 Gy fractions, HBT – hybrid intracavitary or interstitial brachytherapy, ICBT – intracavitary brachytherapy, TNM – tumor, note, and metastasis; * significant difference
EBRT and BT
Definitive radiation therapy for patients with cervical cancer was performed using EBRT and BT. The details on EBRT and BT are shown in Supplementary Data A. EBRT was completed using either 3D conformal radiation therapy (3D-CRT) with photon beams or intensity-modulated radiation therapy (IMRT). In 3D-CRT cases, WP was irradiated with 19.8-50 Gy (1.8-2 Gy/fr.), followed by pelvic irradiation with CS, until the total dose in the pelvic sidewall reached 50 Gy or 50.4 Gy (1.8-2 Gy/fr.) [24-29]. In IMRT cases, WP irradiation without CS was performed at 39.6-50.4 Gy (1.8 Gy/fr.). For EBRT dose, calculating dose contribution from pelvic irradiation with CS for each patient required a complex DIR process with several assumptions. Also, due to the use of CS, dose contribution to the central pelvis was minimal. Therefore, in this study, only WP dose from EBRT1 was included in the total dose, and contribution from pelvic irradiation with CS was excluded, although the system was capable of displaying this contribution [28, 30]. Additionally, dose constraint values for HR-CTV were derived from a prospective multi-institutional study that evaluated only WP doses (Table 1) [26]. In BT, treatment protocol consisted of one session per day for a total of four sessions, with a separate applicator insertion for each session. The prescribed dose was 6 Gy into HR-CTV D90% per fraction. Treatments involved conventional intracavitary BT, hybrid intracavitary BT, or interstitial BT.
Various applicators can be employed in BT for cervical cancer; we analyzed them collectively due to limited data preventing reliable statistical analysis, treatment plans adhering to consistent DPs, and dose constraints regardless of the applicator. To minimize rectal and bladder doses during BT, a hyaluronic acid gel was injected into recto-vaginal and vesico-ureteral septa under transrectal ultrasound [31–33], termed “rectal spacer” and “bladder spacer”, respectively, with the percentages presented in Table 2. All cases in this study were planned using forward planning.
Comparison of DPs
In this study, DPs were compared based on D90% of HR-CTV and D2cc of the rectum and bladder to examine the dosimetric impact of the system. Sigmoid colon and small bowel doses were not assessed in this study, because not all patients had their sigmoid colon and small bowel contoured in all their brachytherapy plannings. The following items were compared between the group without system and group with system:
Per-patient mean DP values across four BT fractions.
Per-patient mean ratio of OARs D2cc to HR-CTV D90% across four BT fractions.
Total EQD2 for accumulation of EBRT and BT for each DP.
Ratio of OAR D2cc to HR-CTV D90% in total EQD2 dose for accumulation of EBRT and BT.
Percentage of dose constraint (goal level) achievement.
DP ratio of OAR to CTV was used to evaluate the balance between HR-CTV D90% and OAR doses.
Univariate analysis was performed to analyze patient characteristics (Table 2) and DPs between the group without system and group with system. Additionally, multivariate analysis was done for variables that were found to be significantly different in the univariate analysis to examine the dosimetric impact of the system. The multivariate analysis incorporated system usage (with system and without system) as a variable.
Sub-group analysis was performed to examine patients with HR-CTV D90% of < 85 Gy, and included 37 cases from the group without system and 24 from with system group. This analysis compared discrepancies between the ideal fractionated dose and actual dose at each OAR in each BT session, and those variations among sessions were examined. The analysis was performed to assess whether treatment plan was optimized to maximize the HR-CTV dose, while keeping the OAR dose within upper dose constraint limit.
Here, two ideal fractionated doses applied only to OARs, which were calculated using the goal dose constraint (Table 1) were: initial and cumulative.
The initial ideal dose can be calculated after subtracting an EBRT dose from a dose constraint in each OAR and dividing that dose equally among BTs. Thus, only the EBRT dose can determine the initial ideal fractionated dose, and it can be derived even if the system is not used. On the other hand, in the cumulative ideal fractionated dose, actual doses of completed BT are added to the EBRT dose, and the ideal fractionated dose for the remaining BT sessions is re-calculated for each session. Because this system always displays the cumulative ideal fractionated dose, it is the dose assumed when this system is in use.
Statistical analysis
All statistical analyses were done using SPSS Statistics (version 25; IBM Corp., Armonk, NY, USA). For continuous variables, Shapiro-Wilk test was performed to determine whether samples showed a normal distribution, whereas F-test was performed to analyze variance. Normally distributed data were compared using Student’s t-test, and non-normally distributed data were compared with Mann-Whitney U test. Categorical variables were compared using Chi-squared test. Multiple and multivariate logistic regression analyses were also performed as multivariate analysis. In the sub-group analysis, normally distributed data were compared using one-way analysis of variance, and non-normally distributed data were compared using Kruskal-Wallis test. All statistical analyses were considered significant at a p-value of < 0.05.
Results
Comparison of DPs
Table 3 compares each DP and achieved dose constraint percentages between groups. Figure 2A illustrates the per-patient mean DP distribution across four BT fractions. The DP for HR-CTV D90% showed no statistic differences. However, the median of per-patient mean DP values across four BT fractions for the rectum and bladder was significantly reduced in the group with system by 2.25 Gy (p < 0.001) and 3.04 Gy (p < 0.001), respectively. The distribution of per-patient mean ratio of OARs D2cc to HR-CTV D90% across four fractions is shown in Figure 2B. The group with system showed a significantly lower ratio of the rectum D2cc to HR-CTV D90% (p < 0.001) and the bladder D2cc to HR-CTV D90% (p < 0.001), indicating that in each BT session, dose distribution was optimized to minimize OAR doses while maintaining adequate HR-CTV coverage. The DPs acquired using the total EQD2 dose are demonstrated in Figure 3A. There was no difference in the bladder, whereas the DP (median) for the CT HR-CTV VHR D90% and the rectum was significantly higher in the group with system by 12.66 Gy (p < 0.001) and 5.45 Gy (p = 0.003), respectively. However, the maximum value of DP for the rectum was lower in the group with system. The percentage satisfying the dose constraint for HR-CTV D90% was significantly higher in the group with system than in the without system group (41.5% vs. 9.8%, p = 0.02). However, there was no significant difference between the rectum and bladder. The distribution of the ratio of DP of OARs to HR-CTV D90% acquired using the total EQD2 dose is illustrated in Figure 3B. There was no significant difference in the ratio of the rectum/HR-CTV D90%, while the ratio of the bladder/HR-CTV D90% was significantly lower in the group with system (p < 0.001). This indicated that in the group with system, OAR doses were intentionally reduced with consideration of the total EQD2 dose, and that appropriate adjustments were made without inadvertently increasing OAR exposure on a case-by-case basis.
Fig. 2
Distribution of per-patient mean value of dosimetric variables across four BT fractions. A) Per-patient mean DP values across four BT fractions. B) Per-patient mean ratio of OAR D2cc to HR-CTV D90% across four BT fractions
BT – brachytherapy, DP – dosimetry parameter, EQD2 – equivalent doses in 2 Gy fractions, D2cc – minimum dose received by 2 cm3 of OAR, HR-CTV D90% –minimum dose received by 90% of high-risk clinical target volume
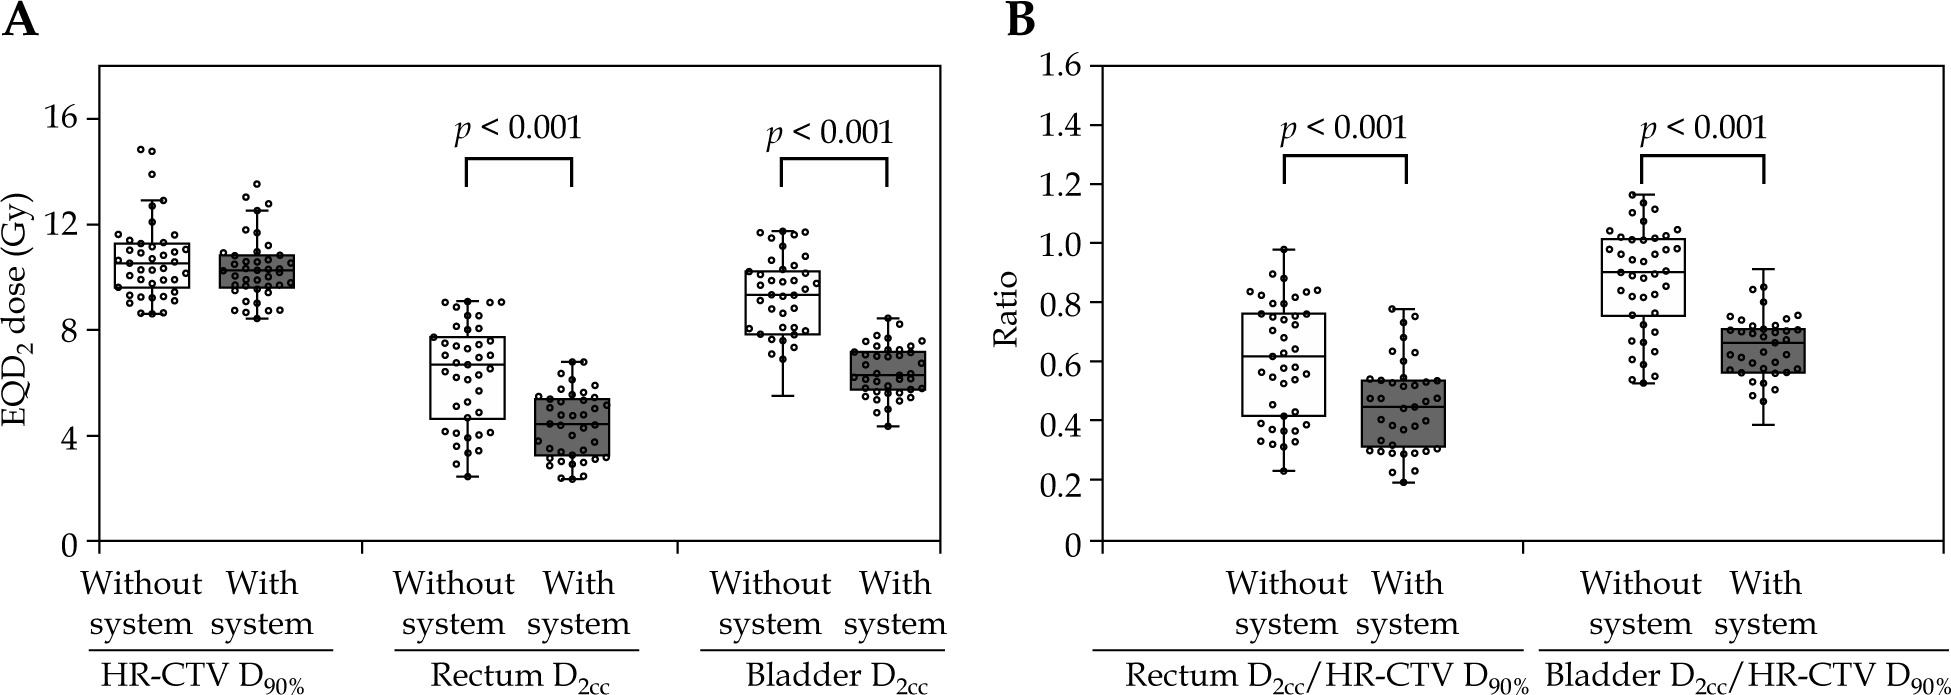
Fig. 3
Distribution of dosimetric variables of total EQD2 dose for accumulation of EBRT and BT. A) Total EQD2 dose for each dosimetry parameter. B) Ratio of OARs D2cc to HR-CTV D90% in total EQD2 dose
EBRT – external-beam radiation therapy, BT – brachytherapy, EQD2 – equivalent doses in 2 Gy fractions, DP – dosimetry parameter, OAR – organ at risk, D2cc – minimum dose received by 2 cm3 of OAR, HR-CTV D90% – minimum dose received by 90% of high-risk clinical target volume
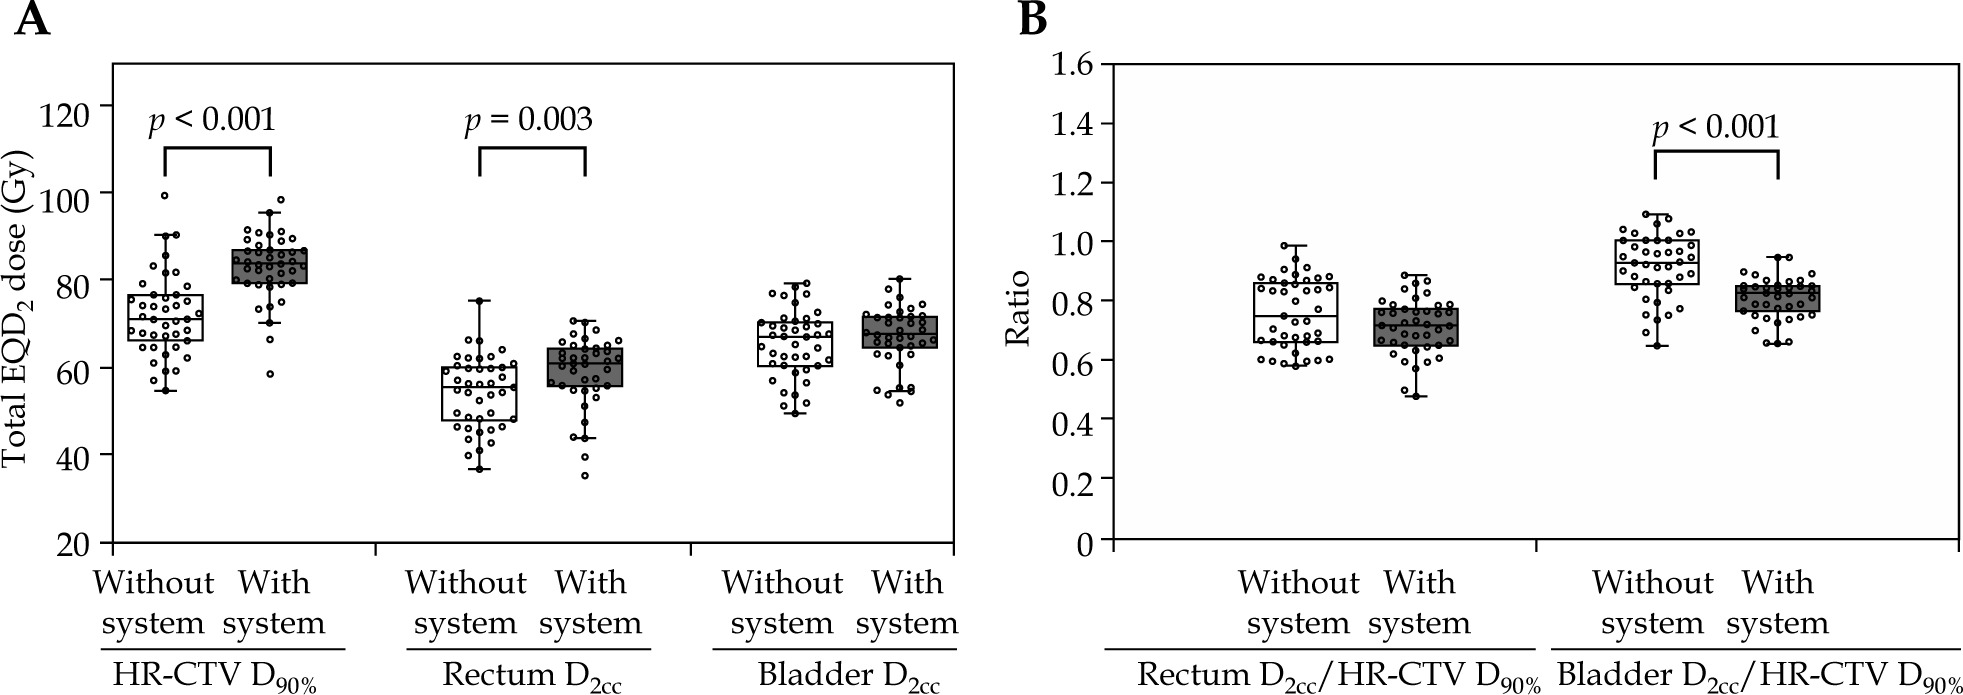
Table 3
Comparisons between the group without system and with system group for each dosimetry parameter, and the percentage of dose constraint values achieved
[i] DP – dosimetry parameter, EBRT – external beam radiation therapy, BT – brachytherapy, D2cc – minimum dose received by 2 cm3 of OAR, OAR – organ at risk, HR-CTV D90% – minimum dose received by 90% of high-risk clinical target volume, EQD2 – equivalent doses in 2 Gy fractions; * significant difference
The univariate analysis revealed significant differences in the BT technique, rectal spacer, bladder spacer, EBRT technique, and WP dose between the two groups (Table 2). In the current study, the prescribed dose was considered as the total dose delivered to all organs, independent of EBRT technique used. In other words, the dosimetric effect was determined solely by the total dose, and was not influenced by the type of EBRT technique. Therefore, EBRT techniques were excluded from the multivariate analysis. The multivariate analysis, incorporating four variables with or without system, was conducted for each DP parameter, focusing on the percentage of dose constraint values, which differed significantly between the two groups, as identified in the univariate analysis. Table 4 demonstrates the results of the multivariate analysis. As presented in that table, there was a correlation between the group with system and the fractionated rectal and bladder doses in BT, the ratio of the bladder dose to HR-CTV D90% in each fraction, and the ratio of the bladder dose to HR-CTV D90% for the total EQD2 dose.
Table 4
Results of multivariate analysis of dosimetry parameters and the percentage of dose constraint values achieved
[i] DP – dosimetry parameter, EBRT – external beam radiation therapy, BT – brachytherapy, D2cc – minimum dose received by 2 cm3 of OAR, OAR – organ at risk, HR-CTV D90% – minimum dose received by 90% of high-risk clinical target volume, EQD2 – equivalent doses in 2 Gy fractions, WP – whole pelvis, RC – regression coefficient, ICBT – included conventional intracavitary brachytherapy, HBT – hybrid intracavitary or interstitial brachytherapy; * significant difference
Table 5 shows the results of the sub-group analysis of cases, which did not satisfy HR-CTV D90% dose constraint. Figure 4 illustrates the difference between the actual and ideal doses of DPs for the rectum and bladder in each fraction. In both the groups (with and without system), there were marginally lower doses for both the rectum and bladder compared with the initial ideal fractionated dose, but there were no significant differences among the four fractions. However, the group without system showed an increasing difference between the actual and cumulative ideal fractionated dose as the number of fractions increased. In the fourth fraction, the median rectum and bladder doses were 3.18 Gy and 4.35 Gy lower than the respective cumulative ideal fractionated dose. This difference corresponded to the variance between the total dose and dose constraint. In the group without system, there were significant differences between the actual and cumulative ideal fractionated dose for the rectum and bladder among the four fractions (p < 0.001 and p < 0.001, respectively). Conversely, there was no significant difference in the rectum in the group with system (p = 0.441), but there was a significant difference in the bladder (p < 0.001). In the fourth fraction of the group with system, the median rectum and bladder doses were 1.30 and 4.09 Gy lower than the cumulative ideal fractionated dose, reflecting differences between the total and constrained doses.
Fig. 4
Differences between actual delivered dose and ideal dose based on DPs for the rectum (A) and bladder (B) at each fraction
DP – dosimetry parameter, D2cc – minimum dose received by 2 cm3 of OAR, fr. – fraction
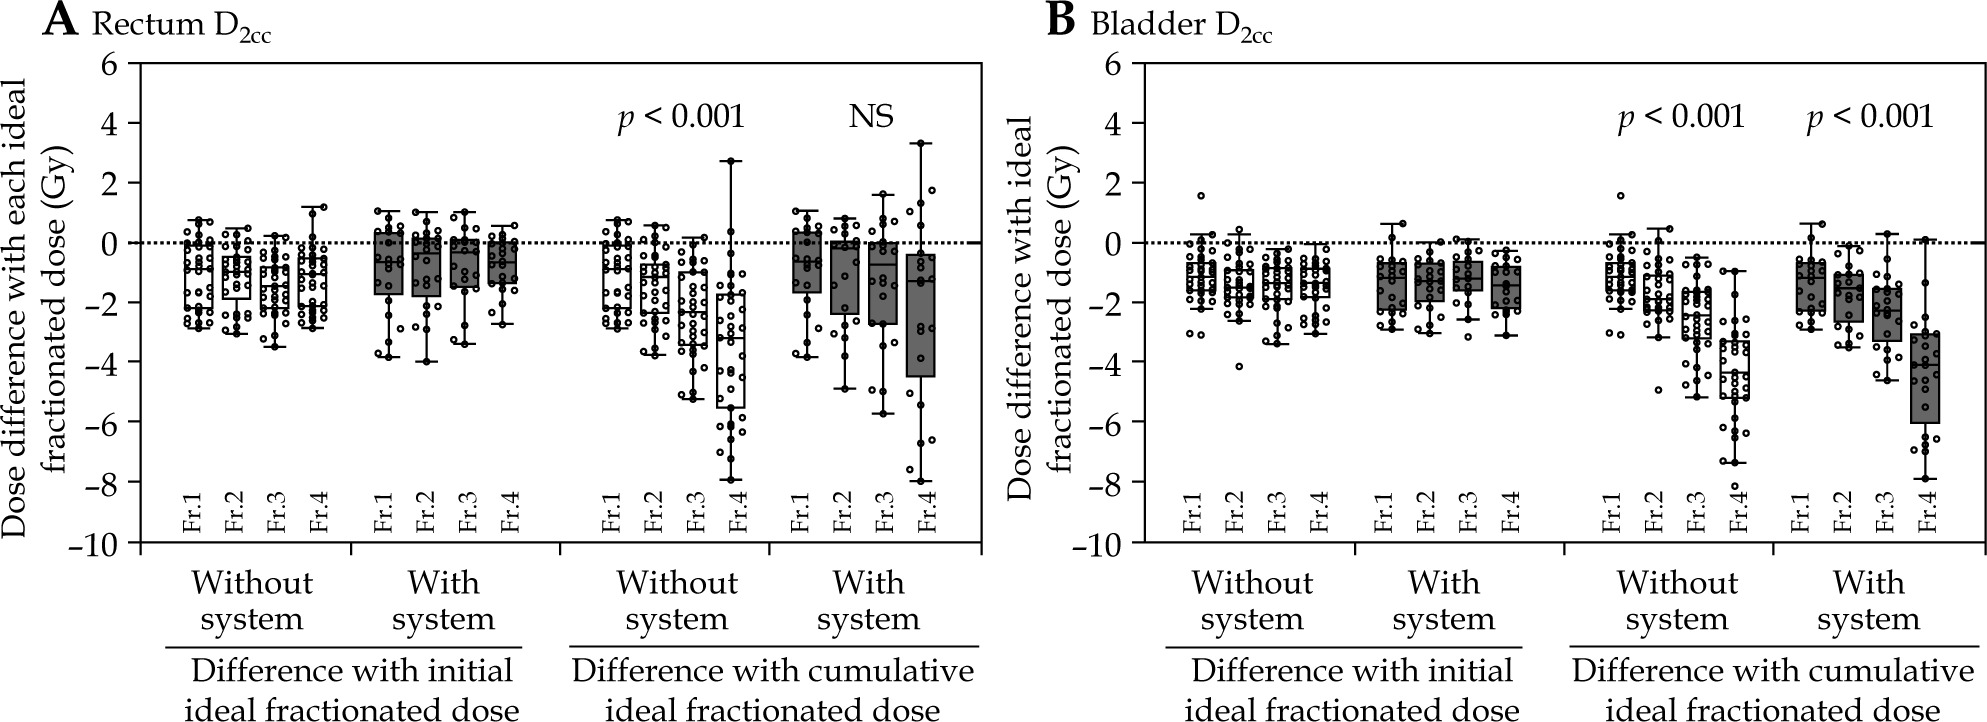
Table 5
Difference between actual delivered dose and each ideal fractionated dose of BT. *1: Initial ideal fractionated dose assumed that the total dose delivered by EBRT and BT was consistent with dose constraint in each OAR, and it was defined as the fraction dose delivered evenly throughout four BT sessions after considering contribution of EBRT. *2: Cumulative ideal fractionated dose assumed that the total dose delivered by EBRT and BT was consistent with dose constraint in each OAR, and it was defined as the fraction dose delivered evenly throughout remaining fractions of BT after considering contribution of EBRT and terminated BT
Discussion
Many TPSs display physical dose distributions, but not EQD2 [34]; however, EQD2 dose evaluation is advised for BT in uterine cervical cancer [7, 13, 16, 17]. Therefore, total dose in each BT should be assessed by converting physical doses to EQD2, potentially requiring BT planning revisions to meet dose constraints for organs and tumors based on EQD2 cumulative doses for optimal distribution. Addressing these constraints, with repeated adjustments in dose distribution and re-calculating total doses, presents challenges due to staff and time constraints as well as errors from BT applicators and needles. We developed a simple method to calculate target and OAR doses using EQD2 conversion. Cheng et al. [34] described a similar, though more complex, system, which requires integrating multiple software packages, often hindered by vendor resistance to configuring various third-party software for TPS. In contrast, our system employs a versatile spreadsheet (Microsoft Excel, Microsoft), which facilitates deployment, and is accessible for managing institutional data and developing clinical databases.
We introduced our system to accelerate IGABT research on gynecological tumors (Supplementary Data A). The system allows users to set and monitor dose constraints for OARs, displaying the optimal physical dose for each BT session according to the total EQD2 dose. This setup permits verification of dose constraints against physical doses shown in TPS prior to and during each session, thereby, reducing planning time by avoiding repeated dose adjustments and evaluations [35]. Although this study focused on patients receiving four-fraction BT, in routine clinical practice, the number of fractions may be adjusted during treatment due to residual lesions or modifications in treatment plan. Our system allows for the update of ideal dose based on the number of remaining fractions entered, facilitating a clear understanding of the relationship between dose constraints and total dose, even when the number of fractions changes.
This study assumed that the dose delivered using the CS technique in EBRT was excluded from the total dose evaluation of pelvic organs [28, 30]. Although the resulting total dose to HR-CTV in such cases is approximately 70 Gy lower than the 87 Gy recommended by the American Brachytherapy Society (ABS) guidelines, favorable treatment outcomes have been reported [26]. Conversely, Tamaki et al. analyzed contribution of the dose used in the CS technique to each organ by planning studies, and reported that the contribution of CS to HR-CTV D90%, bladder D2cc, and rectum D2cc values resulted in 13-35%, 11-16%, and 5-6%, respectively, with shielding width of 4 cm [21]. This system includes a function to specify dose contribution of EBRT (EBRT2), and to display the total dose both with and without its inclusion (Supplementary Data B, Figure B.1b). Therefore, the system can be applied to dosimetric evaluation in various treatment strategies for cervical cancer, including central shielding (CS) irradiation and boost irradiation to pelvic lymph nodes.
The group with system exhibited a significantly higher WP dose, elevating HR-CTV D90%, and rectum total doses (Tables 2, 3). However, the rectum dose constraint achievement rate showed no significant variance, whereas the HR-CTV constraint rate was notably higher in the group with system (Table 3). This indicates the system’s efficacy in WP dose variation management as well as rectum dose constraint adherence without compromising HR-CTV dosage. Both the groups comparably met the bladder dose constraints; however, the group with system showed significantly lower bladder doses per BT session and a lower ratio of the bladder D2cc to HR-CTV D90% compared with the group without system. This suggests effective dose-conscious planning in the group with system, despite the ease of meeting dose constraints. Although the effect of hydrogel spacer cannot be completely excluded [31], the system independently influenced the outcomes in the multivariate analysis. Moreover, previous studies have reported reduced OAR doses with the use of hybrid brachytherapy (HBT) techniques [36]. Although the influence of HBT cannot be entirely excluded, the multivariate analysis indicated that the dose effect of HBT use was not statistically significant (Table 4). Furthermore, even though there was no significant decrease in the rate at which the OAR dose constraint was achieved, the system provided the opportunity to decide whether to prioritize the dose coverage of HR-CTV or reduce the OAR dose. In the group without system, the OAR doses and HR-CTV dose coverage in each BT session were adjusted based on fixed values, without accounting for differences in EBRT doses among cases or between sessions. In contrast, in the group with system, the cumulative ideal dose enabled to identify the acceptable OAR doses more clearly for each BT session, and to optimize the HR-CTV dose coverage, while prioritizing the OAR dose constraints. When the dose coverage for HR-CTV was low, adjustments were made to improve it, even if the OAR dose constraints were slightly exceeded. In other words, treatment planning in the group with system was performed with clear understanding of dose constraint adherence, whereas in the group without system, the OAR dose constraints may have been unintentionally exceeded despite potential opportunities for dose optimization.
In the sub-group analysis of cases with HR-CTV D90% doses of < 85 Gy, the OAR dose was slightly lower than the dose constraint based only on the WP dose, regardless of the use of this system. The ideal dose for each OAR during BT sessions was determined by considering the OAR dose constraints, WP dose, and the number of preceding BTs for both the groups. Table 5 shows that the difference between the actual and ideal doses, based on initial OAR dose constraints, was similar across the 4-fraction BTs within each group. However, differences in the actual doses derived from cumulative dose constraints widened with more BT sessions in the group without system. In contrast, these differences remained consistent in the group with system, where doses more closely adhered to constraints in each BT. This indicates that the system facilitated a balanced plan, optimizing CTV coverage, while adhering to OAR constraints at each BT application.
This study has some limitations. Notably, EBRT and BT doses were summed using the EQD2 dose prescribed by GEC-ESTRO for HR-CTV and OARs evaluation [6], focusing solely on DP accumulation and overlooking organ position variability in BT and EBRT. Consequently, dose assessments may not accurately represent the true absorbed doses for HR-CTV and OARs, impacting local control and adverse event incidence [24, 37]. However, because many studies have confirmed correlations between DPs assessed by our method and clinical outcomes [7, 13-18], our approach remains a straightforward and dependable method for dose evaluation relevant to treatment effects.
The introduction of the system coincided with changes in both the EBRT technique (including the use of IMRT, which affected the WP dose) and BT technique (including the use of HBT and spacers), making a fully equal assessment difficult. However, it was confirmed that the introduction of the system facilitates optimal treatment planning to maximize the HR-CTV dose coverage, while adhering to OAR dose limits in each session. Studies with more homogeneous patient populations may further demonstrate the system’s usefulness.
Moreover, our study’s focus on cervical cancer, limiting its applicability to other gynecological cancers. Nevertheless, the established DPs for HR-CTV and OARs, essential for tumor control and mitigating adverse events, may serve as a valuable reference for other institutions [4-7]. The system is free and downloadable, and we hope it will be used effectively for clinical and research purposes at many facilities. Future studies could provide deeper insights into clinical outcomes, enhancing uterine cervical cancer treatments.
Conclusions
Our spreadsheet system (Microsoft Excel) calculates the total EQD2 dose for uterine cervical cancer patients, and determines the ideal physical dose constraints for each BT session, which satisfy OAR constraints based on the total EQD2 dose. The ideal physical dose constraints are displayed before each session and during treatment planning for preventing unexpected variations from the dose constraints in each OAR. Although the overall rate of OAR constraint achievement did not differ significantly, the system could support optimization of HR-CTV dose coverage while maintaining OAR dose limits. In addition, it helped preventing unintentional increases in OAR dose and facilitated appropriate dose reductions. The system also provided clinical decision-making on whether to prioritize HR-CTV coverage or reduce OAR doses in each patient. By minimizing the need for repeated dose adjustments, the system may help streamline treatment planning. Therefore, our system contributes to safer and more effective radiotherapy.


