

Introduction
There are over 257 million chronic hepatitis B (CHB) cases caused by hepatitis B virus (HBV) worldwide, and the infection rate is relatively high [1]. A considerable number of HBV-infected patients are infected in the perinatal period or in infancy and childhood, and the long-term follow-up treatment of these people brings serious economic burdens to society and families [2-4]. With the wide application of antiviral treatment regimens for CHB in clinical practice, for a patient with CHB, whether it is deciding when to start antiviral therapy, or monitoring the efficacy of the treatment process, the treatment plan in terms of the changes in patients, when to stop the drug, and the prediction of relapse after drug discontinuation, the detection of the virus and its related antigenic tables will closely depend on the detection of the virus and its serology [5-9]. Current HBV management guidelines recommend entecavir (ETV), a potent HBV inhibitor with a high barrier to resistance development, as first-line monotherapy [10, 11].
Monitoring of liver fibrosis includes invasive and non-invasive methods [12]. For a long time, the gold standard for the diagnosis of liver fibrosis has been histopathological examination of liver biopsy, which plays an important role in confirming the diagnosis, judging the degree of inflammatory activity and fibrosis, and determining the efficacy of drugs and prognosis [10, 13]. However, because it is an invasive examination, continuous dynamic research cannot be carried out, and the unevenness of the lesions in the liver tissue can easily lead to sampling errors, low evaluation results, and pathological artifacts caused by subcapsular fibrosis [7]. It has major limitations in clinical research [14]. To date, many studies have confirmed that serum biochemical indicators can better reflect the degree and process of liver fibrosis, including extracellular matrix and substances related to the transformation of extracellular matrix such as hyaluronic acid, laminin, type III procollagen aminotelopeptide, type IV collagen, matrix metalloproteinases and their inhibitors tissue metalloproteinase inhibitors (TIMPs), transforming growth factor β, and so on [15-17]. In recent years, four direct fibrosis serological indicators have been studied and applied more for CHB in China. Many clinical studies have shown that they can effectively reflect the situation of liver fibrosis, and the combined detection is more valuable than a single indicator in diagnosing liver fibrosis [18-22]. Few studies have addressed the correlation between the changes of liver stiffness measurement (LSM), fibrosis-4 (FIB-4), aspartate aminotransferase (AST) to platelet ratio index (APRI), cytokines and fibrosis after antiviral treatment in CHB patients [23].
Studies have confirmed that early hepatic fibrosis is reversible, and through correct and reasonable treatment, hepatic fibrosis can be alleviated and cured. Thus, the aim of the present study is to assess changes in serum direct and indirect markers to predict improvement in hepatic fibrosis before and after antiviral treatment by using liver biopsy twice (before treatment and after 78 weeks of ETV treatment), so as to find ideal indicators reflecting fibrosis for patients after antiviral treatment, and compare them with LSM imaging examination and APRI and FIB-4 models of liver fibrosis recommended by the World Health Organization (WHO) to further analyze the fibrosis predictors associated with ETV treatment.
Material and methods
General information
A total of 77 patients with CHB diagnosed in our hospital between October 2013 and May 2016, who underwent paired liver biopsies at baseline and at week 78 of treatment, and received ETV monotherapy, were selected. These patients were administered ETV (0.5 mg daily). Patients who were enrolled in the present study had not been treated with antivirals, antifibrotics or immunomodulating agents for six months.
Diagnostic criteria: 1. Diagnostic criteria for chronic hepatitis B: all patients were diagnosed in accordance with the “Viral Hepatitis Prevention and Control Program” formulated by the 10th Academic Conference on Infectious Diseases and Parasitic Diseases in 2000, including acute hepatitis with a course of more than half a year. If the date of onset is uncertain or the history of hepatitis is unclear, a patient with chronic hepatitis should be diagnosed on the basis of histopathological examination of the liver or on the basis of symptoms, signs, laboratory tests, and ultrasonography. 2. The diagnostic criteria of hepatitis and liver fibrosis: refer to the diagnostic criteria of “Consensus on Diagnosis and Efficacy Evaluation of Liver Fibrosis” formulated by the 2002 Symposium on Histology and Efficacy Evaluation of Liver Fibrosis. Combined with the relevant etiology, age, gender, course of disease, disease process, treatment conditions and clinical manifestations of the current disease and other observation parameters, as well as color Doppler examination and 4 serum markers with 2 or more abnormalities.
The exclusion criteria were as follows: 1) exclude those with liver fibrosis caused by alcohol, immune, drug and other viral hepatitis; 2) those diagnosed with severe chronic hepatitis B and those with a tendency to severe hepatitis; 3) patients with severe cardiovascular, renal, endocrine, blood system, nervous system diseases and mental diseases; 4) those who have used interferon, glucocorticoid and other antiviral drugs and immunomodulators within 3 months; 5) those who have serious adverse reactions after taking the drug, those whose condition has deteriorated, or those who must take the drug for other reasons that affect the observation of the experimental drug efficacy; 6) alcohol and drug abusers; 7) age under 18 years old or over 65 years old, pregnant and lactating women.
Research methods
Hematology test
Biochemical tests were mainly assessed by four items of liver fibrosis, the APRI score, and the FIB-4 index. From all patients who underwent liver biopsy blood samples were collected at the same time on the basis of informed consent. The serum was stored in a refrigerator at –80°C. Alanine aminotransferase (ALT), AST, γ-glutamyl transferase (GGT), and cholesterol (CHOL) were detected by an automatic biochemical analyzer, and automatic blood cell analysis was used. Platelet (PLT) count detection was performed on the instrument, and a Siemens Acuson S2000 high-end color ultrasound diagnostic instrument was used to examine the patient on the same day.
APRI scores and FIB-4
Using the APRI score and FIB-4 calculated by routine clinical test items ALT, AST, PLT to evaluate liver fibrosis and liver cirrhosis, the corresponding test results are substituted into the formula. It can be directly obtained, simply and easily.
APRI = ([AST/ULN]/(platelet count)[× 109/l]) × 100
FIB-4 = (age × AST)/(platelet count) [× 109/l] ×
Liver stiffness measurement
With the clinical demand for liver stiffness testing in patients with liver disease, non-invasive diagnosis of liver fibrosis has developed rapidly in recent years. The FibroTouch and FibroScan detection technologies based on transient elastography technology can directly detect the hardness of the liver outside the body, and use the transient elastography technology to evaluate the hardness value of the liver, expressed in kilopascals (Pa). This fat variable value of liver tissue is estimated by the controlled attenuation parameter theory, and the larger the value is, the greater the fat variable value is. Transient elastography can quantify liver stiffness and steatosis. The degree of liver fibrosis is divided into five grades, F0, F1, F2, F3, and F4, according to the elasticity value. F0 means no fibrosis, ≥ F1 means mild liver fibrosis, ≥ F2 indicates moderate liver fibrosis, ≥ F3 indicates severe liver fibrosis, and F4 indicates liver cirrhosis.
Hepatic histological staging
The histopathology of the liver is mainly graded (G) and staged (S) according to the degree of inflammatory activity and fibrosis. G0 indicates no inflammation, G1 indicates mild inflammation, G2, G3, and G4 indicate gradually increasing inflammation, and G4 has the most severe inflammation; the fibrosis stage F0 indicates no fibrosis, F1 indicates mild fibrosis, F2, F3, and F4 indicate progressively worse fibrosis, and F4 indicates early cirrhosis. CHG1S1 means the liver has mild inflammation and fibrosis. According to the percentage of hepatocyte steatosis in the submitted liver tissue, a 5-degree scoring method is proposed: F0 (< 5%), F1 (5-30% of hepatocytes with steatosis), F2 (steatosis occurs in 31-50% of hepatocytes), F3 (steatosis occurs in 51-75% of hepatocytes), F4 (steatosis occurs in more than 75% of hepatocytes).
Results
Improvement of inflammation and fibrosis after antiviral therapy
A total of 77 patients with paired liver biopsies were enrolled. After 78 weeks of treatment, overall, 78% (60/77) of patients achieved improvement of inflammation (at least a 1-point improvement in HAI scores), 10.4% (8/77) remained stable (no change in HAI scores), while 11.7% (9/77) showed inflammation progression (at least a 1-point increase in HAI scores) (Table 1).
Table 1
Improvement of hepatitis and liver fibrosis after antiviral therapy
| Not improved | Improve | ||
|---|---|---|---|
| Progress | Constant | ||
| Inflammation | 9 | 8 | 60 |
| Fibrosis | 23 | 32 | 22 |
Almost a third (28.6%, 22/77) of patients achieved fibrosis regression (at least a 1-point improvement in Ishak fibrosis scores), 41.6% (32/77) remained stable (no change in Ishak scores), while 29.9% (23/77) showed fibrosis progression (at least a 1-point increase in Ishak scores) (Table 1).
Study population and clinical characteristics
Although there were 685 hepatitis B patients collected, only 490 patients had undergone liver biopsy at baseline. In the remaining 219 patients paired samples were obtained at baseline and at week 78 of treatment, including 77 patients who received ETV monotherapy. Basic demographic, clinical, and laboratory findings of these patients are shown in Table 2. Univariate analysis indicated that parameters of interferon-induced T cell chemokine (ITAC), A2M and FIB-4 were significantly associated with fibrosis regression at week 78.
Table 2
Comparison of baseline data (0 weeks of anti-virus) in each group
[i] BMI – body mass index, HBV – hepatitis B virus, ALT – alanine aminotransferase, ULN – upper limit of normal, AST – aspartate aminotransferase, AFP – α-fetoprotein, APRI – aspartate aminotransferase to platelet ratio index, FIB-4 – fibrosis-4, ITAC – interferon-induced T cell chemokine, A2M – α2-macroglobulin protein
Changes of clinical indicators and cytokines after ETV treatment
Univariate analysis indicated that parameters of ΔTC, ΔHDL, ΔC5a, ΔITAC and ΔPIIINP were significantly associated with fibrosis regression, fibrosis stabilization, and fibrosis progression after 78 weeks of treatment (Table 3).
Table 3
Comparison of changes in clinical indicators before and after anti-virus (78W-0W) in each group
[i] BMI – body mass index, HBV – hepatitis B virus, ALT – alanine aminotransferase, ULN – upper limit of normal, AST – aspartate aminotransferase, LDL – low-density lipoprotein, HDL – high-density lipoprotein, APRI – aspartate aminotransferase to platelet ratio index, FIB-4 – fibrosis-4, ITAC – interferon-induced T cell chemokine, PIIINP – type III amino-terminal peptide of procollagen
Correlation of fibrosis stage between pre-treatment and post-treatment
Spearman’s correlation analysis was performed to evaluate the correlation between serum markers and fibrosis grades. Before the treatment, parameters of albumin (ALB), TP, Fibscan, PT, C3-like1, CD163, HA, angptl2 and TGF-β1 were positively correlated with the liver fibrosis stage. After the treatment, parameters of GGT/upper limit of normal (ULN), Fibscan, PLT/ULN, TC, CD163 and HA were positively correlated with the liver fibrosis stage (Table 4).
Table 4
Changes in the correlation coefficient of each clinical index before and after anti-virus and fibrosis grade (S)
* p < 0.05, ** p < 0.01; GGT – glutamyltranspetidase, ULN – upper limit of normal, ALB – albumin, TP – total protein, PT – prothrombin time, PLT – platelet, TC – total cholesterol, HA – hyaluronic acid, TGF – transforming growth factor, APRI – aspartate aminotransferase to platelet ratio index, FIB-4 – fibrosis-4
Before antiviral treatment, ALB, total protein, liver elasticity value, prothrombin time, C3-like1, CD163, HA, angptl2, TGF-β1 were correlated with the grade of fibrosis (p < 0.05); after antiviral treatment GGT/ULN, liver elasticity value, PLT/ULN, total cholesterol, CD163, HA were correlated with fibrosis grade (p < 0.05).
Baseline predictor of fibrosis improvement after 78 weeks of ETV
Baseline evaluation between improvement of liver fibrosis and no improvement of liver fibrosis after nucleos(t)ide analog antiviral therapy.
Multivariate analysis showed that baseline Ishak fibrosis score (OR = 1.651, 95% CI: 1.025-2.657, p = 0.039) was the only predictor of fibrosis regression.
The higher the grade of fibrosis before treatment was, the easier was the improvement of fibrosis after antiviral treatment.
Changes of the indicators correlated with fibrosis improvement
Multivariate analysis was conducted using the changes of clinical indicators before and after antiviral treatment to identify the factors related to fibrosis improvement (Table 5).
Table 5
Multivariate analysis of the correlation between the changes in the detection indicators before and after antiviral treatment and the improvement of fibrosis
| β | S.E. | Wald | df | P | OR | 95% CI for OR | ||
|---|---|---|---|---|---|---|---|---|
| Lower | Upper | |||||||
| TC DIFF | 1.157 | 0.556 | 4.333 | 1 | 0.037 | 3.182 | 1.07 | 9.463 |
| HDL DIFF | –4.369 | 1.846 | 5.604 | 1 | 0.018 | 0.013 | 0 | 0.472 |
| ITAC DIFF | 0.007 | 0.003 | 4.911 | 1 | 0.027 | 1.007 | 1.001 | 1.014 |
| Constant | –0.936 | 0.403 | 5.387 | 1 | 0.02 | 0.392 | ||
Multivariate analysis showed that ΔTC, ΔHDL (high-density lipoprotein) and ΔITAC were significantly associated with fibrosis improvement.
After the treatment, the higher levels of cholesterol (CHO) and ITAC, as well as lower HDL, suggested easy fibrosis improvement.
Construction of a new model for the prediction of fibrosis improvement
Backward logistic regression analysis was performed, and a new fibrosis regression model was established with baseline fibrosis stage, A2M and HP and change of HDL, CHO, percentage of monocytes (MOMO) and ITAC at week 78 from baseline (Table 6).
Table 6
Baseline data and changes before and after antiviral therapy to construct predictive model fitting for liver fibrosis improvement
logit P = 1/[1 + exp(2.562-0.365 × baseline fibrosis-0.292 × baseline A2M + 0.622 × baseline HP + 0.918 × HDL DIFF-0.955 × CHO DIFF + 0.228 × MOMO DIFF-0.675 × ITAC DIFF)]
The prediction accuracy of the model was 81.7% (Table 7).
Evaluation and comparison of noninvasive models
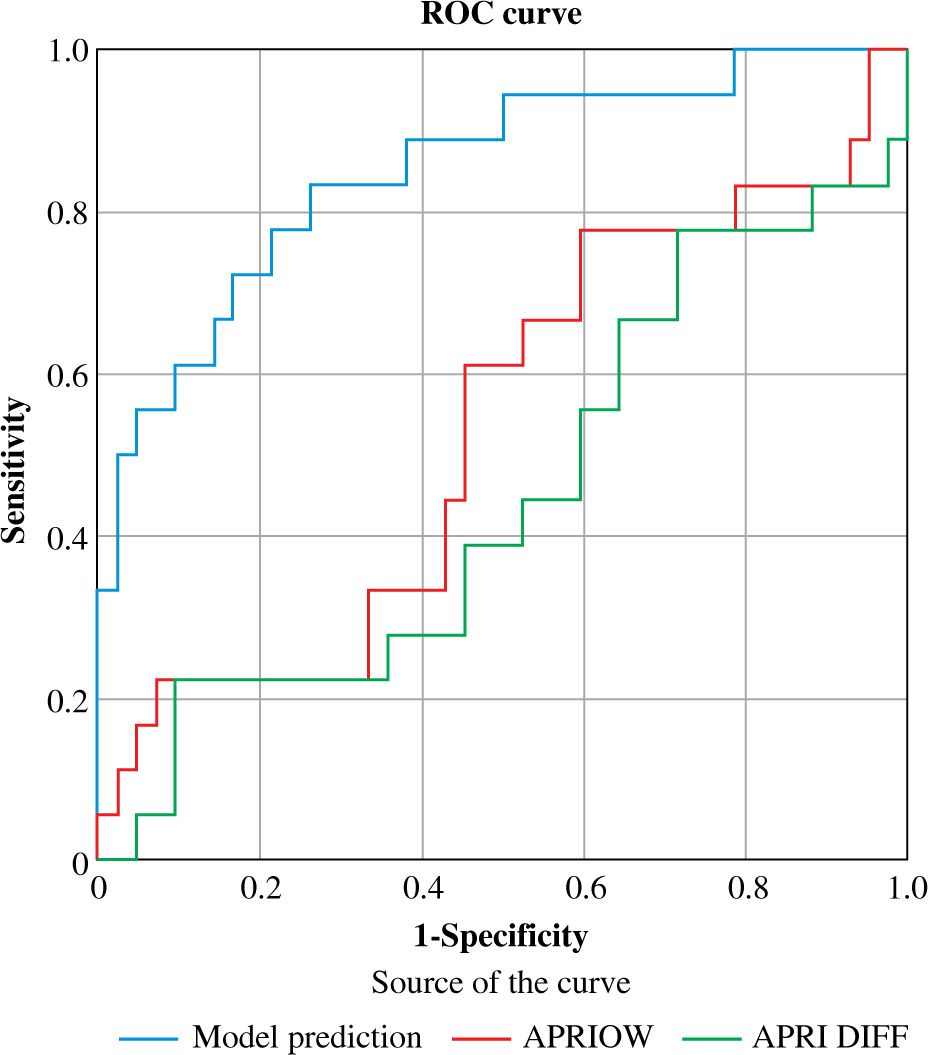
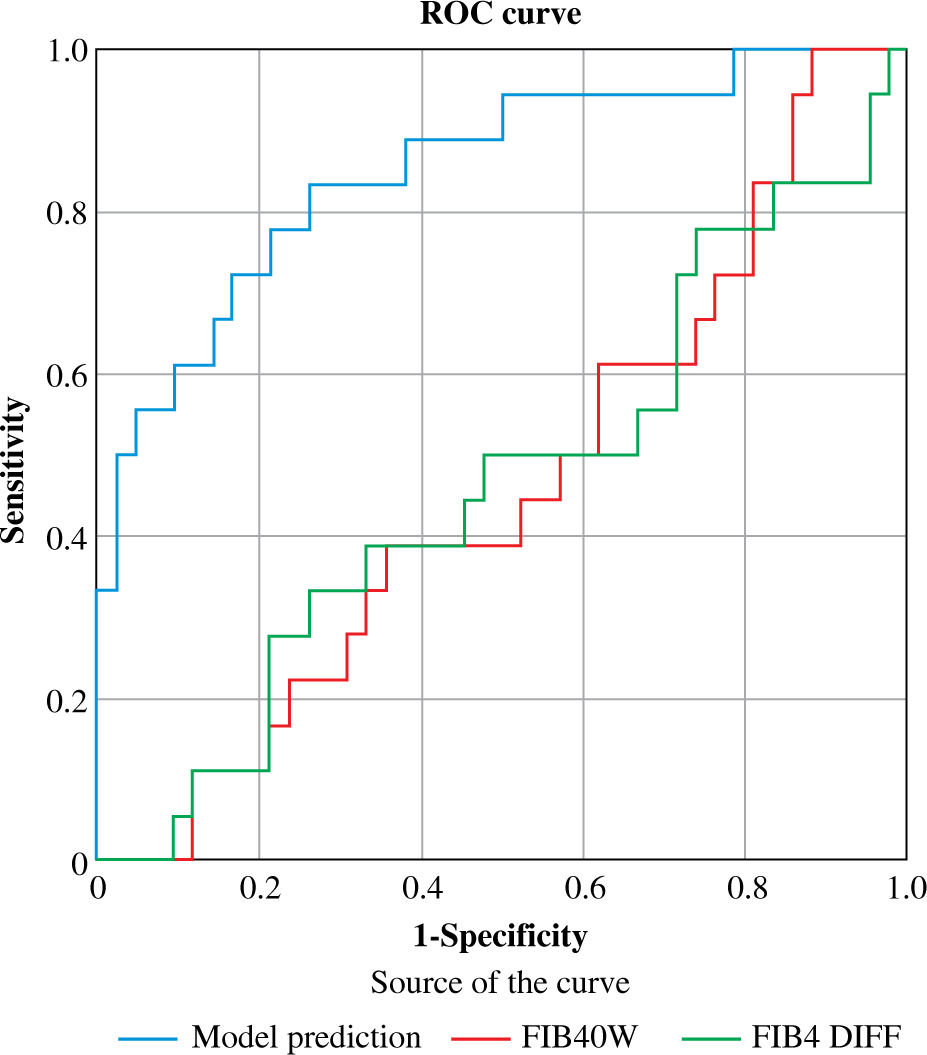
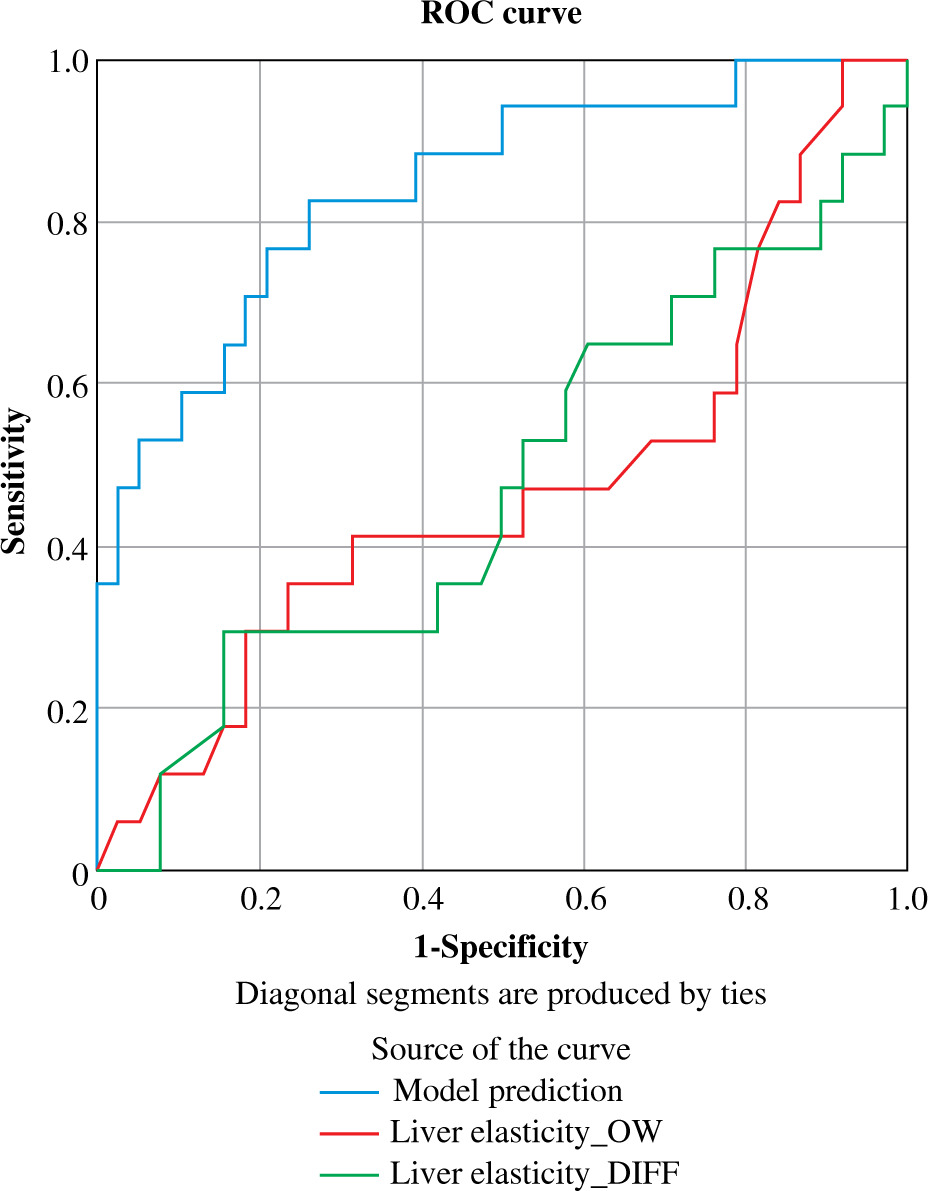
Compared to the existing non-invasive assessments, the new model (AUC = 0.852 (95% CI: 0.736, 0.930)) was superior to APRI (AUC = 0.55 (95% CI: 0.432, 0.632)), ΔAPRI (AUC = 0.569 (95% CI: 0.451, 0.681)), FIB-4 (AUC = 0.503 (95% CI: 0.387, 0.684)), ΔFIB-4 (AUC = 0.571 (95% CI: 0.454, 0.619)), LSM (AUC = 0.520 (95% CI: 0.402, 0.637)), and ΔLSM (AUC = 0.515 (95% CI: 0.392, 0.636)), for predicting fibrosis regression (Table 8, Figs. 1-3).
Table 8
Comparison of predictive performance of predictive models with other indicators
Fig. 1
Comparison of model and 0-week APRI, APRI preand post-antiviral changes in predicting efficacy of fibrosis prognosis
Discussion
This study was a multicenter, randomized, double-blinded, prospective study with treatment-naive CHB patients, which was designed to explore a novel model for improvement of liver fibrosis based on baseline data and dynamic changes before and after antiviral therapy.
Hepatitis B is a high-incidence infectious disease in China. With the changes in life and diet in recent years, the incidence of hepatitis B has gradually increased. The disease is a tissue lesion induced by HBV after invading the liver tissue of the body. Timely treatment leads to a long-term high inflammation state of liver tissue, which will induce hepatitis B cirrhosis [24]. At present, there are mainly two types of antiviral drugs for the treatment of CHB. One is interferon, which is divided into ordinary interferon α and long-acting interferon; the latter includes polyethylene glycol (PEG) interferon α-2a and polyethylene glycol alcohol (PEC) interferon α-2b [25]; another type is nucleoside (acid) analogs, such as ETV and telbivudine. A number of clinical studies have demonstrated that ETV antiviral therapy can delay disease progression, improve liver function, correct decompensation, and improve survival. After the use of nucleoside antiviral drugs, a phosphorylation reaction can occur in the body, which gradually converts them into phosphorylated nucleoside analogs to target and inhibit the activity of HBV [26, 27]. ETV is a new generation of anti-HBV replication drugs. It has a fast onset of action after oral administration, and can rapidly inhibit the replication of HBV in a short period of time [28-30]. With the prolongation of treatment time, it can have a sustained inhibitory effect on HBV. ETV is an antiviral drug with the strongest antiviral ability and the lowest incidence of drug resistance among the first-line nucleotide analogs. Fibrosis regression or virological response and complete response, the effect is more obvious, and there are few adverse drug reactions, so it is recommended as the first choice for anti-hepatitis virus [31-34]. In terms of anti-HBV, the indications for the use of ETV and other antiviral drugs are generally based on two points: active HBV replication, positive HBe Ag and HBV-DNA, and inflammatory changes in liver tissue [35]. The former can be understood through routine blood tests, while the most direct and reliable way for the latter is undoubtedly a needle biopsy [36].
Various non-invasive diagnostic models for diagnosing liver fibrosis have been reported by domestic and foreign experts. Hepatitis B cirrhosis antiviral and anti-fibrosis therapy can significantly improve the liver function of patients and delay the progression of liver fibrosis, and the clinical efficacy is satisfactory. Unfortunately, most of the research objects of these models are CHC and ALD patients, so these models are not suitable for CHB patients, and the obtained results are not necessarily accurate [37, 38]. Therefore, in this study, a non-invasive serological diagnostic model was constructed by collecting common clinical serological indicators and using statistical methods, in order to provide a simple, practical and accurate new method for the diagnosis of hepatitis B fibrosis in this region. For patients who are reluctant to undergo liver biopsy, our model may serve as an important alternative for some patients.
Due to the limited conditions of this research, the levels of particular cytokines involved in inflammation and fibrosis were not checked, and the visualization of fibrosis before and after antiviral treatment and the level of pro- inflammatory interleukins were lacking, which were the limitations of the present study.
In conclusion, ARFI, FIB-4, and APRI have high consistency with the grading of liver fibrosis, and can be used to evaluate the severity of liver fibrosis. Among them, ARFI has good diagnostic value for the classification of different degrees of liver fibrosis, and the best diagnostic accuracy.