Purpose
In image-guided adaptive brachytherapy (IGABT) for cervical cancer, inconsistent applicator positions, and movement of organs at risk (OARs) cause both inter- and intrafraction variation in dose conformation between each brachytherapy (BT) fraction [1,2,3,4,5,6,7,8], which may affect toxicity prediction. The International Commission on Radiation Units and Measurements (ICRU) 89 mentioned the potential dose volume parameter called “isodose surface volume (ISV)” as the volume encompassed by clinically relevant equi-effective dose (EQD2) levels of combined external beam radiation therapy (EBRT) and BT doses [9]. The ISV includes not only the radiation target but also the mobile OARs, thus raising the probability of predicting OAR toxicity. In a retrospective series of 642 cervical cancer cases, a dose volume defined by the half product of height, width, and thickness (HWT), demonstrated significant correlations with rectal and soft tissue complications [10]. Total reference air kerma (TRAK), on which ISVs are based, was shown to correlate with morbidity [11,12]. For ISV, a large retrospective study of 1,253 patients failed to demonstrate any correlation between 60 and 160 Gy ISVs and tumor control [13]. The relationship between ISV and toxicity has not been studied.
In the present study, the outside target volume dose or excess dose are originally proposed as the novel toxicity predictor. Since the excess dose includes only the space in which OAR may be located and moved, contrary to ISVs, of which the volume covers both target and OARs. Excess dose-related parameters are proposed to be more specific to OAR toxicity than ISV. Furthermore, spatial consideration of excess dose concept may compensate for the uncertainty of identical small-volume assumptions of dose-volume histogram parameters, e.g. D2cc and D0.1cc, from inconsistent applicator and OAR alignment.
In this study, excess dose volume (Vex) and its derivatives, including excess dose volume ratio (Rex) and indirect excess dose volume ratio (iRex) were proposed. Correlations between late gastrointestinal (GI) and genitourinary (GU) toxicity and these excess dose-related parameters were investigated as late toxicity predictors.
Material and methods
The study was approved by the Institutional Review Board, protocol number 713/2560 (EC1).
Patient selection, treatment procedure, and clinical evaluation
A retrospective review was performed on all cervical cancer patients receiving radical three-dimensional conformal radiotherapy (3D-CRT) with or without chemotherapy (CMT) between January 2012 and December 2015. Treatment was delivered in accordance with the Gynaecologic Groupe Européen de Curiethérapie-European Society for Radiation Oncology (GEC-ESTRO) recommendations [14,15], using high-dose-rate image-guided adaptive brachytherapy (HDR-IGABT). In cases of central shielding, parametrial or pelvic lymph node boosts, or re-irradiation, patients were excluded due to interference with ISV dose calculation as well as those patients with a follow-up time less than 6 months or incomplete data.
IGABT was guided with computer tomography (CT) or magnetic resonance imaging (MRI). In every BT fraction, after catheterization, the bladder was filled with 50 ml of contrast solution and rectal deflation using a rectal catheter was performed, while applicators were inserted and removed after radiation delivery.
Patient characteristics, imaging modalities, intracavitary (IC) with or without interstitial (IS) applicators, and dose parameters, including maximum dose to 2 cc of OARs (D2cc) were recorded. Late GI and GU toxicities were graded according to the Common Terminology Criteria for Adverse Events (CTCAE) version 5.0 [16]. Patients were classified into 0-1 and 2-4 grades of GI and GU late toxicities occurring six months or more after completion of the treatment. Lower GI toxicity included hemorrhage, proctitis, colitis, GI tract fistula, and perforation, and GU toxicities consisted of hematuria, cystitis, and GU fistula.
Excess dose volume (Vex) and toxicity negligible volume (Vneg)
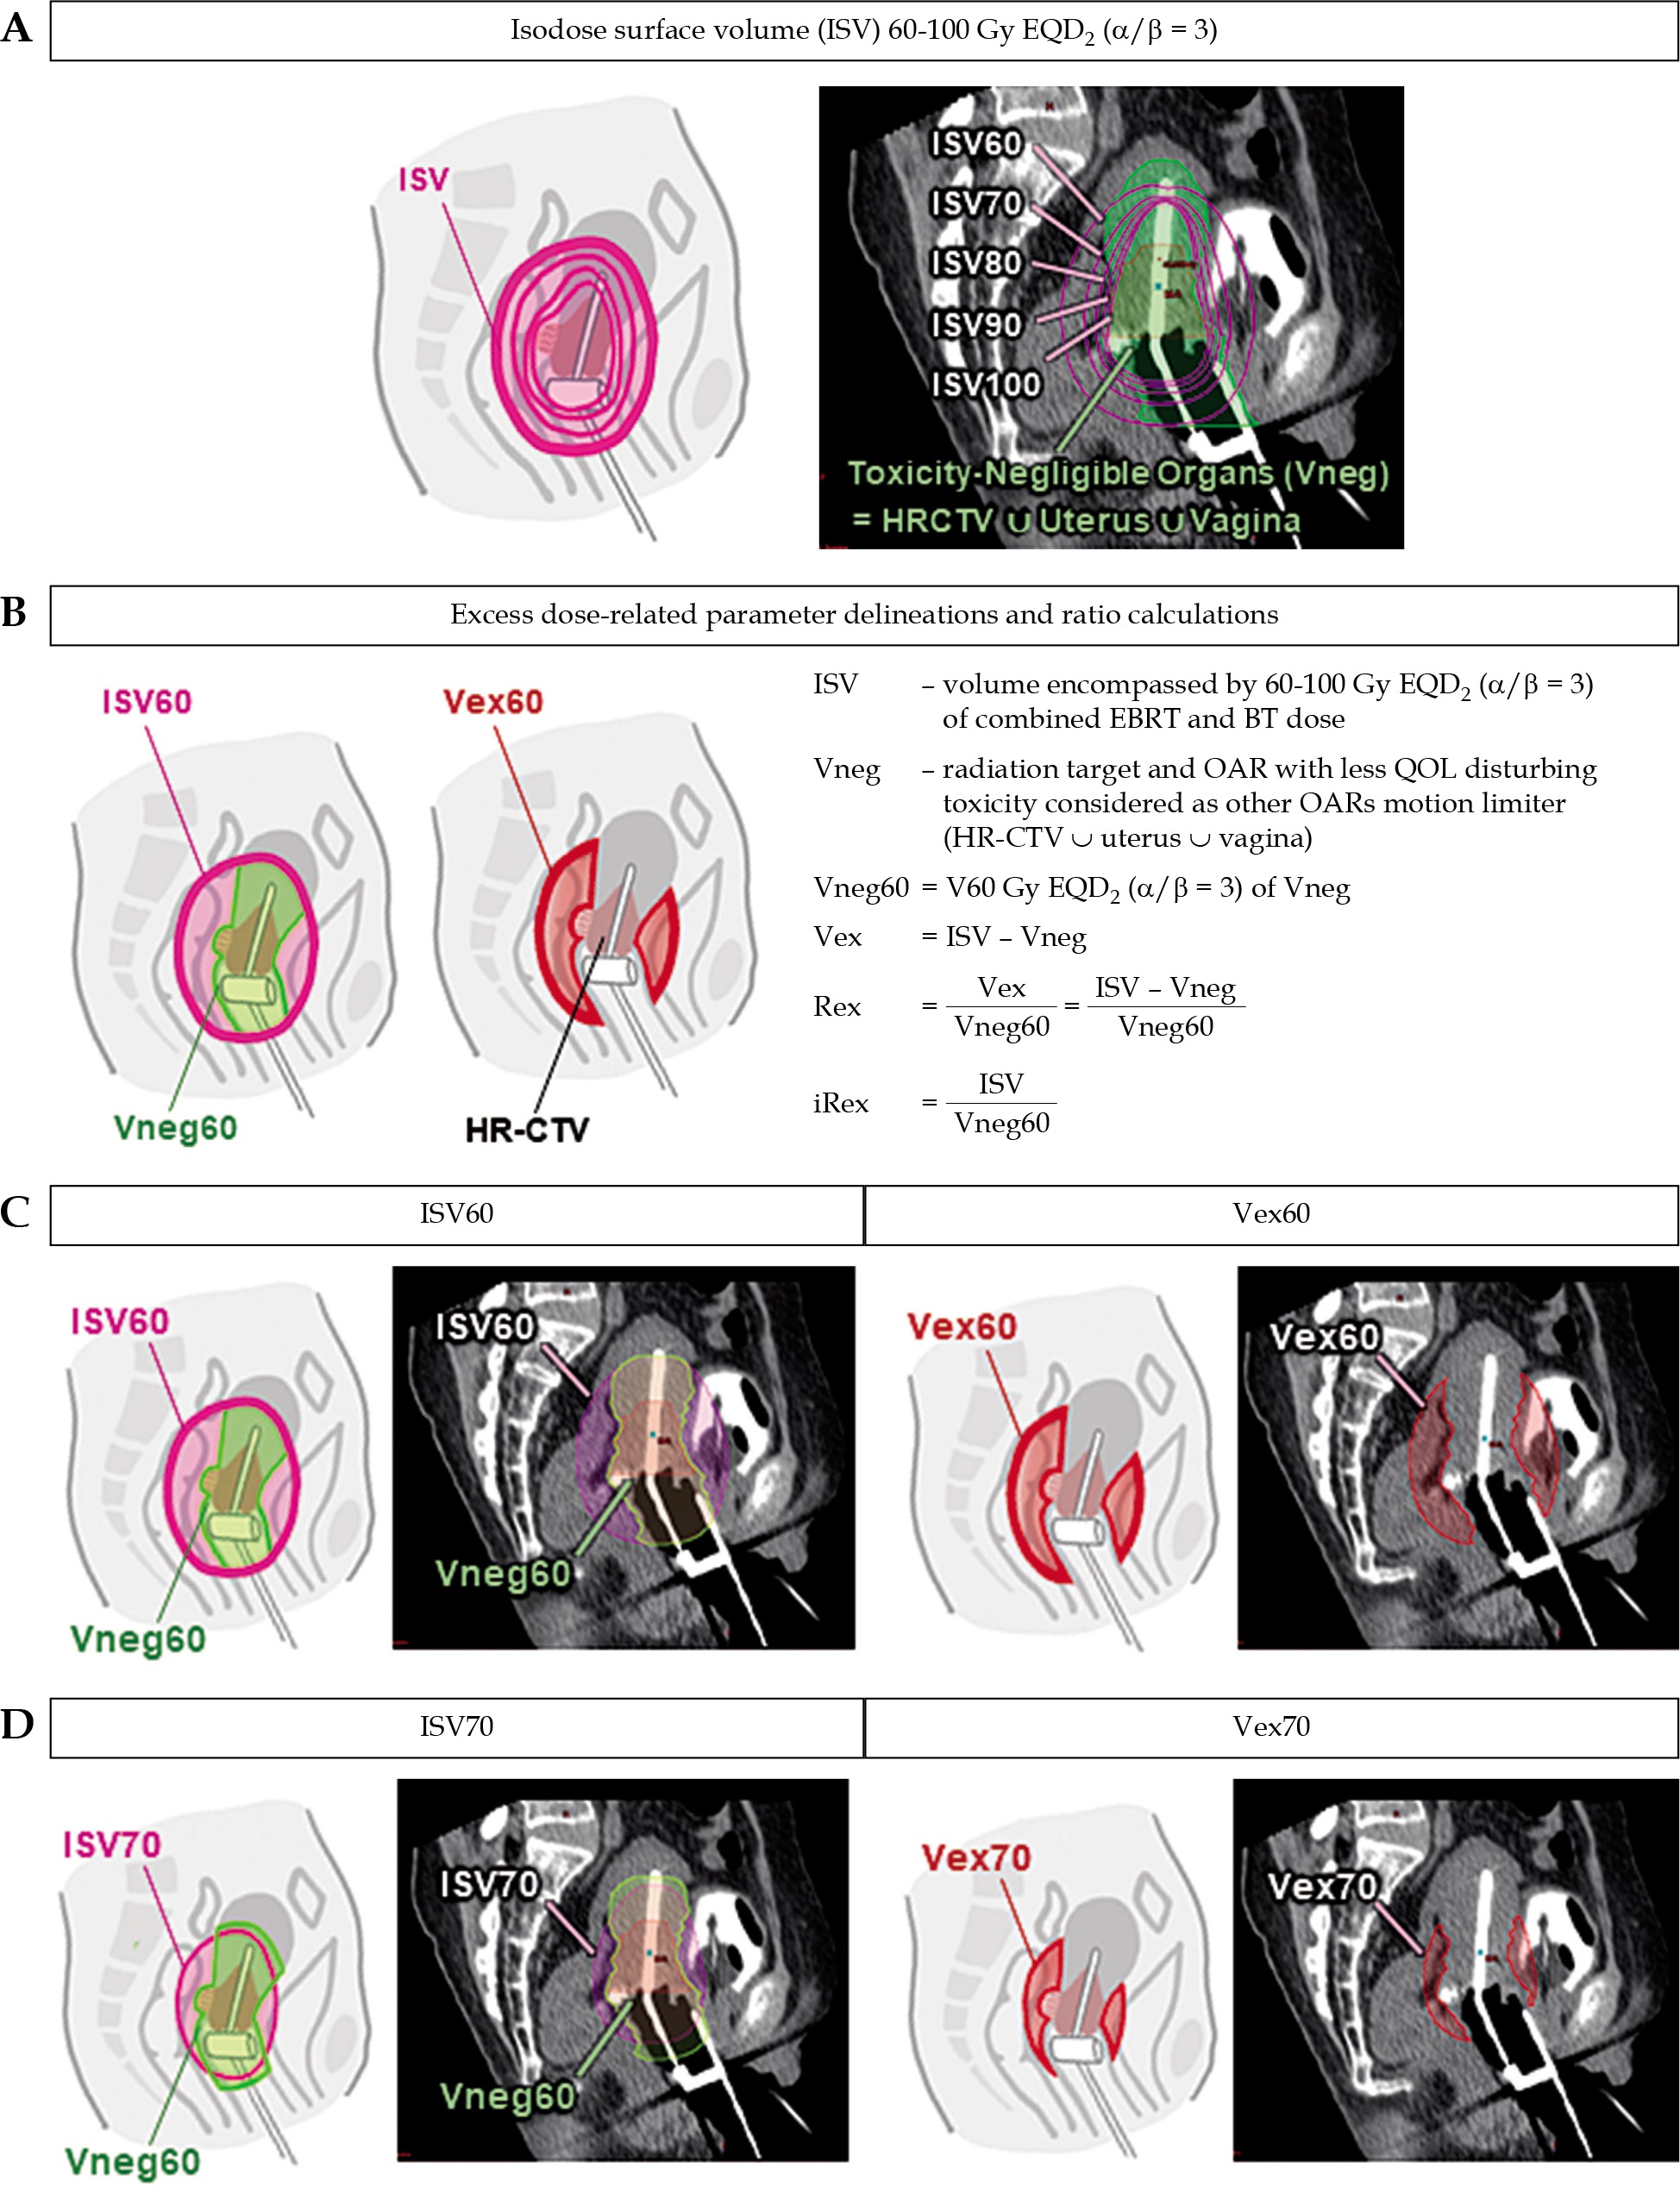
Excess dose volume (Vex = ISV – Vneg) was defined as ISV with the toxicity negligible volume (Vneg) subtraction. Vneg describes the radiation target and the close-to-applicator normal organs, which have less impact on quality of life. By hindering the applicator, Vneg was also considered as an OAR motion limiter, since it is located close to the applicators and reflects blockage of OARs motion toward the radiation source, sparing OARs irradiation.
Excess dose volume ratio (Rex) and indirect excess dose volume ratio (iRex)
Absolute values of ISV and Vex would not reflect identical free space in each individual patient. Even with equal absolute values, ISVs and Vexs differ between each individual, due to different dose distributions and variation in the size of individual tumors and pelvic organs, which constitute Vneg. The individually varied conformations of ISV or Vex demonstrate unevenly covered OARs, leading to unequal toxicity correlations as described in Supplementary material. Hence, ISVs and Vexs would not alone be accurate, unless compared to Vneg. Excess dose volume ratio (Rex) and indirect excess dose volume ratio (iRex) were therefore proposed as the parameters, which should be normalized with Vneg and would compensate for conformationally omitted absolute values of ISV and Vex.
Rex, defined as Vex/Vneg = (ISV – Vneg)/Vneg, normalizes values for Vex between each individual. Vex and Rex have the advantage of directly reflecting the permitted space for OAR motion, but subtracted volumes and ratios of Vex and Rex were not yet supported by the automatic optimization with current treatment planning systems (TPS). iRex, derived from ISV/Vneg, was an alternative parameter of Rex, and was obtainable from automatic optimization in current TPSs. iRex was therefore favored as a potential excess dose-related parameter.
Proposed parameter delineation and calculation in each BT fraction
Each of the novel parameters were generated as follows:
ISVs were transformed from isodose lines of absorbed doses corresponding to total EQD2 (a/β = 3) of 60, 70, 80, 90, and 100 Gy from the combined EBRT and BT dose, for example, absorbed dose of 2.34 Gy for one fraction corresponded to a total EQD2 (a/β = 3) of 60 Gy (Supplementary material). Vneg was constituted from high-risk clinical target volume (HR-CTV) and the toxicity negligible organs, such as uterus and vagina. Uterine and vaginal toxicities were considered negligible in this study, compared to bowel and bladder toxicities. Delineation of toxicity negligible organs included HR-CTV, uterus up to fundus, and vagina downward below lower border of generated ISV60s. Vneg60 was defined as volume of Vneg exposed to 60 Gy EQD2 (a/β = 3) and was used in Vex delineation as well as in Rex and iRex calculations.
Vex (= ISV60, …, 100 – Vneg60) was generated by subtracting Vneg60 from each corresponding dose of ISV.
Each Rex (= Vex60, …, 100/Vneg60) was calculated by dividing corresponding Vex with Vneg60, and similarly, ISV was divided by Vneg60 for iRex (= ISV60, …, 100/Vneg60).
Delineations and ratio calculations are summarized in Figure 1.
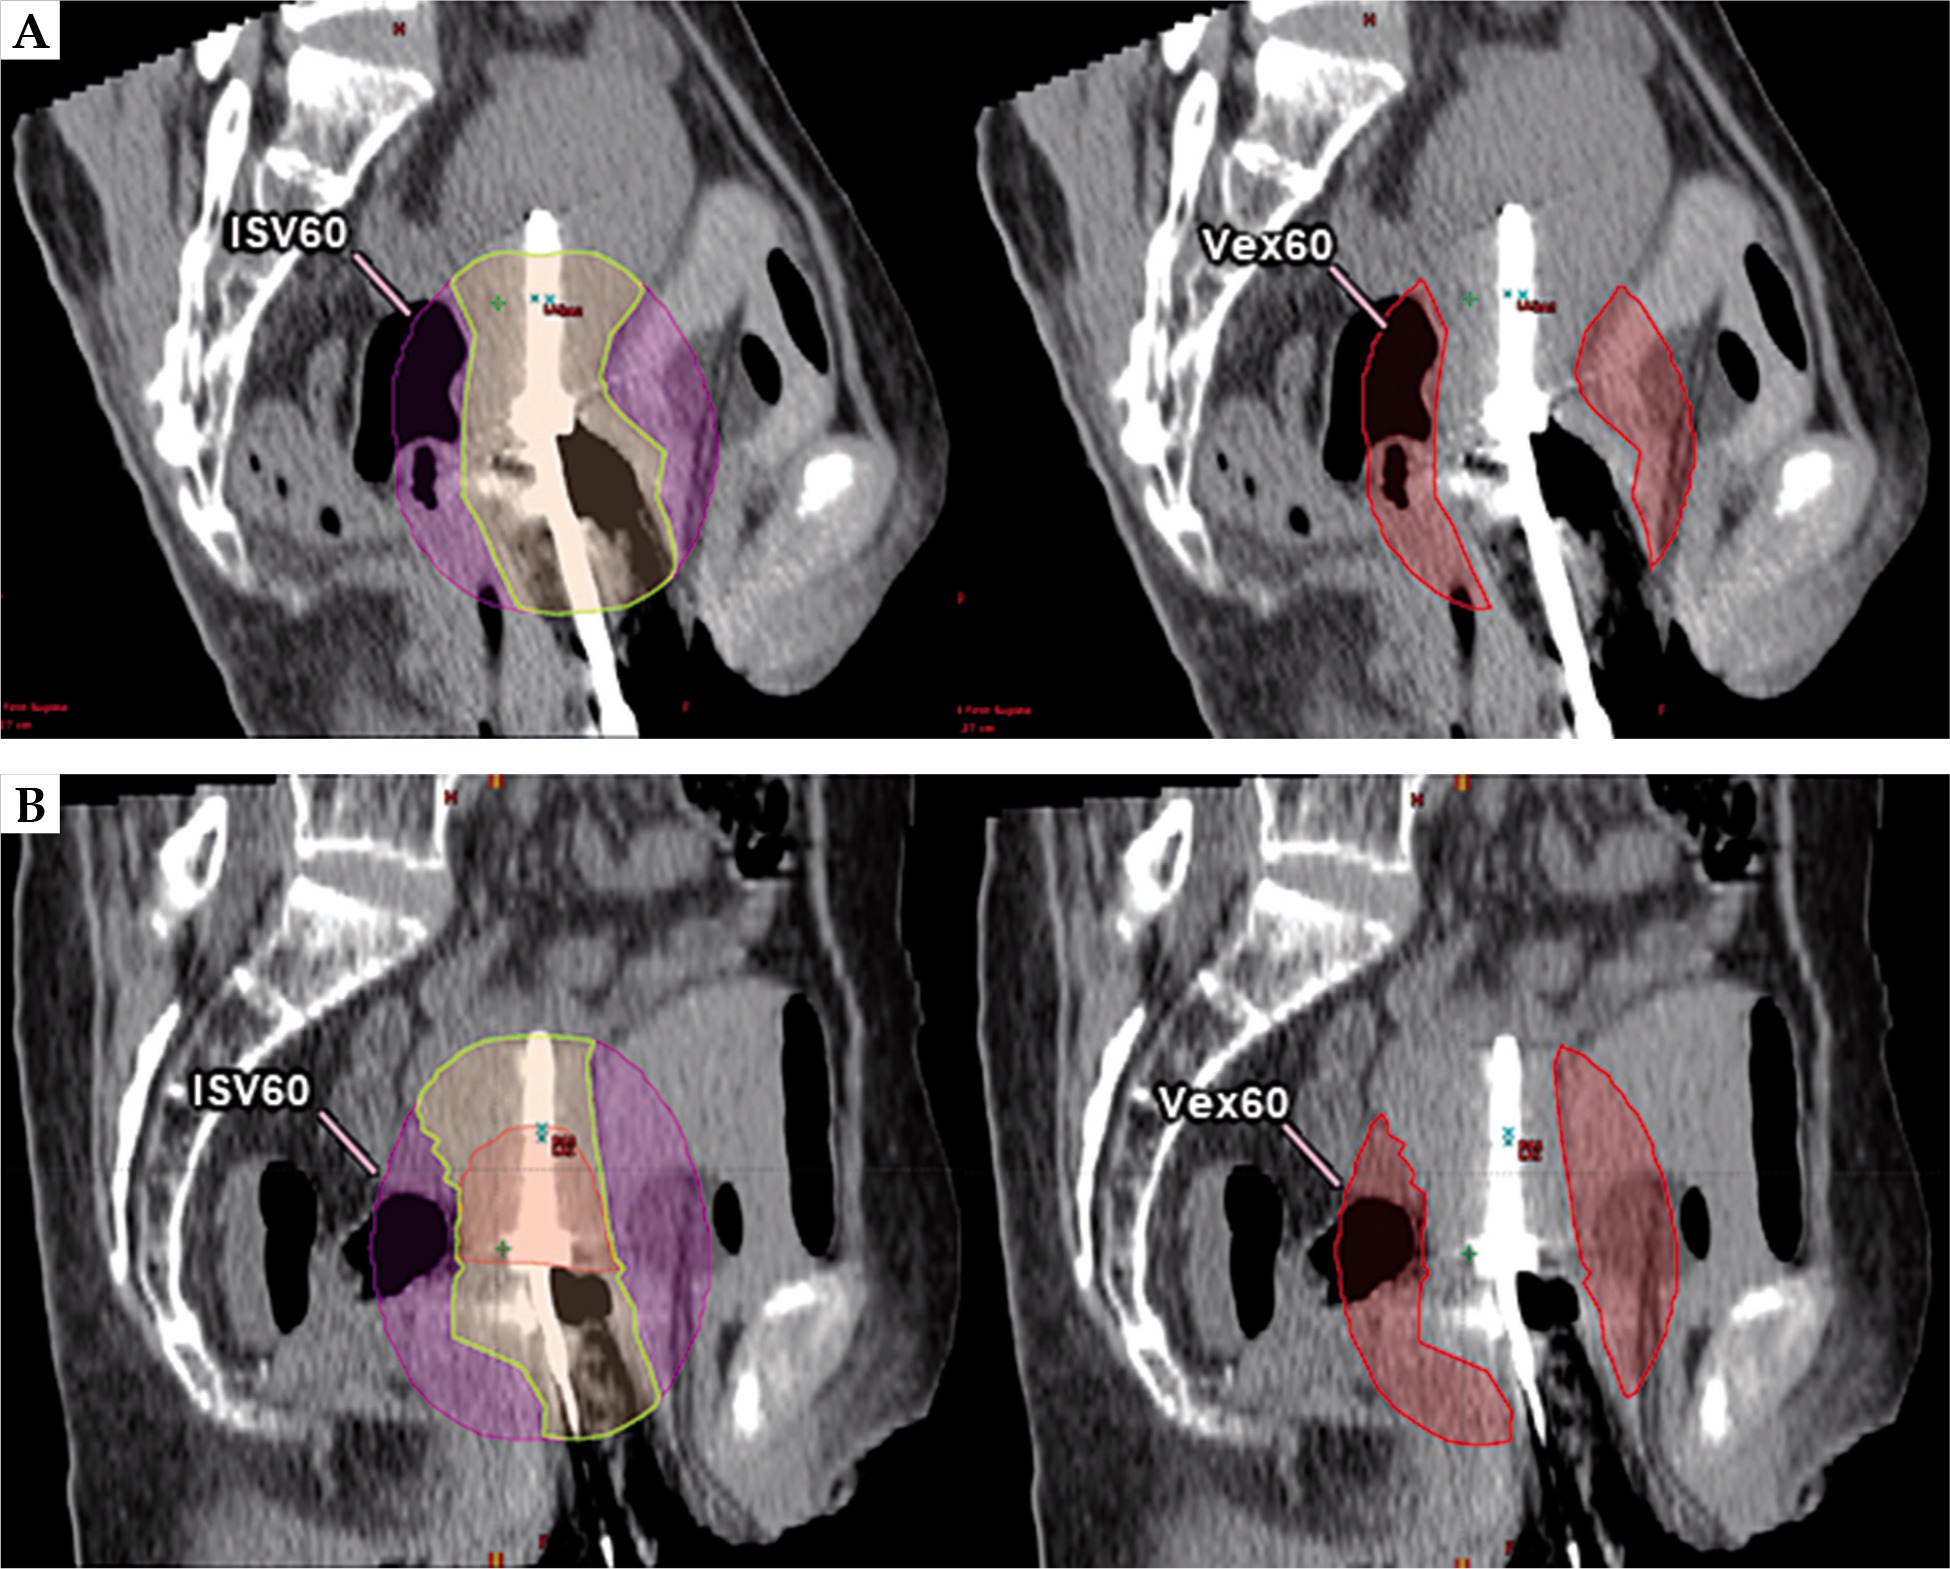
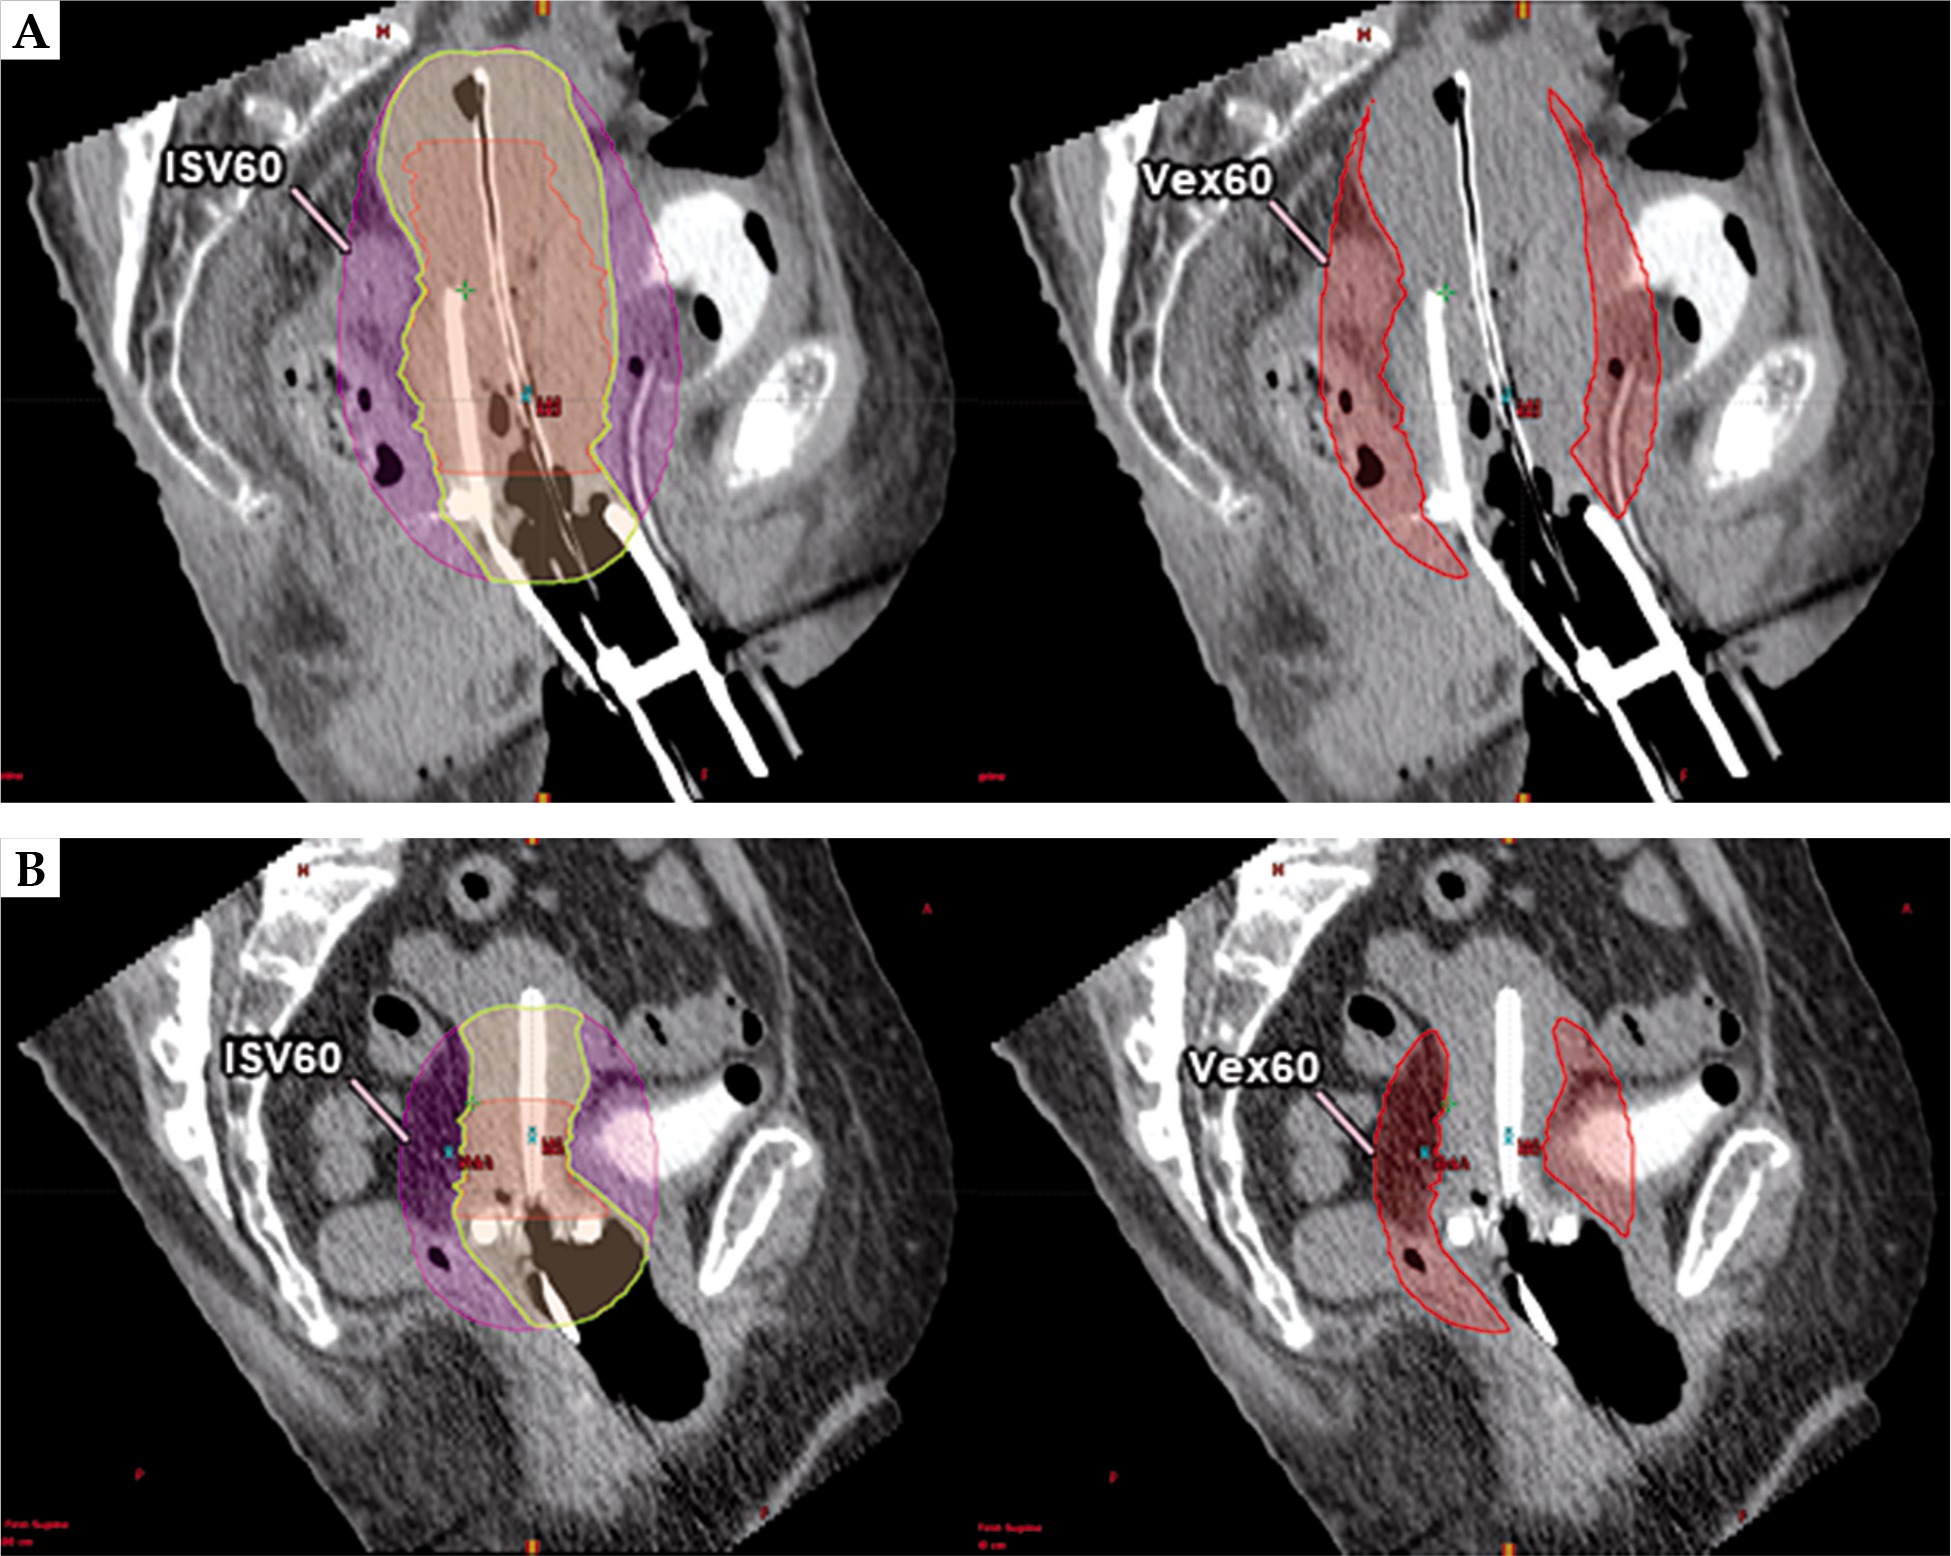
Fig. 1
A) Isodose surface volume (ISV) encompassing organs at risk, delineated in pink lines. Toxicity negligible organs included HR-CTV, uterus, and vagina delineated in the green line. B) Excess dose-related parameter delineations and ratio calculations. C) Depicts ISV60 and Vex60 example. D) Depicts ISV70 and Vex70 example
Vneg – toxicity negligible volume, Vex – excess dose volume, Rex – excess dose volume ratio, iRex – indirect excess dose volume ratio, ISV60 – isodose surface volume of 60 Gy EQD2, Vex60 – excess dose volume of 60 Gy EQD2, QOL – quality of life
Toxicity – novel parameter correlation analysis and statistical method
Mean ISV, Vex, Rex, and iRex data for every patient were calculated for each of the prescribed 3-5 fractions. Relationships between toxicity and novel parameters were analyzed for mean difference, and probit analysis was performed using PASW statistics, version 18.0.0. Mathematical means of these mean values were compared between grade 0-1 and 2-4 toxicities, using Mann-Whitney test. The dose-response relationship between means of parameters and grade 2-4 toxicities was analyzed with probit analysis.
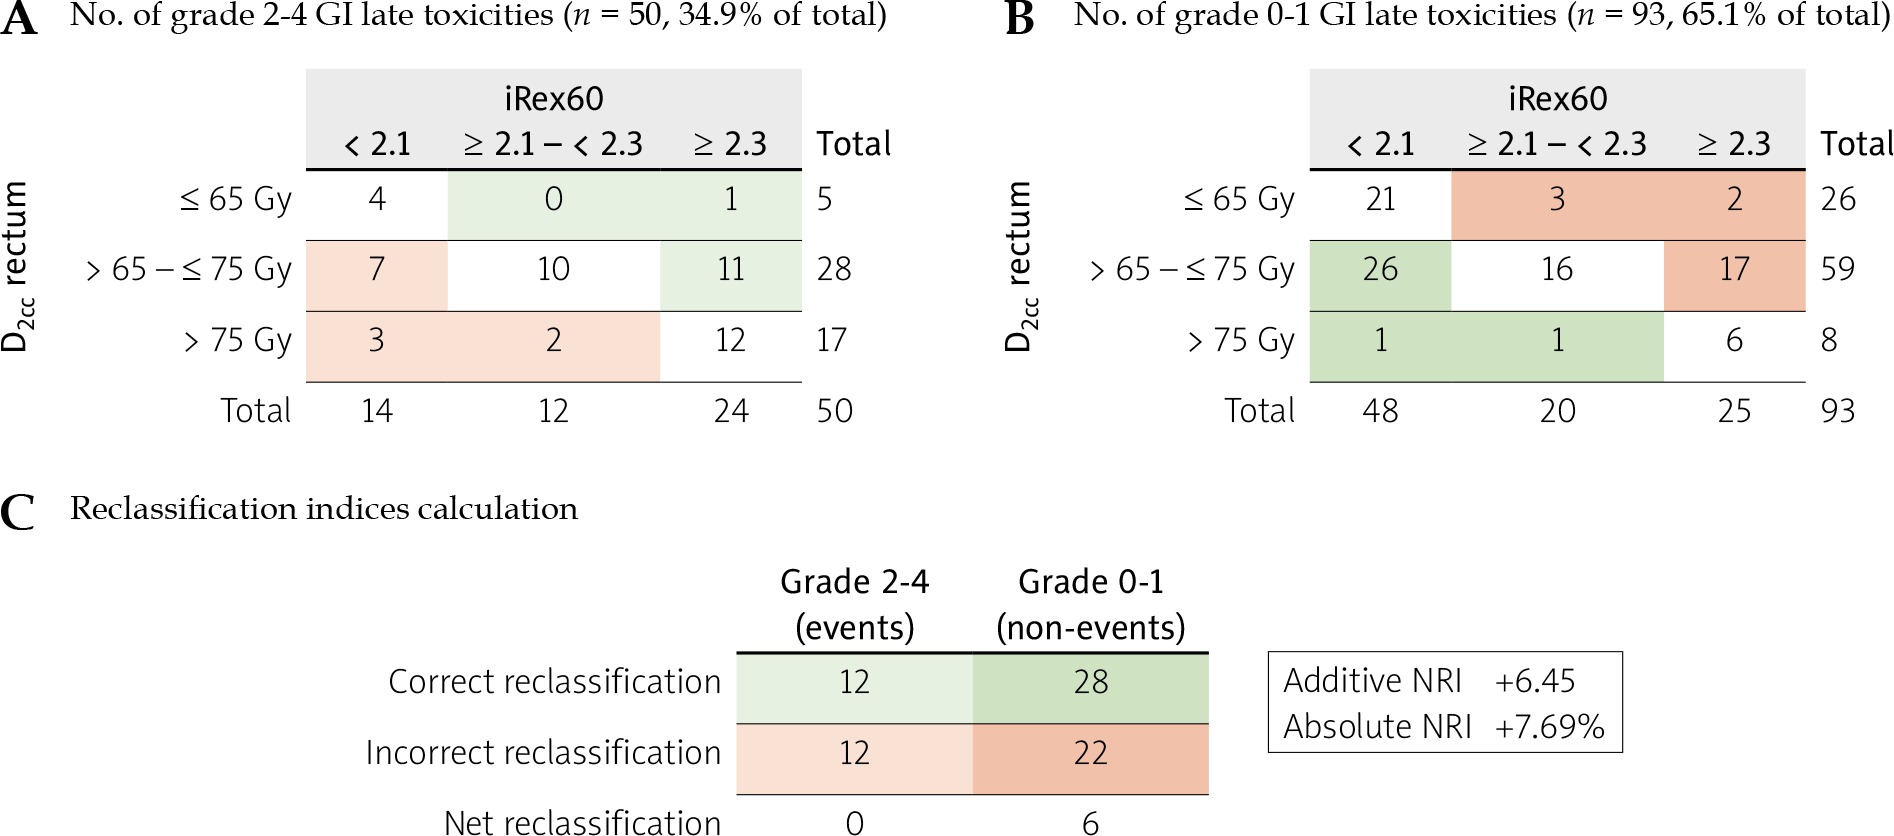
iRex60 vs. D2ccGI toxicity prediction reclassification analysis
Net reclassification indices (NRI) [17] were used to compare iRex60 and D2cc GI toxicity prediction. An effective dose for 10% and 15% toxicity probability (ED10 and ED15) cut points of 2.1 and 2.3 from the iRex60 probit result were used, while D2cc values of 65 and 75 Gy for rectum were selected as defined in the image-guided intensity-modulated external beam radiochemotherapy and MRI-based adaptive BRAchytherapy in locally advanced CErvical cancer (EMBRACE II) protocol [18,19].
Results
A total of 143 cases from 364 cervical cancer patients treated over the study period were reviewed. 221 cases were excluded due to central shielding (n = 92), parametrial and pelvic lymph nodal boost (n = 104), pelvic re-irradiation (n = 2), and follow-up time less than 6 months or incomplete data (n = 23). Median follow-up time was 37 (range, 6-70) months. Patient characteristics and DVH parameters are presented in Table 1.
Table 1
Patient characteristics (median follow-up time, 37 months)
For BT, imaging modalities were classified into MRI-based and CT-based BT. MRI-based BT included patients who underwent MRI for every fraction (MR alone) or MRI for only first fraction of BT (MR first fraction), which accounted for 42 (29.4%) patients. CT-based BT included patients who underwent only CT for every fraction (CT alone) with or without fusion of pre-brachytherapy MRI (MR pre-BT), which occurred in 101 (70.6%) patients. IC applicators were used for 84 (58.7%) patients and in combination with IS for 59 (41.3%) patients.
The total number of grade 2-4 late GI toxicities was 50 (34.9%), while late GU toxicities was 15 (10.5%). The total number of grade 3-4 late GI toxicities was 19 (13.3%), while late GU toxicities was 5 (3.5%). All 19 cases of grade 3 and 4 late GI toxicities were confirmed with endoscopic examination, and included 12 rectal, 3 rectosigmoid, 2 anorectal, and 1 case of both sigmoid and rectal telangiectasia. The remaining patient developed a grade 3 rectal ulcer with anal telangiectasia at 1 year after the treatment, followed by a grade 4 jejunal perforation, 5 years after the treatment.
The mathematical mean of mean Vex, Rex, and iRex for each patient demonstrated significant differences between grade 0-1 and 2-4 late GI toxicity from 60 to 100 Gy EQD2 (a/β = 3). No significant mean differences were observed for ISV and all late GU toxicities (Figure 2 and Supplementary material).
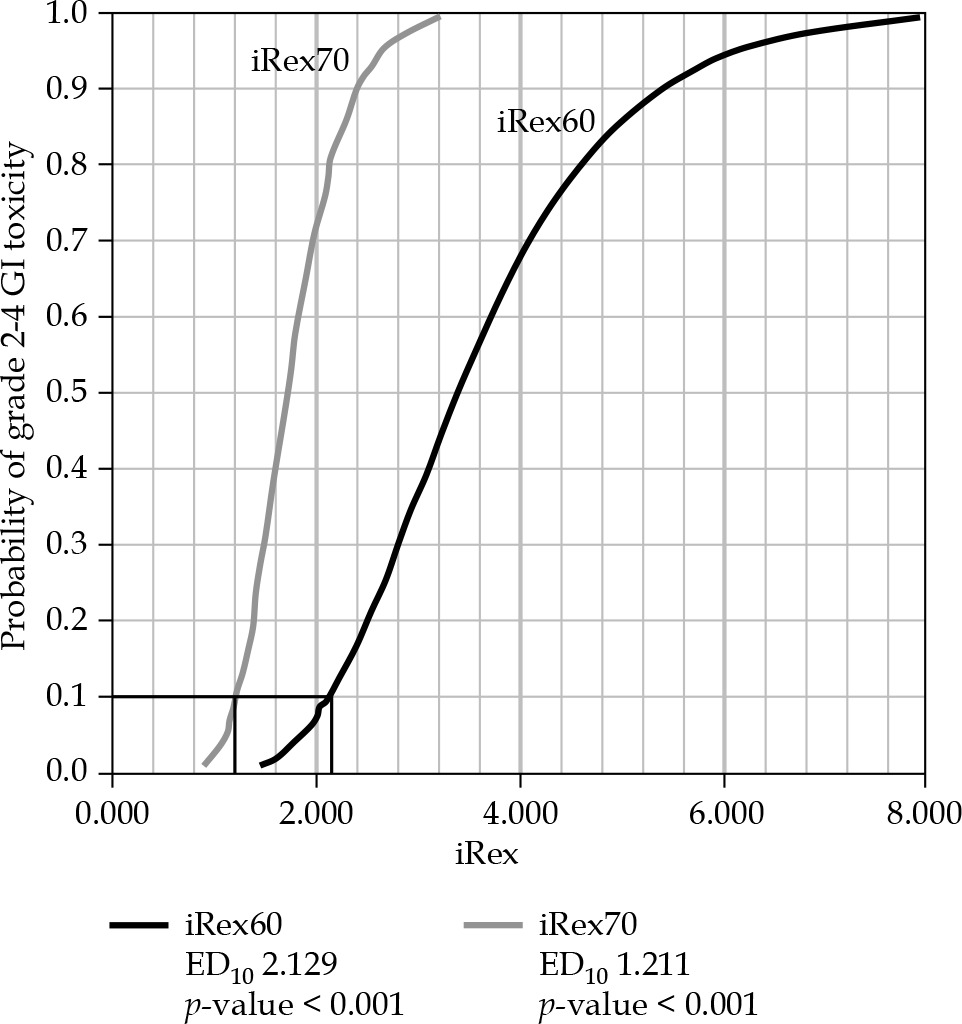
Fig. 2
Boxplots of mean of ISV, Vex, Rex, and iRex according to grade 0-1 and 2-4 GI and GU toxicities

There was a significant correlation with toxicity at each radiation dose for all parameters studied (see Supplementary material). The mean ISV exhibited a significant probit analysis for 70 to 100 Gy EQD2 (a/β = 3) of ISV (ISV70 to ISV100), except for ISV60. The mean Vex showed a significant dose-response relationship with grade 2-4 late GI toxicities for Vex80 and Vex90. The mean Rex demonstrated a significant dose-response relationship with grade 2-4 late GI toxicities for Rex60. The mean iRex exhibited a significant dose-response relationship with grade 2-4 late GI toxicities for iRex60 and iRex70, with an ED10 of 2.129 and 1.211, respectively (Figure 3 and Supplementary material). When comparing iRex60 and D2cc toxicity prediction, additive and absolute NRIs were +6.45 and +7.69%, respectively. The reclassification occurred most strongly in the 65-75 Gy range for the D2cc of rectum (Figure 4).
Discussion
In this study, the discrepantly higher toxicity was observed, comparing to tolerable D2cc doses. As hypothesized, the effect of inconsistent applicator positions and OARs motion may deviate the identical dose-volume assumption of small-volume dose. Excess dose-related parameters, proposed to represent the dose outside the target and to compensate the OAR motion factor, established significant correlations with late GI toxicity only for Vex, Rex, and iRex, but not ISV. No correlation was observed with GU toxicity.
There was no significant correlation between ISV and GI toxicity. In previous studies, which have reported significant correlation [10,11,12], ISV or TRAK and toxicity correlation may have been confused by the dose outside target, not the whole dose volume.
Vex showed a significant relationship with GI toxicity, with a significant dose-response relation at 80-90 Gy. The lack of a dose-response relation for Vex100 resulted from the exceedingly small volumes of Vex100. The absence of toxicity correlation with Vex60 and Vex70 could reflect the uncertainty in toxicity prediction using absolute dose volumes at low doses. At low-dose levels, with larger territory of dose coverage, the distribution of dose is more varied compared to high-dose level. The equal absolute values for low-dose levels of ISV and Vex between each individual fraction could not reflect the different shape and coverage of the OAR outside Vneg. Therefore, the poor correlation with toxicity at low-dose levels was demonstrated by examples included in Supplementary material.
In contrast, for Rex and iRex, the lower dose levels were predictive of toxicity, in particular Rex60 and iRex60-70, comparable to the higher predictive dose levels of ISV and Vex. The low-dose prediction of Rex and iRex emphasizes the normalization effect on Vneg from calculating Rex and iRex, which compensates for the varied conformations of ISV and Vex. Both Rex and iRex demonstrated the same significant correlations between Rex60, iRex60, and iRex70 for late GI toxicity. These results confirm that iRex may be used instead of Rex.
The absence of a relation between GU toxicity and any parameter may be explained by the low number of events (10.5%), compared to GI toxicity events (34.9%).
Excess dose-related parameters could be more accurate as toxicity predictors because they compensate for OAR motion, which is not captured in dose-volume histogram (DVH) parameters. Based on the analysis presented here, Rex and iRex were recommended as having a significant correlation with toxicity in low-dose regions and the Vneg relative properties. Positive NRIs also suggested iRex60 utilization for dose expansion spatial control, in addition to high-dose control with OAR small volumes.
Although, Rex (Rex = Vex/Vneg) directly reflects the excess dose, unfortunately this was not currently derived during the optimization process within a commercial TPS. However, iRex (iRex = ISV/Vneg) as an indirect measure of Rex, was produced by the TPS, and it was therefore proposed that iRex was used until Rex could be produced by the TPS automatically.
A limitation of these conclusions was that the comparison of ISV, Vex, Rex, and iRex with dose to small volumes (D2cc and D0.1cc) in predicting toxicity has not been fully validated. Toxicity measurement was retrospective with inherent inaccuracies. There was a variation in imaging, using both CT and MRI, which would have altered OAR volume accuracy; CT volumes were tending to be larger than those defined by MRI. This study assumed a uniform dose of EBRT. Its validity when a pelvic boost was used, which would interfere with ISV dose calculation should yet be explored. Future studies with multivariate analysis as well as prospective studies and DVH parameter comparison are crucial in further validation and development of these novel toxicity predictors.
Conclusions
Excess dose-related parameters, including Vex, Rex, and iRex, were significantly related to late GI but not GU toxicity. iRex60 is the most suitable parameter, as it can be derived directly from a commercial TPS, with an ED10 of 2.1. Further investigations are needed for robust validation of these toxicity predictors to be used for spatial control of dose expansion in addition to control of high-dose regions by conventional DVH parameters for OAR small volumes, such as D2cc and D0.1cc.