
Purpose
Surface applicator brachytherapy treatment (SABT) planning has long relied on computed tomography (CT) scans to produce visualizations of flap-style applicators [1]. The standard practice in visualizing contrast for SABT planning involves the use of metallic CT markers placed inside flap applicators. However, due to sub-adequate soft tissue contrast in CT scans, it is difficult to determine clinically useful skin anatomy from these scans [1]. Although an accurate visualization of a flap applicator is necessary to produce a clinically acceptable treatment plan, potential lack of tumor visualization can result in a mischaracterization of the depth and size of some lesions that exist just below the surface of the skin. The standard treatment practice for SABT delivers 100% of prescribed dose at a depth of 3 mm for the dose to reach the dermis [2]; however, wide variety of thicknesses of the epidermis can result in sub-optimal dose delivery to diseased tissue. In particular, skin depth can vary based on gender, age, ethnicity, and location on the body (i.e., from 0.077 mm to 0.267 mm in the epidermal region, and from 2.12 mm to 5.89 mm in the dermal region) [2], and this significant variation can potentially lead to sub-optimal patient outcomes. Because a 1 mm error in target localization can result in an error of up to 10% in SABT [3], accurate delivery of dose to tumor volume is of critical importance.
To address insufficient tumor visualization when relying on CT for SABT, a novel approach was proposed: the use of magnetic resonance (MR) instead of CT for producing images for SABT planning [4]. Until recently, an MR-based approach has presented a major challenge in generating a treatment plan due to the poor visualization of surface applicators and catheters using standard MR sequences. However, a prior phantom and volunteer study [4] has demonstrated the possibility of using MR-based planning by imaging flap applicators with a pointwise encoding time reduction with radial acquisition (PETRA) sequence. In this work, we included a 3D-printed phantom of improved geometric accuracy and implemented the method on three Dupuytren’s contracture patients treated with MR-guided SABT.
In order to produce clinically acceptable plans using only MR images, it was necessary to overcome the challenge of poor applicator visualization, and produce an MR sequence that allows imaging of both subcutaneous soft tissue and flap applicators. A PETRA sequence has shown the potential to visualize empty catheters [5] as well as silicon spheres of flap applicators [4] by using its extremely short echo time (TE) despite minor geometric distortions [6, 7]. PETRA images could be sent to brachytherapy treatment planning software (TPS) for catheter digitization and plan creation, and were shown to produce faithful recreations of CT-based catheter reconstructions [5] to justify a transition towards MR-only SABT planning. This methodology has the potential to eliminate CT-based SABT to possibly improve patients’ treatment quality, leading to overall better health outcomes for these patients. By taking advantage of an enhanced soft tissue contrast afforded by MR, diseased tissue and flap applicators can both be visualized and contoured prior to treatment planning. Upon resolving this problem of insufficient applicator contrast, the standard practice of delivering 100% of the prescribed dose at 3 mm depth can be replaced with a treatment plan tailored to individualized needs of a patient.
In this work, we assessed the use of the optimized PETRA sequence in allowing for sufficient catheter visualization in a clinical setting that can produce clinically acceptable SABT plans without relying on CT. This novel methodology has the potential to replace the standard practice of 3 mm treatment depth to deliver a more optimal dose to diseased tissue.
Material and methods
The goal of methodology in this study was to test the procedure using the fixed geometry afforded by the phantom, and to apply the technique in a clinical setting where additional uncertainties are present, including immobilization, patient motion, and interfraction displacements.
Data acquisition
CT and MR imaging was performed using a helical CT (Siemens Medical Solutions, Malvern, PA, USA) and a 3T Siemens Vida (Siemens Medical Solutions, Malvern, PA, USA), respectively. Images of both modalities were collected from a 3D-printed phantom designed for this experiment (Figure 1) and three patients with Dupuytren’s contracture/palmar fascial fibromatosis of the palm. The phantom was designed to tightly fit a Freiburg flap applicator of 31 catheters (Figure 1) in place with the intention of eliminating any possible displacement of the applicator between scans for as accurate CT/MR comparison as possible. The phantom was made of polylactic acid (PLA) and was 3D-printed using an UltiMaker S5 printer (UltiMaker, Utrecht, Germany). A stereolithography file containing a 3D model of the flap applicator was imported into a printer software, and a Boolean subtraction of the 3D model from a solid PLA block was performed to create grooves in the block, into which the applicator could fit.
Fig. 1
A photograph of exterior of the phantom (A), interior of the phantom with embedded flap applicator (B), and CT image of the phantom with surrounding blocks (C)
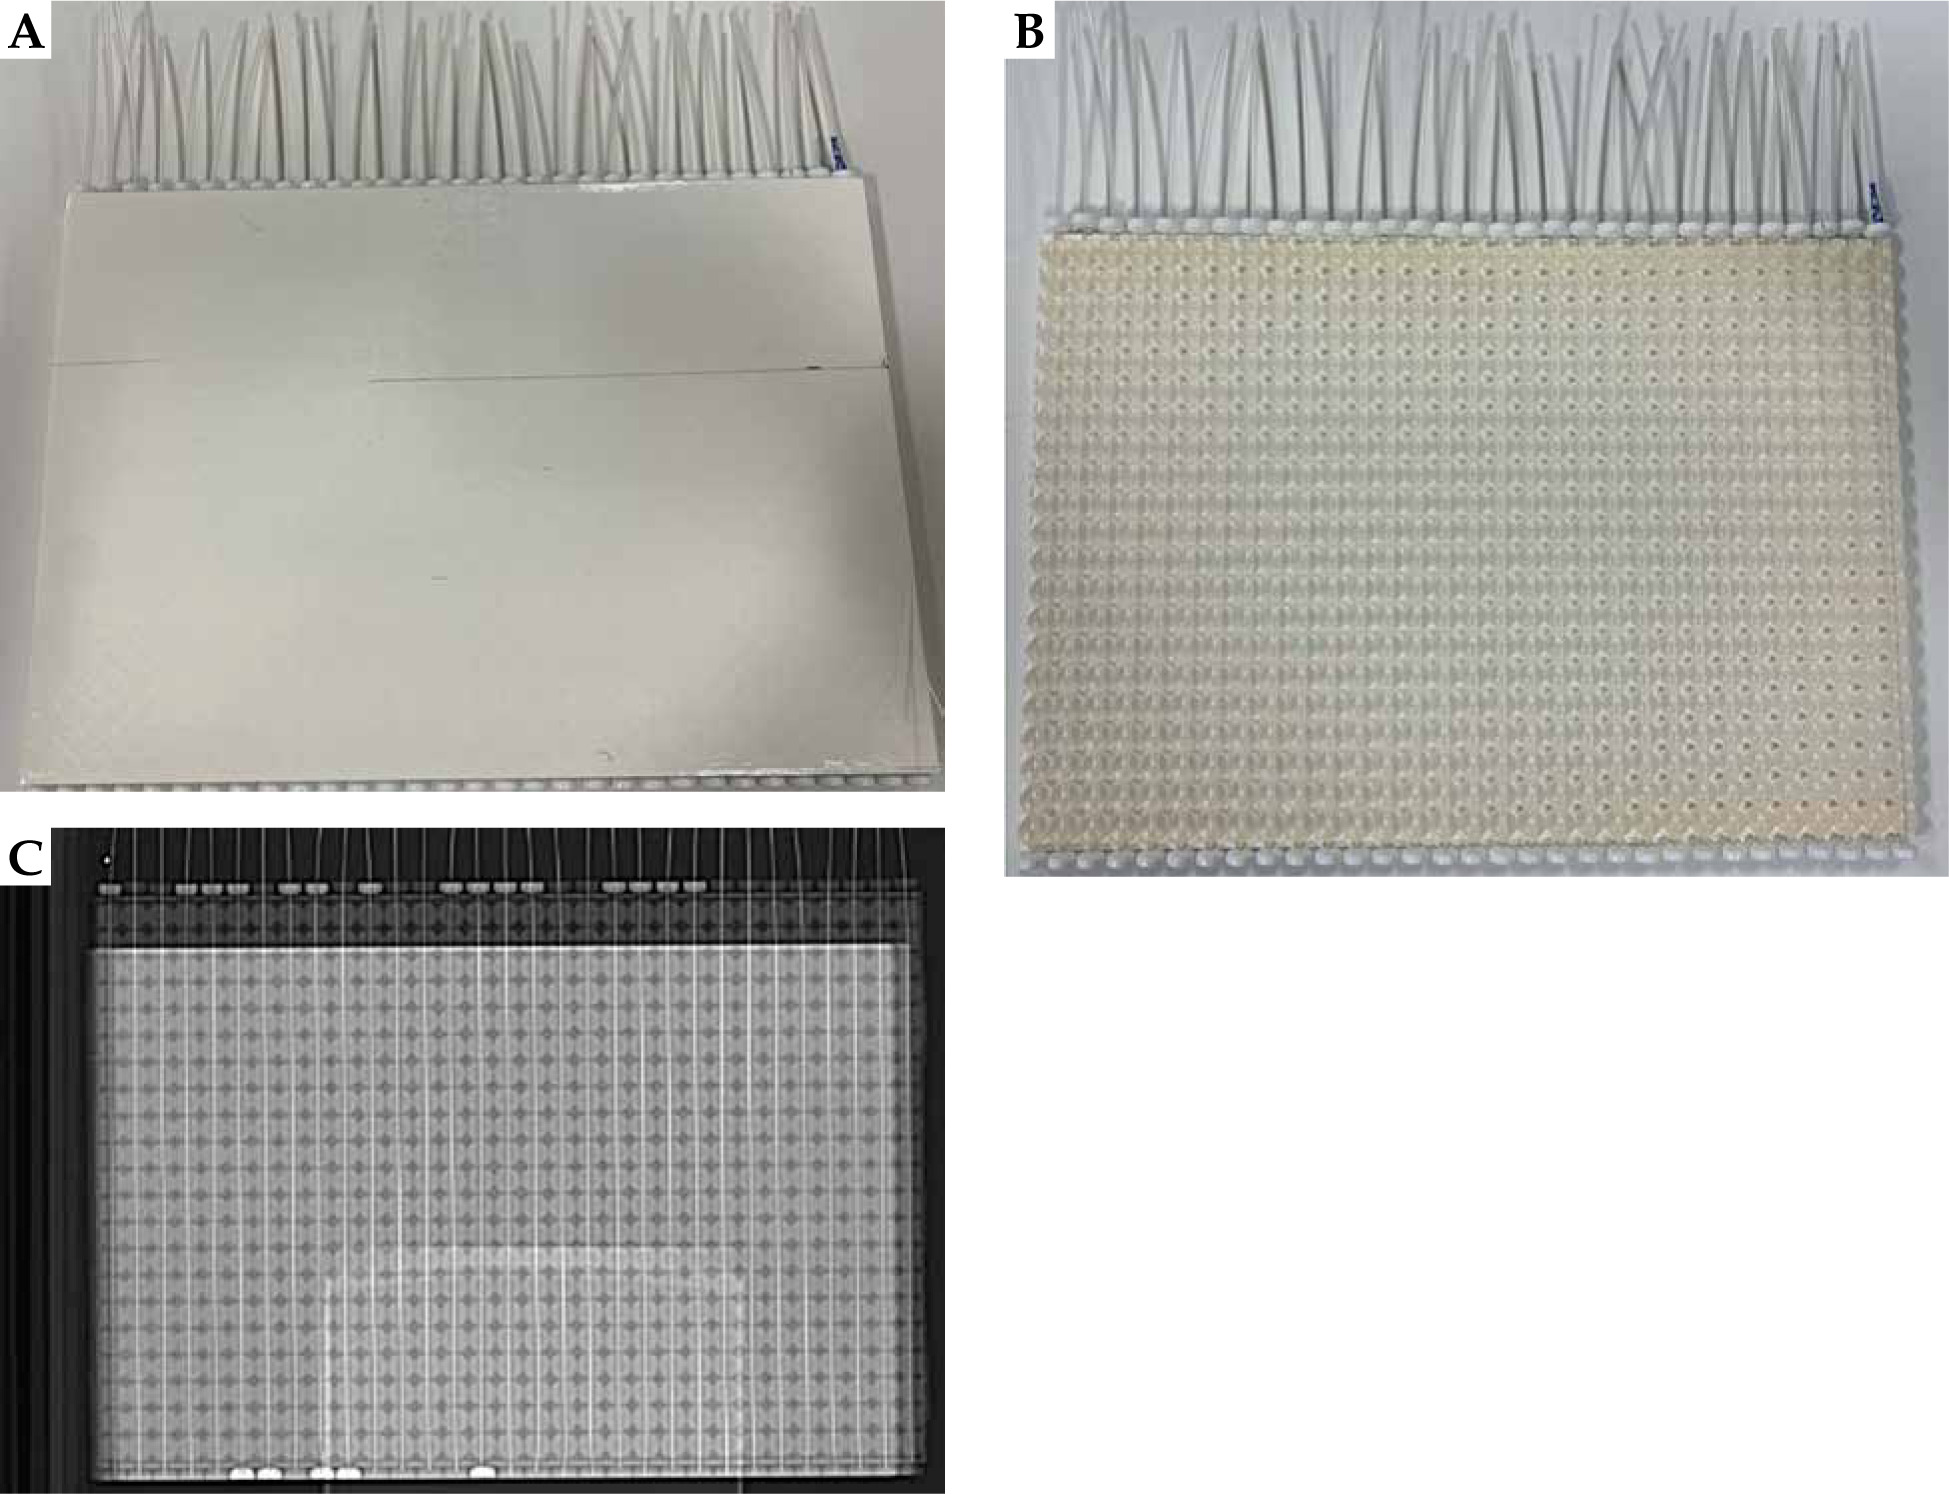
The phantom was compressed with plexiglass blocks taped on each side of the phantom to improve applicator immobilization. The phantom was imaged in axial orientation, first with CT (140 kVp, 200 mA, 0.90 mm × 0.90 mm in-plane resolution, and 1.25 mm slice thickness), and then with optimized MR PETRA sequence (TR 3.32 ms, TE 0.07 ms, 1 mm × 1 mm in-plane resolution, 1 mm slice thickness, and 384 × 384 mm2 FOV) using an UltraFlex Large 18 coil. Palms of patients’ afflicted hands were also scanned with identical parameters, except that for CT, in-plane resolution was 0.98 mm × 0.98 mm, MRI FOV was 352 × 352 mm2, and BioMatrix Spine 32 coil was additionally used for signal reception.
Catheter digitization and CT/MRI registration
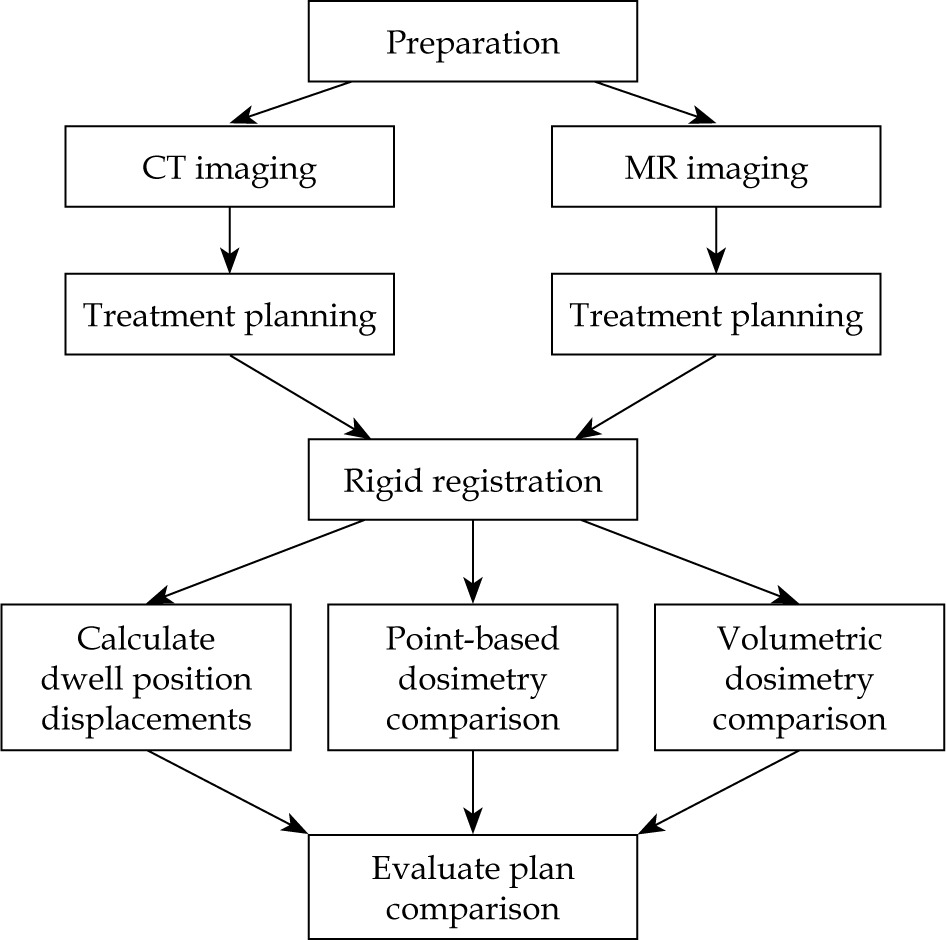
To determine whether MR could be used independently of CT to produce clinically acceptable SABT plans, both sets of images were uploaded to Oncentra Brachy (Elekta Brachytherapy, The Netherlands) TPS to produce treatment plans in parallel for subsequent comparison. Figure 2 provides an overview of the workflow of the study.
Catheters were digitized for all eight plans (one MR and one CT plan for the phantom and for each of the three patients). Prescription dose was provided by the physician, and dwell positions were activated using a 10 mm step size. For plans produced using the phantom, dwell positions were placed in every sphere, and identical dwell times were applied. For patient plans, identical dwell positions were activated, and dwell times were optimized to deliver the prescription dose at a depth of 3 mm. Initially, the planning was conducted using multiple-point normalization. Optimization was performed graphically starting from global and finalizing with local approach. Dose calculation was performed using TG-43U formalism. Cartesian coordinates of each dwell position were extracted from the completed plans using MATLAB (v. 9.13.0.2049777; MathWorks Inc., Natick, MA, USA), and pairs of dwell positions underwent rigid registration in MATLAB using an iterative closest point algorithm. The resulting transformation matrix (T) was applied to align the original set of Cartesian coordinates of dwell positions of the MR-based plan (M Original) to a set of coordinates (M Transformed) in the space associated with dwell positions of the CT-based plan, according to formula (1) for evaluation of the registration accuracy.
Accuracy of catheter reconstruction
The evaluation of registration of the dwell positions was conducted by determining the average Euclidean distance in Cartesian coordinates (x, y, and z) between each corresponding pair of dwell positions using MATLAB. For each treatment plan and for each catheter, the 3D Euclidean distance, d, between the ith pair of dwell positions was determined using equation (2):
Dosimetric analysis
To determine if the MR-based treatment plan could be used clinically, a dosimetric analysis was performed in point-based dose difference calculations, and a volumetric analysis. The point-based analysis was conducted by finding the dose at various points in the MR-based plan, applying transformation matrix on those points using equation (1), and comparing it with the dose at the corresponding points in the CT-based plan. The points were chosen along significant dose lines throughout the volume, and points along steep dose gradients were avoided. An additional comparison of surface dose points for the three MR and CT patient plans was performed using the same method.
To conduct volumetric analysis, DICOM files from each plan were exported to MIM Maestro software (v. 7.2.7; MIM Software Inc., Cleveland, OH, USA), and dose cloud volumes for each set of plans were segmented to D65, D80, D90, D95, D100, D125, and D150. Corresponding segmentations were compared using Dice similarity coefficient (DSC) shown in equation (3):
Where A and B correspond to the volume of the dose cloud segmentation for the CT and MR plans, respectively.
Results
Accuracy of MR-based catheter digitization
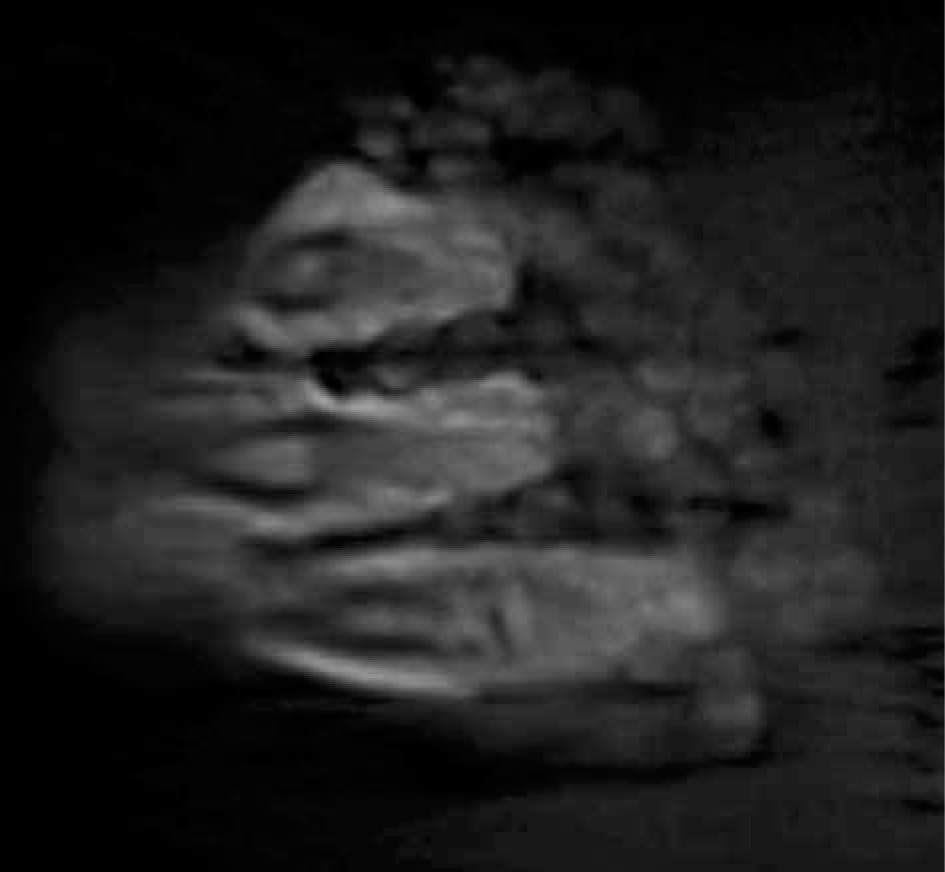
The PETRA sequence provided sufficient contrast between the catheters and the surrounding phantom in the MR-based scans, and allowed for successful catheter reconstruction in the treatment planning software (Figure 3). The patients in this study were also imaged successfully using the same sequence (Figure 4 shows a representative patient). For all eight scans (an MR and a CT for the phantom and for the three patients), treatment plans were successfully produced in parallel using MR-only and CT-only images for subsequent comparison. Figure 3 shows a comparison of an MR and a CT images of the phantom. Signal inhomogeneities were notable on the MR image due to close proximity of the receiving phased-array coil to the phantom, but these inhomogeneities did not interfere with catheter reconstruction.
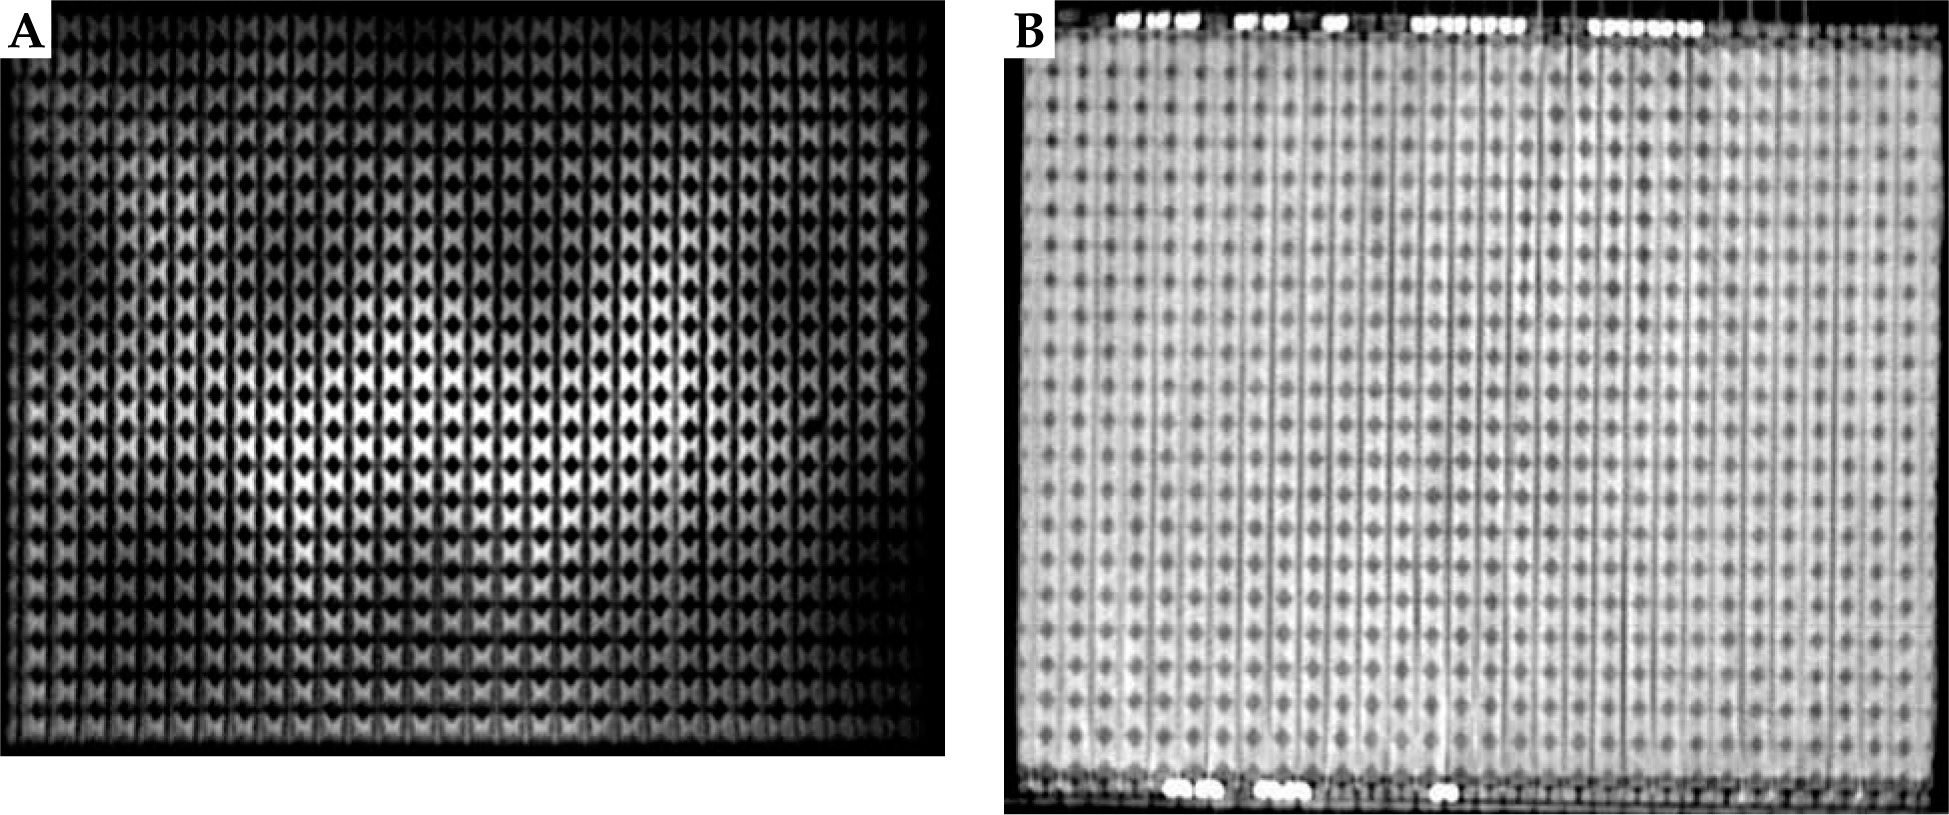
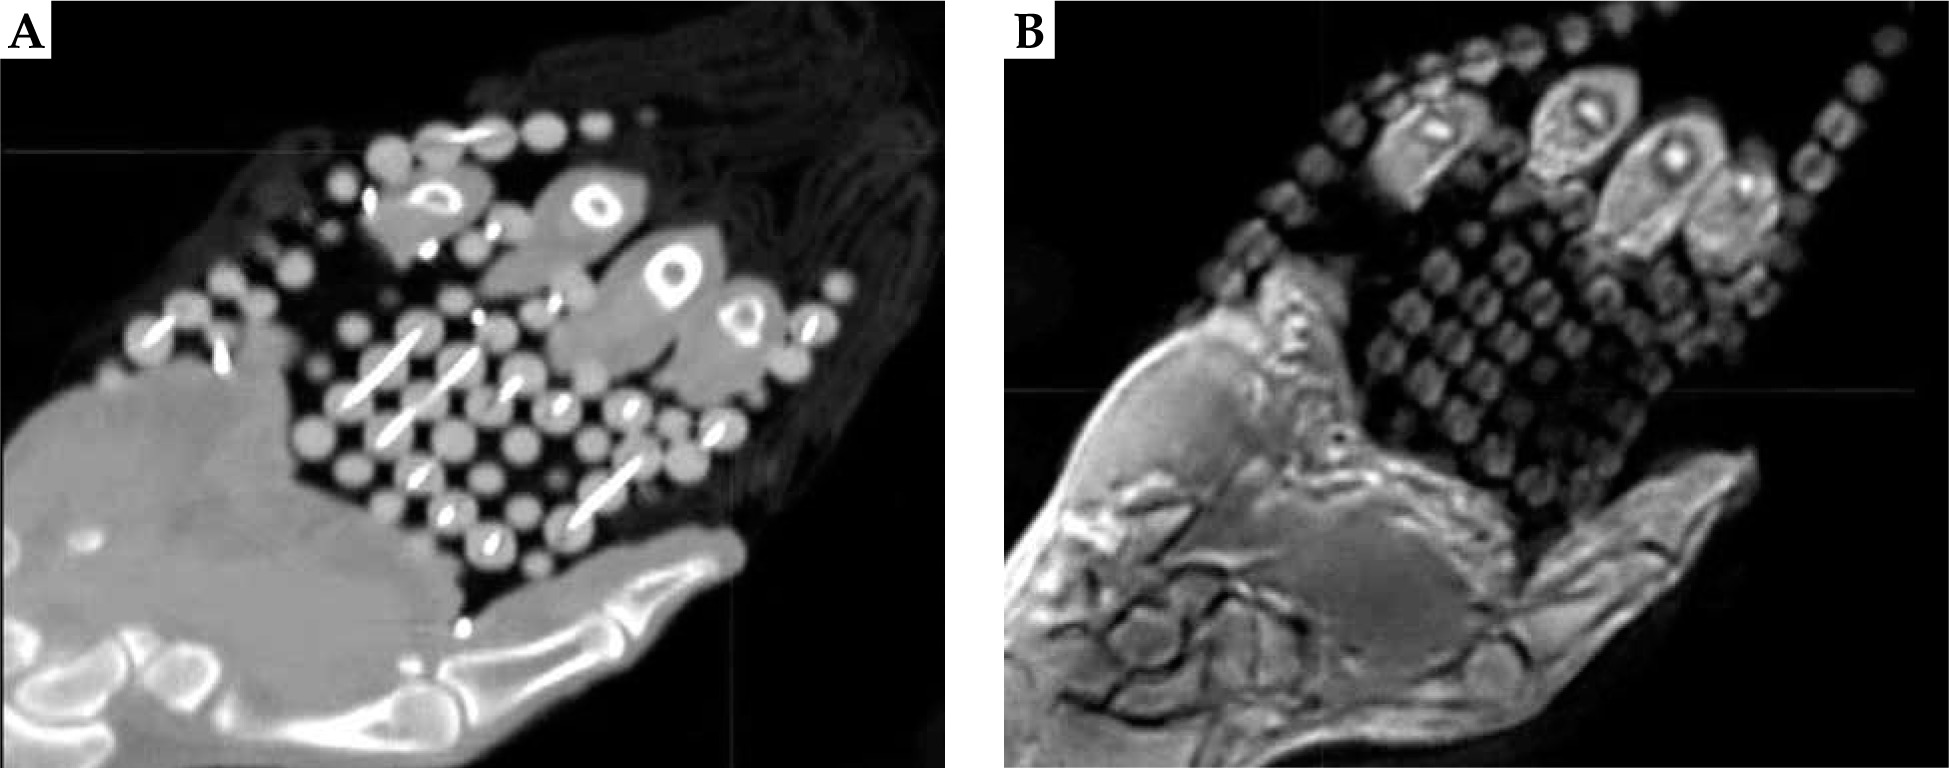
Figure 4 displays a CT and an MR images of patient 1. Although there was sufficient contrast to visualize the catheters, the outer catheters appeared displaced as a result of patient motion and lack of immobilization between the scans._
Accuracy of dwell positions
MATLAB’s native iterative closest point algorithm produced transformation matrices for each rigid registration. The transformation matrices were applied to each set of MR coordinates using equation (1) to produce a set of transformed MR coordinates. The transformed coordinates were plotted with CT coordinates to qualitatively evaluate registration accuracy. Figures 5 and 6 contain the dwell positions from the MR-based plans explicitly mapped onto the dwell positions from the CT-based plans. These graphs demonstrate how the transformed dwell positions from the MR-based plans map onto those from the CT-based plans. Euclidean distances between corresponding dwell positions were calculated using equation (2). The average displacement for each plan was calculated, and the average displacement for each catheter was plotted (Figures 7 and 8). The average Euclidean distances between the dwell positions for the phantom and the three patients are summarized in Table 1. The plans associated with the phantom presented sub-millimeter accuracy. The plans associated with the patients resulted in higher dwell position displacements because of lack of immobilization and patient motion between the scans.
Fig. 5
Rigid registration of dwell positions of MR-based plan and CT-based plan for the phantom in one plane
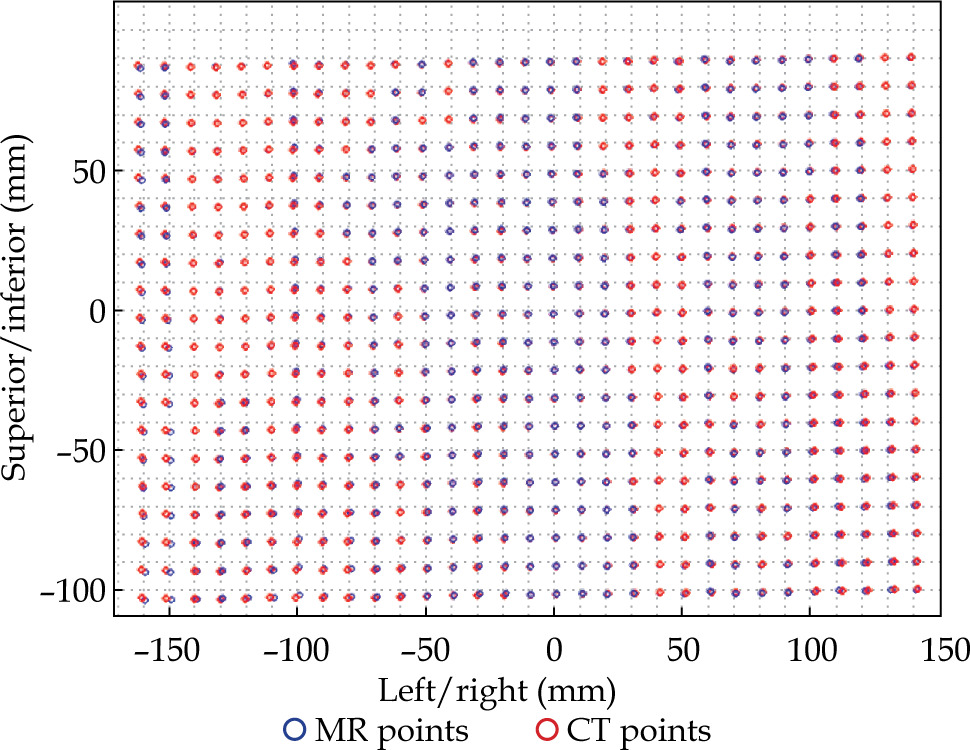
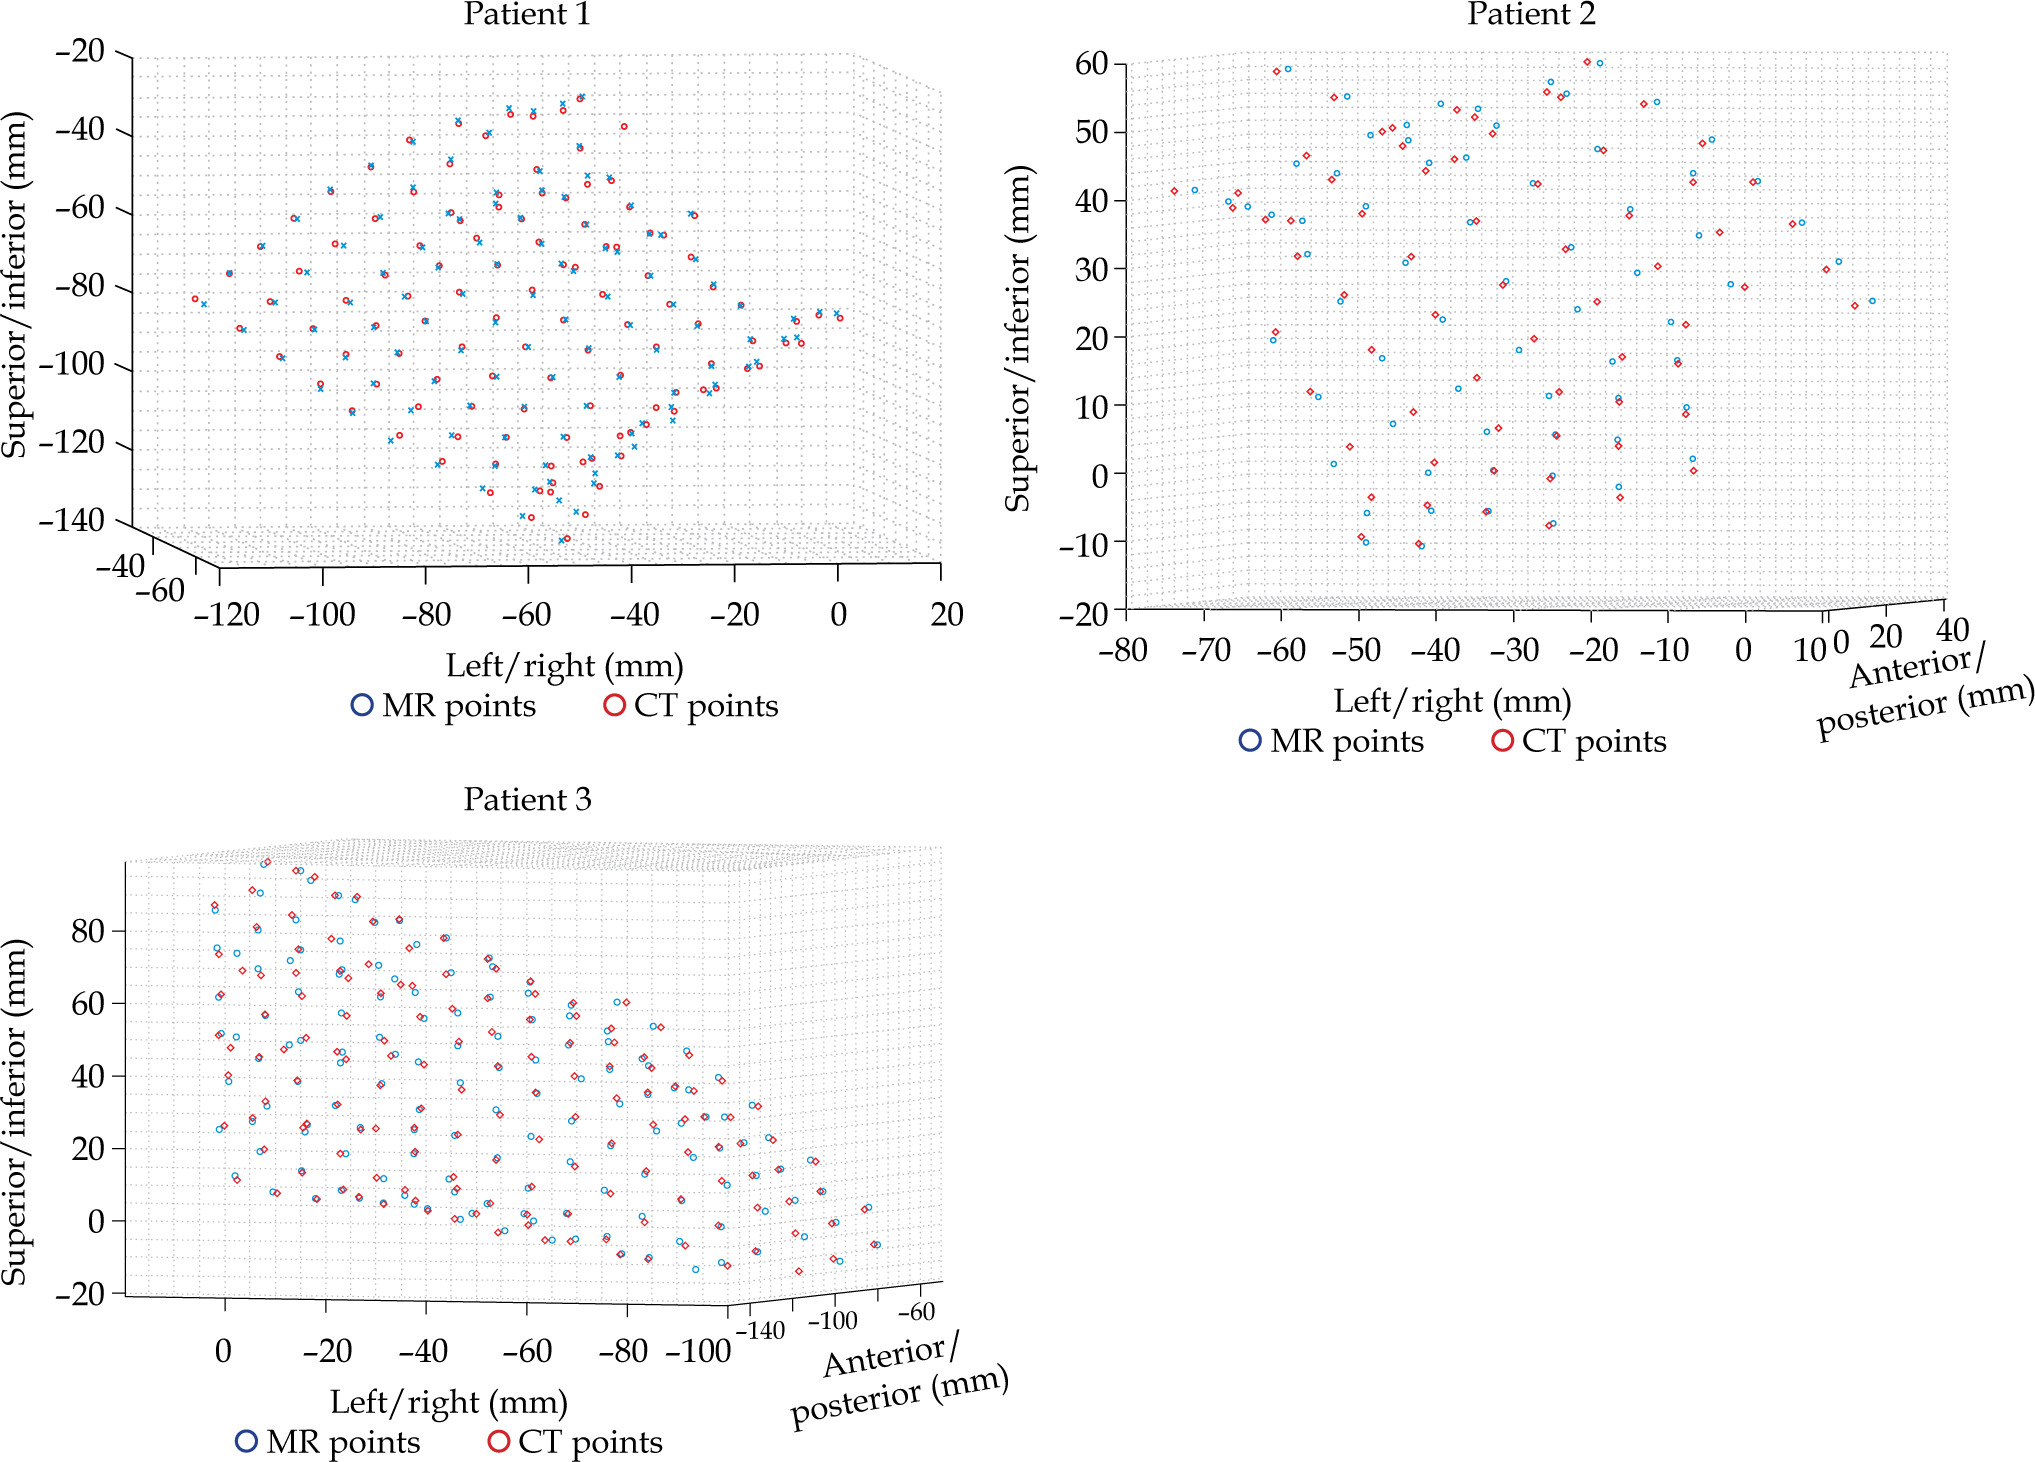
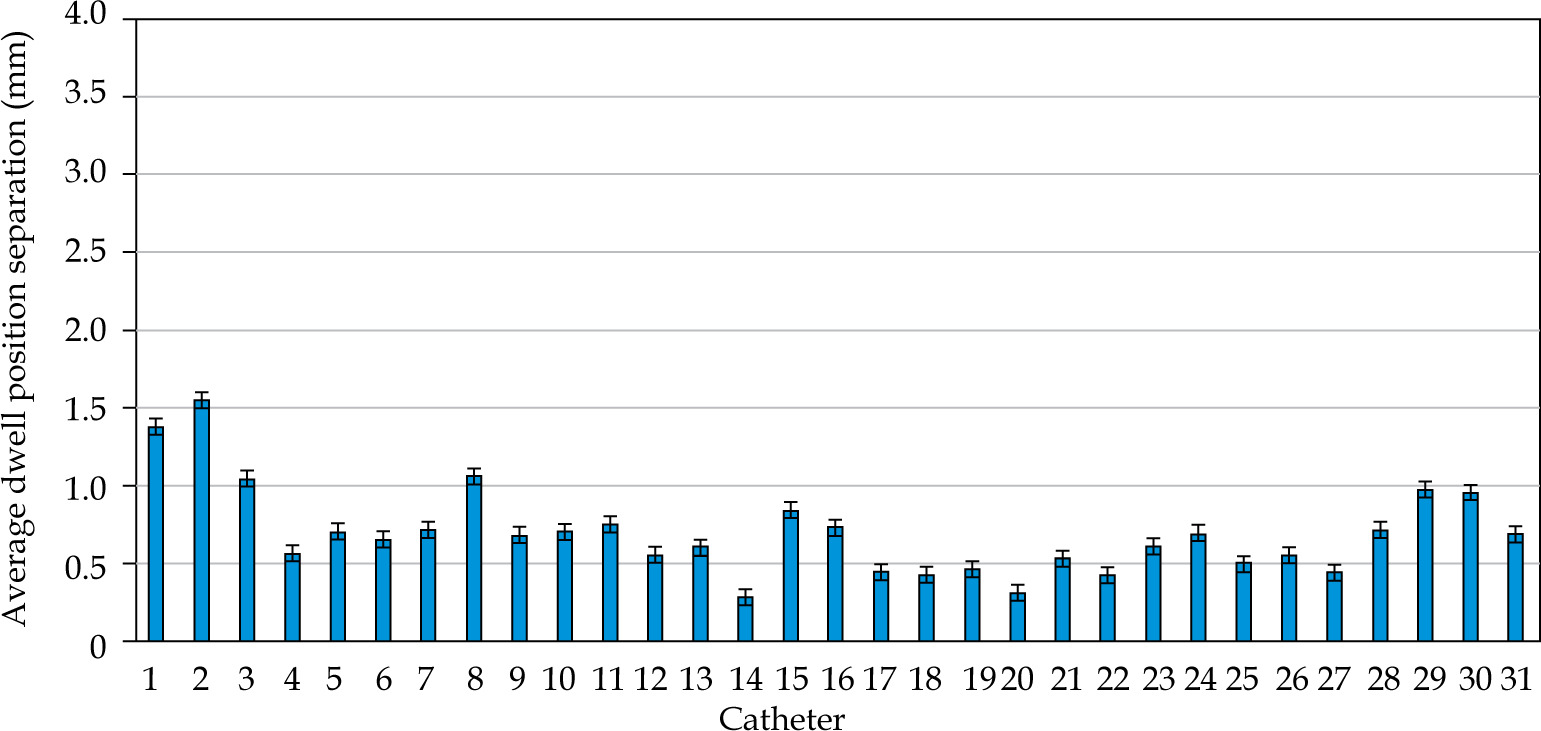
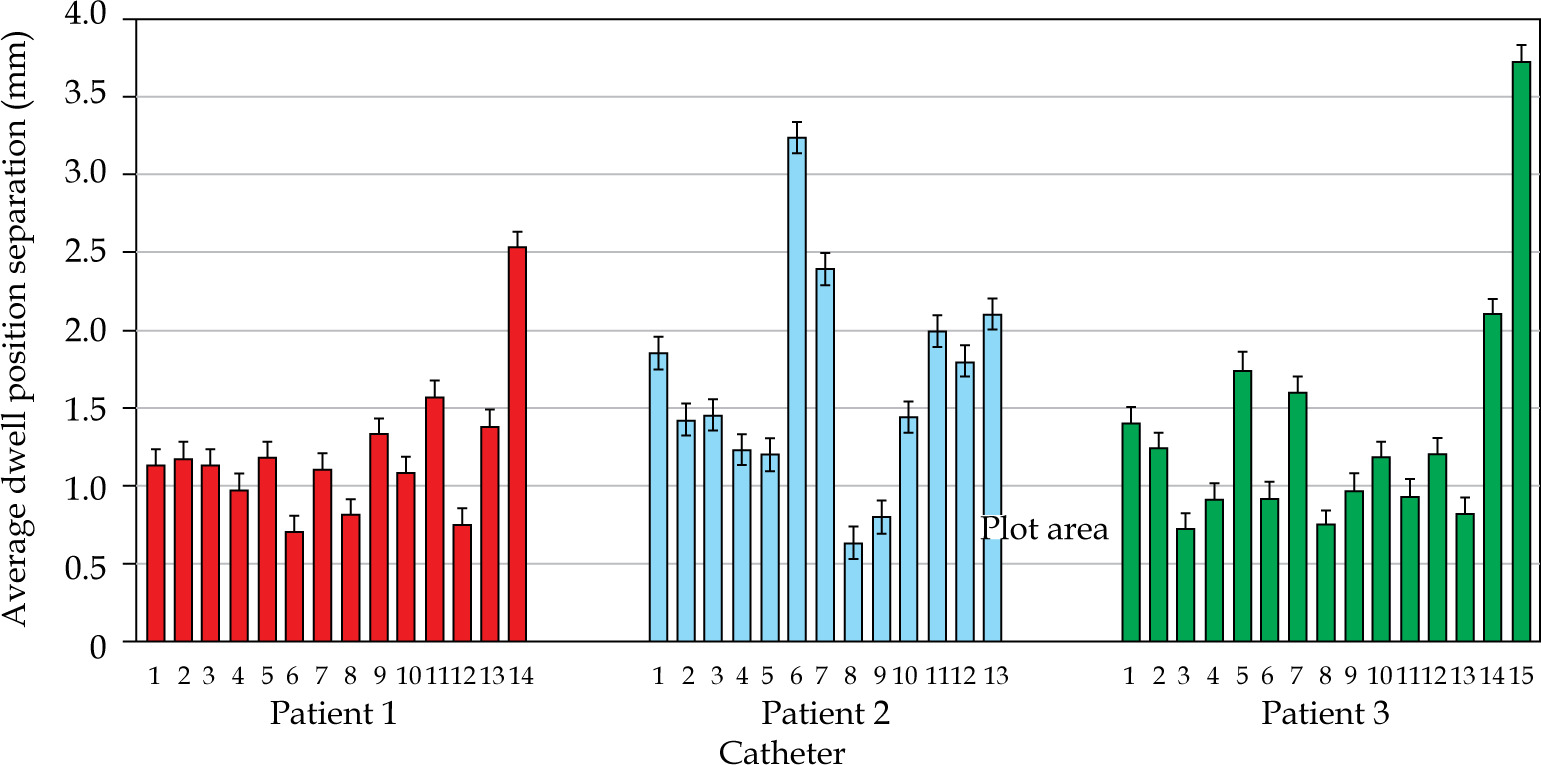
Table 1
Average dwell position displacement for each plan
| Treatment plan | Average dwell position displacement (mm) |
|---|---|
| Phantom | 0.68 ± 0.05 |
| Patient 1 | 1.15 ± 0.12 |
| Patient 2 | 1.69 ± 0.19 |
| Patient 3 | 1.22 ± 0.21 |
Figures 7 and 8 demonstrate the average displacement in corresponding dwell positions between the transformed MR-based coordinates and the CT-based coordinates. The plans associated with the phantom attained the greatest overlap as all but four catheters were accurate to within 1 mm. The largest displacements were observed for catheters 1 and 2. The relatively high average displacement of several catheters in the plans associated with the patients (e.g., patient 1, catheter 14) resulted from small regions of poor applicator’s contrast in MR images at the edge of FOV.
Accuracy of dosimetric analysis
According to the point-based dosimetric analysis, the average dose differences for the points throughout the volume were 0.92% for the phantom, and 1.93%, 1.86%, and 2.15% for the patients. The results of the dose differences for the phantom and a representative patient are shown in Tables 2-4. For the phantom, the dose differences were on average accurate to within 1%, whereas for the patients, the dose differences were marginally higher (~2%). This mismatch for the patient plans can be attributed to patient motion and lack of catheter immobilization.
Table 2
Results of point-based dosimetry analysis for the phantom. The average dose difference is 0.92%
Table 3
Results of point-based dosimetry analysis for patient 1. The average dose difference is 1.93%
| Dose from CT-based plan (cGy) | Dose from MR-based plan (cGy) | Dose difference (%) | |
|---|---|---|---|
| Point 1 | 392.6 | 401.3 | 2.22 |
| Point 2 | 216.1 | 214.9 | 0.56 |
| Point 3 | 262.4 | 255.1 | 2.78 |
| Point 4 | 181.3 | 182.5 | 0.66 |
| Point 5 | 301.4 | 311.7 | 3.42 |
Table 4
Results of the surface comparison for patient 1. The average dose difference is 2.63%
| Dose from CT-based plan (cGy) | Dose from MR-based plan (cGy) | Dose difference (%) | |
|---|---|---|---|
| Point 1 | 350.0 | 363.0 | 3.66 |
| Point 2 | 290.6 | 299.2 | 2.96 |
| Point 3 | 332.9 | 327.0 | 1.77 |
| Point 4 | 332.0 | 339.0 | 2.11 |
The dose difference calculations for each point are displayed in Figures 9 and 10; in particular, the dose differences for D100 were 2.5%, 2.22%, 0.67%, and 4.96% for the phantom and the three patients, respectively. Figure 9 demonstrates that the dose differences for the phantom were on average lower than those for the patients. For the patients, catheter displacement between the scans resulted in discrepancies in the dose difference calculations.
Fig. 9
Results of Dice similarity coefficient (DSC) calculations for a selection of dose volumes for the phantom
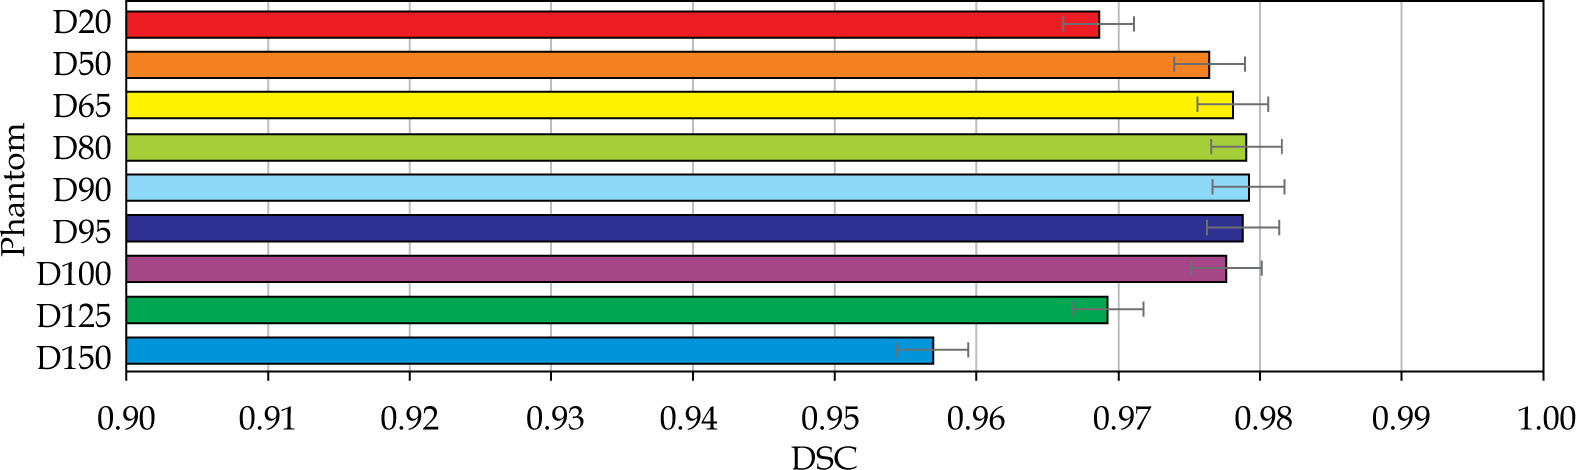
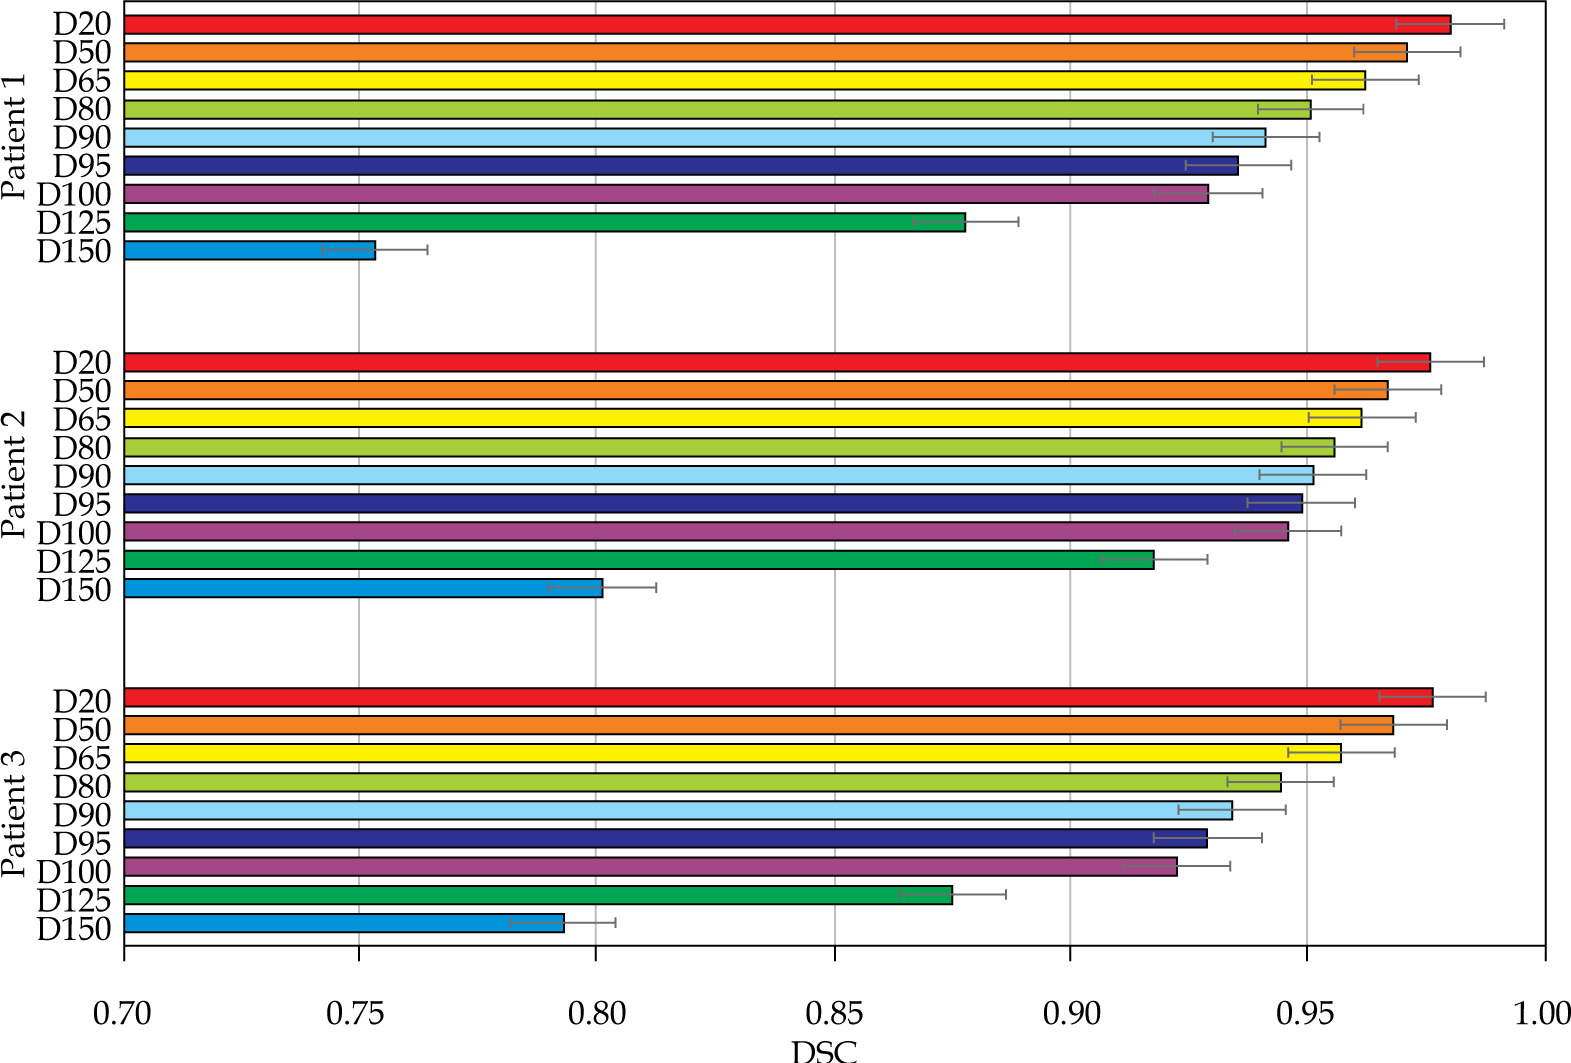
Fig. 10
Results of Dice similarity coefficient (DSC) calculations for a selection of dose volumes for each of the patients
The surface-point dose differences for the patient plans were 2.63%, 3.32%, and 3.34%. Figure 10 shows a comparison of the individual points. Because the points were chosen across the patient’s surface, these points were more subject to variation due to patient motion than the points within the volume. In particular, patient 2 had a notably higher average dwell position displacements then patient 1, which contributed to an increased dose difference.
The volumetric analysis was completed, and the summary of DSC calculations are presented in Figures 11 and 12. For the phantom, all segmentations had DSC scores greater than 0.95. For the patients, the D90 and D95 segmentations had DSC scores great than 0.9. The D125 and D150 segmentations had lower DSC scores (DSC ≤ 0.8) for the patients because of catheter displacement and patient’s motion; however, these volumes (D125 and D150) did not have critical significance in SABT treatments.
Discussion
Computed tomography imaging has historically been the primary imaging modality for catheter digitization in SABT planning [1, 3, 8-10]. A potential shortcoming of this approach is that the reliance of CT-based planning comes at the cost of soft-tissue contrast [11]. Prior research has associated increased tumor size with lower median overall survival [10]. Because an increased tumor size can result in a varied tumor depth, there are likely some patients for whom the clinically accepted treatment depth does not provide sufficient coverage of the treatment site. To address this issue, a previous study demonstrated the feasibility of using MRI to plan SABT [1] with PETRA sequence adapted to provide sufficient contrast to visualize flap applicators [4]. This prior study produced clinically acceptable treatment plans, but was limited to the use of phantoms and a volunteer. In the current study, the scope of the work was expanded to include patient data in addition to a unique phantom produced following earlier work in SABT phantoms [11]. Furthermore, the work presented here displays an MR-only approach to clinical cases for the first time. In the previous work, the standard CT-based approach was used, and the resulting clinical data was compared to MR-based treatment plan generated off-line. In order to implement this new MR-only approach, the phantom was improved to minimize registration errors generated by motion. Additionally, clinical data on MR-only treatments of the skin patients were presented. This unique approach allowed generation of individualized treatment plans for each patient.
The clinically acceptable treatment plan (average displacement < 1 mm) produced for the phantom further substantiates the feasibility of MR-based SABT. With the higher soft-tissue contrast afforded by magnetic resonance, MR-based SABT provides a novel treatment approach to patients with lesion sites of variable depths and thicknesses. The MR plan using the phantom resulted in the most accurate registration, because the catheters were completely immobilized within the plastic structure of the phantom. Although there were notable signal inhomogeneities in the MR image of the phantom, they did not impact treatment plan generation as there was still sufficient contrast to digitize the catheters. The inhomogeneity of patterns reflected the positions of individual elements of the flexible receiving coil, which was placed vertically right in front of the axially positioned phantom. Furthermore, these inhomogeneities were more notable than in previous studies due to the proximity of the coil to the phantom. This placement aimed at preventing the coil from sliding during this experiment, and differs from the clinical coil placement that allows for more distance between imaged body part and receiver.
For the three patient plans, the average dwell positions displacements were greater than what is generally considered clinically acceptable (displacement > 1 mm), but this mismatch of dwell positions can be attributed to between the scans, which is outside the methodology of this approach. For a plan created solely by MR images, motion between scans would not be a factor, and this mismatch would not exist. The volumetric comparison using DSC is a common statistical tool with a long history in comparing brachytherapy treatment plans for different modalities [12-14], and the high DSC scores of the plan comparisons for the phantom (DSC > 0.95) lent further credence to the feasibility of this approach. The sub-optimal DSC scores for some volume segmentations can also be attributed to motion between scans or lack of immobilization, and would not be a concern for MR-only SABT. The comparisons of higher dose volumes (in particular, D150 and D125) are most affected by patient motion as the spatial volumes (i.e., the number of points contained in each dose cloud) are smaller than those of lower dose volumes; however, these volumes are generally not of high importance in SABT treatments.
Limitations of this study include its small sample size and retrospective nature, which make the study prone to selection bias. Before MR-based SABT can be clinically implemented, a future study registering the modified PETRA sequence to a scan that visualizes treatment site would be required to achieve the goals described above. Additionally, despite the creation of a clinically acceptable treatment plan, there were some regions (particularly those at the edge of FOV) that were difficult to visualize due to insufficient contrast, which resulted in the relatively large mismatch of some dwell positions or geometric distortion. Greater fidelity in future studies can be ensured by placing markers visible in both MR and CT images. Ensuring that all potential dwell positions could be visualized before exporting the images to TPS will help mitigate this mismatch, and further improve the accuracy of treatment plan.
Conclusions
The use of MR-only treatment planning for SABT can potentially improve treatment outcomes using accurate target delineation and individualized treatment optimization. Specifically, additional soft tissue contrast afforded by MR can allow a clinician to delineate the target better than a treatment plan based only on CT. The present investigation demonstrated that the optimized PETRA sequence produces plans comparable with CT-based plans to sub-millimeter accuracy. Furthermore, the dose point comparisons and dose distributions of the MR-based plans were comparable with the CT-based plans (DD < 5% and DSC > 0.95, respectively). This study demonstrates the potential to perform MR-based SABT in a clinical setting.


